Assessment of performance
and parameter sensitivity of multicomponent
geothermometry applied to a medium enthalpy
geothermal system
Fabian Nitschke
1*, Sebastian Held
1, Ignacio Villalon
2, Thomas Neumann
1and Thomas Kohl
1Background
The estimation of reservoir temperatures is a major goal in geothermal exploration. The in situ temperature is a key parameter for the assessment of geothermal potentials and the economic efficiency of prospected reservoirs. Deducing these temperatures from the chemical composition of geothermal fluids emerging at the earth’s surface is a com-monly used and relatively cost-effective method. Over more than five decades a large number of solute geothermometers have been established and constantly improved [e.g., Fournier and Rowe (1966), Giggenbach (1988), Can (2002), Sanjuan et al. (2014)]. Many of these interrelations, linking the concentration of one constituent or the ratios
Abstract
The determination of reservoir temperatures represents a major task when exploring geothermal systems. Since the uncertainties of classical solute geothermometry are still preventing reliable reservoir temperature estimations, we assess the performance of classical geothermometers and multicomponent geothermometry by applying them to fluids composed from long-term batch-type equilibration experiments and to fluids from natural geothermal springs in the Villarrica area, Southern Chile. The experiments, weathering two reservoir rock analogues from the Villarrica area, highlight a strong impact of reservoir rock composition on the fluid chemistry and, consequently, on calculated in situ temperatures. Especially temperatures calculated from classical solute geothermometry are strongly affected. Multicomponent geothermometry is obviously more robust and independent from rock composition leading to significantly smaller temperature spreads. In a sensitivity analysis, the dilution of geothermal fluid with surfi-cial water, the pH and the aluminum concentration are anticipated to be the factors causing underestimations of reservoir temperatures. We quantify these parameters and correct the results to obtain realistic in situ conditions. Thus, enabling the application of the method also on basis of standard fluid analysis, our approach represents an easy-to-use modification of the original multicomponent geothermometry leading to very plausible subsurface temperatures with significantly low scattering.
Keywords: Multicomponent geothermometry, Classical solute geothermometers, Laboratory alteration experiments, Villarrica geothermal system
Open Access
© The Author(s) 2017. This article is distributed under the terms of the Creative Commons Attribution 4.0 International License (http://creativecommons.org/licenses/by/4.0/), which permits unrestricted use, distribution, and reproduction in any medium, provided you give appropriate credit to the original author(s) and the source, provide a link to the Creative Commons license, and indicate if changes were made.
RESEARCH
*Correspondence: [email protected] 1 Institute of Applied Geosciences (AGW) at Karlsruhe Institute of Technology, Karlsruhe, Germany
of cations (SiO2, Na/K, K/Mg, Na/K/Ca) to the in situ temperature, are based on rather well known water–rock interaction processes (silica solubility, cation exchange in the feldspar system and equilibria of micas). Furthermore, empirical geothermometers using the ratios of Na/Li and Mg/Li (Fouillac and Michard 1981; Kharaka and Mariner 1989; Sanjuan et al. 2014) has been established, additionally accounting for fluid salinity, chlo-ride concentration and the geology of the reservoir. However, solute geothermometry still is afflicted with great uncertainties often leading to a broad range and often incon-sistent calculated reservoir temperatures (Santoyo and Díaz-González 2010; Verma and Santoyo 1997), in particular exploring geothermal systems, where only few infor-mation (geology, borehole data etc.) is available. Even in studies in which the individual geothermometers has been carefully selected regarding their applicability and validity for the expected conditions, the resulting temperatures show variations of often more than 100 K for the same sample (e.g., Pepin et al. 2015; Aquilina et al. 2002; Mutlu 1998; D’Amore et al. 1994).
Recently, a number of geochemical surveys have evaluated the in situ temperatures of the geothermal system in the Villarrica area in Southern Chile, where many natu-ral geothermal springs discharge in direct vicinity of the active Villarrica volcano. The estimations of subsurface temperatures resulted in widely differing and even inconsist-ent data. Sánchez et al. (2013) roughly determined temperatures of 100–180 °C from cation ratio geothermometers, with the warmest temperatures close to the volcanoes. Whereas, estimations based on the temperature-dependent oxygen isotope fractionation
in the system SO42−–H2O (Held et al. 2015), temperatures ranging from 80 to 130 °C,
are significantly lower. Although, in a previous work from these authors (Nitschke et al. 2016), the warmer temperatures of the first study (in the North) as well as the cooler of the latter (in the South) were partly confirmed, the results were accompanied with large uncertainties for the individual springs of up to 130 K. Temperature estimations with uncertainties of that level are unsatisfactory for reliable exploration.
Many factors interfering precise and consistent results have been identified and dis-cussed in literature. For calculating reservoir conditions based on the solubility of only
one mineral phase (e.g., SiO2 geothermometers), the amount of solvent has to remain
of rock composition on the equilibrated fluids in detail and to deduce implications for classical solute geothermometer applications. Furthermore, the numerical multicom-ponent geothermometry method as proposed originally by Reed and Spycher (1984) is assessed, evaluating if its statistical nature can overcome dependence upon reservoir rock composition. In order to facilitate the application of multicomponent geothermom-etry on basis of a standard fluid analysis, we suggest an easy-to-use modification of the original method.
Methods and results
The detailed geological setting of the study area is documented in previous works of Held et al. (2016b) and Sánchez et al. (2013). They found a prominent change of lithology associated with the virtually E-W striking Mocha-Villarrica-Fault Zone. South of that fault plutonic rocks of the North Patagonian Batholith (NPB) prevail, while to the north mainly volcanic and volcano-clastic rocks of the Cura-Mallin (CM) formation outcrop. Depending upon this local lithology change, strontium isotope measurements (Held et al. 2015) reveal spatially differing geothermal fluids, with a plutonic signature south of the volcanic chain and a volcanic signature in the north of the study area. Accordingly, for the experimental approach, two reservoir rock analogues were selected, representing the two different geological units: a Mesozoic tonalite (NPB) and a Cenozoic porphyric andesite (CM) for long-term batch reaction experiments.
Usually, reservoir rocks and their compositions are poorly known during exploration of a geothermal system and effects of different mineralogical compositions on geother-mometers are difficult to handle. By calculating the equilibration temperature of a large number of (reservoir) rock forming minerals, multicomponent geothermometry pro-vides a more statistical approach of determining in situ temperatures. Therefore, this method is more unbiased from reservoir rock composition. To test this hypothesis, we apply the method on natural emerging geothermal fluids from the Villarrica area and on the fluids derived from laboratory experiments to compare the results to temperatures calculated with classical solute geothermometers.
Laboratory water–rock equilibration experiments
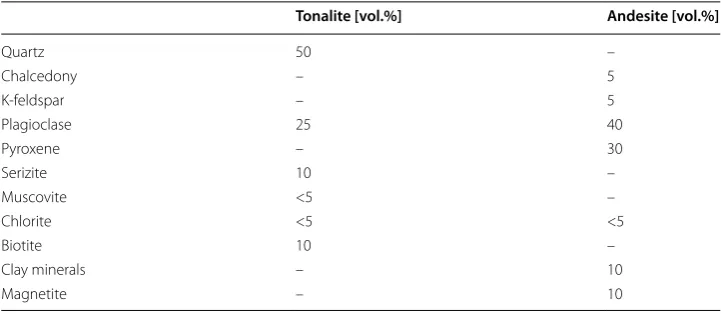
A tonalite and the andesite were chosen for the experiments as they were presumed to be the most likely reservoir rocks for the natural geothermal fluids due to their spatial distribution in the study area. Prior to the water–rock interaction experiments, the min-eral compositions of both rock samples were analyzed in detail. The quantification of the mineral assemblages [vol.%], derived from thin-section microscopy and X-ray
diffrac-tion (Siemens D500) are given in Table 1. The absence of K-feldspar in the tonalite and
the differing SiO2 polymorphs (only chalcedony in the andesite and only quartz in the
tonalite) are of particular importance in terms of geothermometry.
The experimental setting described below was designed according to the findings from several test runs leading to a progressive refinement of the laboratory procedure due to an increasing expertise. In order to reduce reaction time towards equilibrium to a mini-mum, the reactive surface was enlarged by grinding the rock samples with an agate disc mill to a grain size <63 μm. After that treatment, the surface area of both samples is in
measurements. Then, 40 g of rock powder was transferred to a hermetic stainless-steel batch reactor. Avoiding any head space, the vessel (150 mL) was then completely filled
up with pure H2O. The rock–water ratio was ~0.3. The reaction temperature was chosen
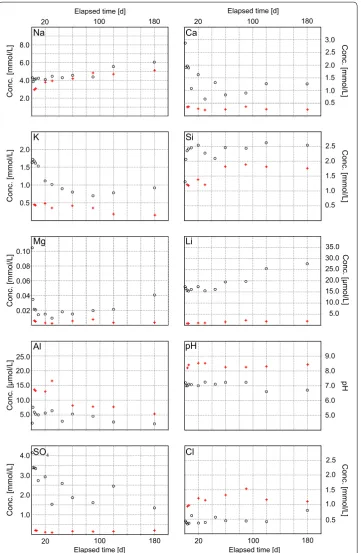
to be 140 °C, which is the anticipated mean reservoir temperature in the study area. To control the development of fluid composition over time and to enable the identification of steady state conditions, the experiments were sampled and analyzed in a time series after 1, 2, 4, 6, 10, 20, 30, 45, 60, 90, 120, and 180 days (Fig. 1). Each time step represents an autonomous experiment and therefore ensures the reproducibility of results. After termination of the experiments, fluids were centrifuged and filtered (cellulose acetate membrane, pore size <0.45 µm). In order to stabilize the solution (preventing supersatu-rated phases from precipitation), an immediate dilution of the cooled sample with pure
H2O is of particular importance. The fluid composition was measured using inductively
coupled plasma mass spectrometry (Thermo Fisher, X-Series2) for the cations and ion chromatography (Dionex, ICS-1000) for the anions. Silicon concentrations were deter-mined by spectrophotometry (PerkinElmer Lambda 2S).
The chemical evolutions of the major constituents over time are depicted in Fig. 1 and in a tabular form in Appendix. Measured aqueous constituents are assumed to be pre-sent as a result of water–rock interaction. Due to the fact, that only low mass transfer occur for both experiments, the minerals being educts and products of fluid–solid reac-tions were not determined (resulting changes of solids were below the detection limit of XRD (<5 mass%) and SEM–EDX (very thin alteration products). Therefore, conclu-sions made in terms of geothermometric applications, are based on changes of water chemistry only. Comparing both experiments, significant differences in fluid composi-tions become obvious. Towards the end of the reaction time, the fluid in contact with tonalite has a TDS of about 700 mg/L, whereas the TDS of the fluid from the andesite
experiment is about 500 mg/L. The tonalite fluid can be classified as a Na–SO4 fluid of
near neutral pH (6.7), while the andesite fluid is a Na–Cl fluid with a higher pH of 8.5. Sodium concentrations are very similar (5–6 mmol/L) for both experiments at the end of the reaction time, with a nearly continuous, but diminishing increase over time. The tonalite fluid is found to have high concentrations of potassium and calcium at early stages, but decreasing over the duration of the experiment. The andesite fluid is showing
Table 1 Volumetric mineral composition of reservoir rock analogues used for laboratory experiments
Tonalite [vol.%] Andesite [vol.%]
Quartz 50 –
Chalcedony – 5
K-feldspar – 5
Plagioclase 25 40
Pyroxene – 30
Serizite 10 –
Muscovite <5 –
Chlorite <5 <5
Biotite 10 –
Clay minerals – 10
Fig. 1 Temporal development of concentrations of major constituents (Na, K, Ca, Mg, Li, Si, Al, SO4, Cl and pH)
of the laboratory equilibration experiments plotted versus elapsed reaction time (tonalite experiments black
relatively constant concentrations for both cations, but remaining on a significantly
lower level compared to the tonalite fluid. Aqueous SiO2 concentrations of both fluids
reach a steady state already in relatively early stages of the experiments (after 4 days for the tonalite fluid, after 45 days for the andesite fluid). However, they differ strongly from each other. Being hardly explainable, although, we observe that the andesite fluid sat-urates with respect to quartz, whereas the chalcedony saturation of the tonalite fluid,
leads to significantly higher SiO2 concentrations.
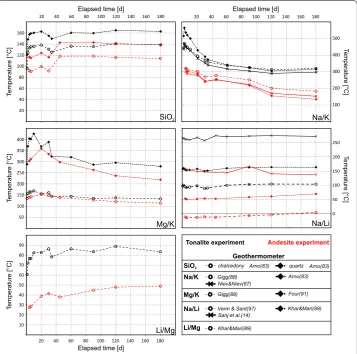
Applying these results to geothermometry, the consequences for SiO2
geothermom-eters are becoming obvious (Fig. 2),—resulting in over—or underestimations of about
20 K (for the given reaction temperature of 140 °C). But also for further geothermom-eters, the reservoir rock composition affects temperature estimations. The application of Na/K geothermometer equations lead to even significantly higher discrepancies (Fig. 2). Formulations of Arnórsson (1983) or Fournier and Truesdell (1973) work very well for the andesite fluids approaching the reaction temperature of 140 °C towards the end of
the experiments, whereas the temperature of the tonalite fluids is strongly overestimated with temperatures of >300 °C. This failure may be explained by the absence of K-feldspar in the tonalite and therefore the Na/K equilibrium in this case is controlled by other potassium phases (e.g., muscovite), leading to a relative potassium enrichment, which results in that significant temperature overestimation.
The Mg/K geothermometer of Giggenbach (1988) estimates reaction temperatures for both experiments quite well. Especially for the tonalite fluids, the calculated temperature (137 °C) reflects the reaction conditions in nearly perfect agreement. For the andesite fluids calculated temperatures approach reaction temperature over the course of the experiments, but decrease to slightly underestimated temperatures towards the end (120 °C). Na/Li based temperature determination (Kharaka and Mariner 1989; Sanjuan et al. 2014; Verma and Santoyo 1997) is obviously rather less appropriate, giving a broad range of apparently erratic results depending upon experiment and applied formulation. The method leads to dramatic underestimated temperatures (Verma and Santoyo 1997) but also really well fitting results (Sanjuan et al. 2014) for the andesite experiment. Cal-culated temperatures for the tonalite fluids range from underestimations (Verma and Santoyo 1997) to high overestimations (Sanjuan et al. 2014). The Li/Mg geothermometer (Kharaka and Mariner 1989) underestimates the reaction temperature for both experi-ments to a great extent.
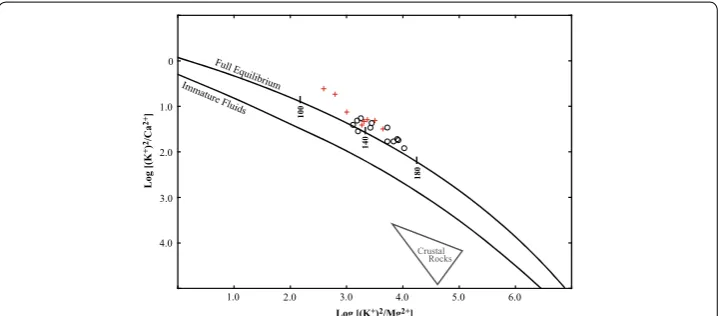
As the steady state of the fluids is a crucial point for further analysis, the chemical
water–rock equilibrium is assessed considering the concentrations of K+, Ca2+ and
Mg2+ (Fig. 3). The method was originally proposed by Giggenbach and Goguel (1989).
In contrast to many other methods for the evaluation of water–rock equilibrium, which plot fluid data versus theoretical concentrations derived from solving geothermometer equations (Giggenbach 1988; Tassi et al. 2010), this approach is (beside of the K–Mg geothermometer) taking account for the equilibrium of K-feldspar, K-mica, chlorite, cal-cite and silica (Hedenquist 1991). It is shown that the experimental fluids plot far away
from the state of initial crustal rock dissolution, but very close to the full equilibrium curve.
If the application of one geothermometer is successful, inaccurate or failing cannot be explained in every case (e.g., like for the Na/K geothermometer). As laboratory proce-dures are identical for both experiments (sample preparation for solids and fluids and the setup of experiments), we conclude that the differences of fluid compositions com-paring both experimental series in this specific case can only be due to the differences in rock composition. These discrepancies lead to different steady states of fluid composi-tions, which is consequently resulting in differences of calculated temperatures. Even if one of the geothermometers would yield a correct estimation of the reservoir tempera-ture, there is no indication for the selection of that appropriate one when exploring a geothermal site.
Multicomponent geothermometry
The determination of in situ temperatures by multicomponent geothermometry, is based
on the calculation of the saturation indices (SI = log(Q/K)) for a suite of possible
(res-ervoir) rock minerals in a conceivable temperature interval. Based on a complete fluid
analysis, an equilibrium temperature (temperature for which SI = 0) for each considered
mineral phase is obtained. In contrast to classical solute geothermometry, the results represent a temperature distribution in which the fluid has been equilibrated with the host rock minerals. This enables the calculation of a mean in situ temperature from the bandwidth of obtained equilibration temperatures and gives insight on the uncer-tainty of this estimation (maximum spread of temperatures). From that point of view, multicomponent geothermometry can be considered as a statistical approach to predict reservoir temperatures and therefore it might be more applicable for the evaluation of systems with unknown mineralogy, which is often the case especially in early stages of geothermal exploration campaigns.
This study applies an approach similar to the original method suggested by Reed and Spycher (1984) and revisited by Spycher et al. (2014), Peiffer et al. (2014) and Palmer et al. (2014). Equilibration temperatures are calculated for feldspars (K-feldspars and
albite), SiO2 polymorphs (quartz or chalcedony), phyllosilicates (muscovite, paragonite,
PhreeqC version 3.1.4 (Parkhurst and Appelo 2013) and thermodynamic data of Delany and Lundeen (1991).
According to this, in situ temperatures were calculated for the wells Caranco (Car), Chihuio (Chi), Liquine (Liq), Liucura (Liu), Los Pozones (Poz), Menetue (Men), Palguin (Pal), Panqui (Pan), Rincon (Rin), Rinconada (RinCo), San Luis (SL) and Trancura (Tra),
all located in the vicinity of the Villarrica volcano (Fig. 4). In a first run, the SiO2
pol-ymorph was determined, to calculate the appropriate silica equilibration temperature. For further analysis (pH- and aluminum sensitivity and for the final temperature deter-mination) the polymorph, which yield the better fitting temperatures (smaller devia-tion to mean temperatures from total mineral assemblage) was applied. Chalcedony was applied to the three southernmost springs (Car, Chi and Liq) and to the tonalite experiment. In situ temperatures for all other samples were calculated for quartz. The fluid compositions were determined analogously to measurements of experimental flu-ids (“Laboratory water–rock equilibration experiments” section). The detailed chemical compositions (major constituents) are depicted in Appendix.
Figure 4 provides a comparison of temperatures derived from multicomponent
geothermometry (preliminary temperatures without correction of dilution, pH and
aluminum concentration) to results calculated by a suite (n = 23) of classical solute
geo-thermometers (SiO2, Na/K, Na/K/Ca, K/Mg, Li/Mg and Na/Li geothermometers
accord-ing to the equations given by Arnórsson (1983), Can (2002), Diaz-Gonzalez et al. (2008) Fouillac and Michard (1981), Fournier (1977, 1979), Fournier and Potter (1982), Fournier and Truesdell (1973), Giggenbach (1988), Kharaka and Mariner (1989), Michard (1990), Nieva and Nieva (1987), Tonani (1980), and Verma and Santoyo (1997). The results were depicted as boxplots, plotting the mean (median value) equilibration temperature, the lower and upper quartiles (comprising 50% of all temperatures) and the lower and upper extremes. The ranges of temperatures for the springs in the Villarrica area and for the
Fig. 4 Distribution of temperatures calculated for the Villarrica springs and the laboratory batch experiments [TON tonalite experiment (180 days), AND andesite experiment (180 days)] using classical solute geother-mometers (light grey) compared to temperature distributions derived from multicomponent geothermom-etry (dark grey). Classical solute geothermometer temperatures (SiO2, Na/K, Na/K/Ca, K/Mg, Li/Mg and Na/Li)
fluids derived from the experiments calculated by multicomponent geothermometry are significantly smaller as compared to the very large spread obtained from classical sol-ute geothermometers. Despite special attention paid to the applicability of each solsol-ute geothermometer, it is shown that classical geothermometers generally lead to a broad
spread of temperatures of, in some cases, ≫100 K. The spread of temperatures derived
from multicomponent geothermometry is much smaller.
At the same time, the calculated mean (median) temperatures are significantly lower. Although deviation of calculated temperatures for the experimental fluids is quite small (124 °C for the andesite experiment and 133 °C for the tonalite experiments), estimations for some springs lead to implausible low values, ranging below the discharge temperature
(e.g., discharge temperature/calc. temperature for Car = 82/77 °C or Chi = 85/69 °C). At
least in those cases temperatures are interfered by processes which were obviously not taken into account in this preliminary calculation. Generally, calculated temperatures appear to underestimate in situ temperatures, as in any case being significantly cooler compared to classical geothermometer temperatures. The identification and quantifica-tion of the critical parameters being most sensitive for the system and necessary correc-tions calculated realistic reservoir temperatures are presented in the following section.
Discussion
For the systematical underestimation of calculated temperatures discerned in “Multi-component geothermometry” section, a number of processes or parameters are worth considering. Anticipated processes are the dilution with superficial water during ascent of fluids, the deviation of measured pH from in situ pH (due to degassing and as a func-tion of temperature), as well as the uncertainties of aluminum concentrafunc-tions (due to precipitations, sampling, sample storage and measurement errors). To quantify the impact of each parameter and to obtain realistic in situ conditions is a major task. There-fore, we conducted a sensitivity analysis on each of the mentioned parameters. In terms of the pH and the aluminum concentration, the best-fit results of this analysis (minimi-zation of total temperature spread and densification of clustering of the majority of tem-peratures) are assumed to represent the most likely in situ conditions, which are then basis for the final temperature estimation.
Dilution with superficial water
On the basis of chlorofluorocarbon measurements (CFC-11, CFC-12 and CFC-113), which yield the degree of dilution of the fluids from the geothermal springs (Held et al. 2016a), the deep reservoir fluid composition is reconstructed. To obtain the original composition, a simple binary mixing model of the discharged fluid and the composition of the Lake Villarrica (representing the superficial water) according to Eq. (1) is applied.
with concentration C and dilution fraction x for the reservoir fluid r, the chemical com-ponents i and the springs j.
(1)
Cr,i,j=
Cm,i+
xj·Cs,i
To evaluate the impact of dilution (mixing) on calculated reservoir temperatures, equi-libration temperatures for the sample compositions and the adjusted original reservoir
fluid compositions are plotted versus their degree of dilution (Fig. 5). It is shown that
the expected impact of dilution on reservoir temperature calculation is hardly notable. The spread of calculated temperatures shows no trend with the degree of dilution. The deviation of mean equilibration temperatures of the original reservoir fluid compared to the sample composition is very low, reaching maximum ~15 K for sample Liu, which is the most highly diluted sample (1:1). At least in the presented case, where relatively low mineralized geothermal fluids occur (concentrations of most constituents of geothermal fluids and surficial waters range in the same order of magnitude), multicomponent geo-thermometry appears to be quiet robust against dilution. Applying this to highly min-eralized fluids, the system may be more sensitive and hence temperature estimation uncertainty may increase.
In situ pH value
Among the reservoir rock forming minerals, (alumino-)silicates are of major impor-tance. Beside of being dependent upon temperature, the solubility of silicates is also con-trolled by the pH of the solution. As a consequence of degassing of geothermal fluids (depressurization during ascent) and the cooling of the fluid, measured pH can strongly differ from in situ values affecting calculated multicomponent geothermometer temper-atures. Due to an increasing solubility of silicates with increasing alkalinity, the applica-tion of an excessive elevated pH will lead to an underestimaapplica-tion of temperatures (Figs. 6, 7). Therefore, the pH is a crucial and critical system parameter to the same extent. In order to correct the measured pH to in situ conditions, numerical approaches have been established [e.g., Reed and Spycher (1984)], which require an extensive high-precision
fluid analysis with respect to pH-controlling species and parameters (CO2, H2S,
organ-ics, redox condition, etc.). However, the majority of geochemical surveys and explora-tion campaigns usually only perform standard fluid sampling and analysis implying limitations in this regard. To enable the application also for standard fluid analysis, the determination of in situ pH and the subsequent correction of equilibration temperatures
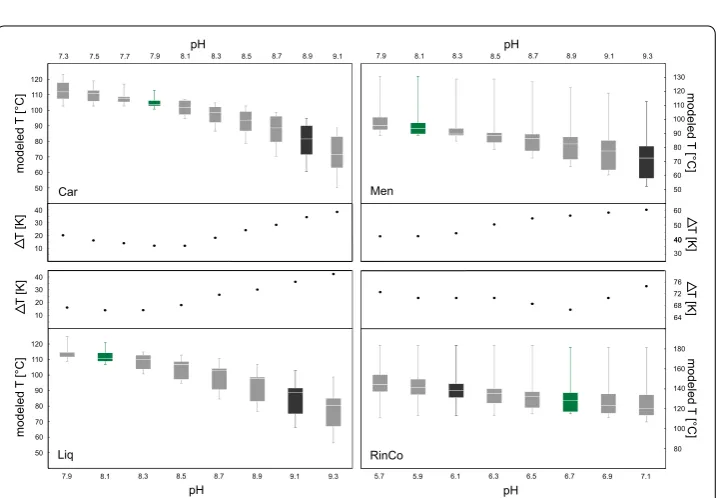
Fig. 6 Distribution of calculated temperatures for the laboratory experiments using multicomponent geo-thermometry together with the according temperature spreads (ΔT) plotted versus solution pH. Measured pH is indicated in black (tonalite experiment) and dark red (andesite experiment)
9.1 9.3
Car
Liq RinCo
10 20 30 40
50 60 70 80 90 100 110 120 50 60 70 80 90 100 110 120
50 60 70 80 90 100 110 120 130 7.3 7.5 7.7 7.9 8.1pH8.3 8.5 8.7 8.9 7.9 8.1 8.3 8.5pH 8.7 8.9 9.1
9.3
7.9 8.1 8.3 8.5 8.7 8.9 9.1 5.7 5.9 6.1 6.3 6.5 6.7 6.9 7.1 pH
pH
60
40
64 50
76 72 68
80 100 120 140 160 180 10
20 30 40
modeled
T
[°C]
modeled
T
[°C]
modeled
T [°C]
modeled
T
[°C]
T
[K
]
T
[K
]
T [K
]
T [K
]
40 30 Men
is done based on a numerical sensitivity analysis. In a first step, fluids derived from the laboratory experiments, where the reaction temperature is controlled and degassing can
be excluded, were investigated (Fig. 6). It is shown that calculated temperatures reflect
experimental conditions in a quite good agreement, being only slightly too low for both experiments for the measured pH values. Mean temperature for tonalite experiment at pH 6.7 is 133, and 124 °C for the andesite experiment at pH 8.5. A decrease of pH reduces the equilibration temperature spread and slightly increases the calculated in situ
temperature (Fig. 6). Considering the least temperature spread as the indication for the
most likely in situ pH, calculated mean temperature for the andesite experiment can be corrected to 130 °C at pH 7.5. The measured near neutral pH of the tonalite experiment obviously already reflects conditions, which are close to reaction condition.
Variation of calculated equilibration temperatures as a function of pH can also be documented for the spring fluids (Fig. 7). Applying the measured pH, the obtained tem-peratures appear to be too low (partly below discharge temperature, e.g., Car and Chi). Especially for samples with high measured pH (e.g., Car and Liq), which potentially reflects extensive degassing, a large temperature spread is obtained. Applying lower pH values results in an increase of modeled temperatures and a decrease of tempera-ture spread. The minimum of the equilibration temperatempera-ture spread (and secondly the clustering of the majority of calculated temperatures) was taken to determine the most likely in situ pH, which then can be used to deduce the reservoir temperature. For sam-ples with a measured slightly acidic pH (e.g., RinCo), modeled in situ pH will trend also towards neutral conditions resulting in a decrease of modeled mean temperature.
Aluminum concentration
Besides the pH, also the aluminum concentration is a critical parameter effecting tem-perature calculations significantly. Being component of most fluid composition con-trolling minerals (alumino-silicates), correct aluminum concentrations are necessary to
calculate reliable equilibration temperatures for those minerals (Table 2). Unfavorably,
the determination of dissolved aluminum in geothermal fluids is often interfered by sec-ondary processes during ascent of fluids (precipitation), sampling and sample handling
Table 2 Aluminum concentrations of Villarrica springs measured by ICP–MS in comparison to results of previous studies
Aluminum This study [mmol/L] Sánchez et al. (2013) [mmol/L] Pérez (1999) [mmol/L]
Car 0.004 n/a n/a
Chi 0.001 0.073 n/a
Liq 0.005 0.040 0.004
Liu 0.002 n/a 0.011
Poz 0.001 n/a bdl
Men 0.002 n/a 0.030
Pal 0.003 0.075 0.004
Pan 0.001 n/a n/a
Rin 0.003 0.026 n/a
RinCo 0.001 n/a bdl
SL 0.001 0.013 bdl
(e.g., coagulant for silica gel formation and incorporation) in the laboratory (Brown 2013).
These issues are evident, when comparing aluminum concentrations of spring fluids in the study area measured in this study to results from previous works (Table 2). Results differ partly up to a factor of 20, which will increase the saturation indices by ~1.3. Thus, aluminum concentrations (input parameter) were varied within the bandwidth of reported measured aluminum concentrations in the study area (Table 2). The pH values were set according to the findings from pH sensitivity analysis.
As anticipated, calculated mean equilibration temperatures increase with higher alu-minum concentration (Fig. 8). Yet, the spread of temperatures is decreasing significantly until a minimum is reached. Also the majority of equilibration temperatures cluster in a smaller range. The best-fit in situ aluminum concentration is determined analogously to the in situ pH determination (least temperature spread). It can be shown that for the
sample Car (Fig. 8) and the experimental fluids, measured aluminum concentrations
already represent that best-fit aluminum concentrations, i.e., these fluids are in the state closest to equilibrium. The calculated temperatures for the majority of the spring fluids increase in the range of 10–35 K. Sample RinCo obviously, had been in a state of largest distance to equilibrium, resulting in 51 K warmer temperature estimation as a result of aluminum correction. Therefore, we suggest that, the consecutive correction of pH and aluminum concentration will lead to more realistic in situ temperatures. Equilibration temperatures which were determined in this way are displayed in Table 3. The multicom-ponent geothermometer approach, including the application of pH and aluminum con-centration adjustments, seems to yield plausible temperature estimates, as the initially
modeled T [°C ] 50 60 70 80 90 100 110 120 130 0.010 0.001 0.002 0.003 0.004Al conc. [mmol/L]0.005 0.006 0.007 0.008 0.009
0.010 0.001 0.002 0.003 0.004 0.005 0.006 0.007 0.008 0.009
Al conc. [mmol/L] 0.001 0.005 0.007 0.010Al conc. [mmol/L]0.015 0.020 0.025 0.030 0.035 0.040 0.045 0.020 0.002 0.010 0.011 0.012Al conc. [mmol/L]0.013 0.014 0.015 0.016 0.018 0.030
60 80 100 120 140 70 80 90 100 110 120 130 modeled T [°C] 80 100 120 140 160 180 200 modeled T [°C ] modeled T [°C ] 5 10 15 20 25 25 30 35 40 20 5 10 15 20 25 12 2436 48 60 T [K ] T [K ] T [K ] T [K ] Car Liq RinCo Men
rather low temperatures indicated by aluminum containing minerals increases and
con-verge towards the initially significantly higher SiO2-phases temperatures. This is true for
the natural geothermal fluids as well as for the already very accurate initial estimations of the laboratory experiments carried out at 140 °C.
Conclusions
In many cases, the application of different classical solute geothermometer equations leads to a wide range of calculated temperatures. An important factor interfering con-sistent calculation are differences in reservoir rock composition and their impact on fluid chemistry. Long-term batch equilibration experiments in this study clearly show that reservoir rock composition has a major impact on temperatures calculated by classical solute geothermometry, with variations of >200 K. In order to overcome the strong dependence upon rock composition, we assess the statistical multicomponent geothermometer approach. Since the original method demands high quality fluid sam-pling and analysis, we suggest a modification, which can be used also on the basis of standard fluid analysis. Compared to classical solute geothermometry, the resulting cal-culated equilibration temperatures have a significantly smaller scattering for fluids of plutonic and volcanic origin in the investigated area. It is shown that the pH value and the aluminum concentration are extremely sensitive parameters for the calculation of equilibration temperatures on the basis of multicomponent geothermometers. Thus, as measured values for both parameters can differ significantly from in situ conditions, we suggest applying a correction for the pH and the aluminum concentration prior to tem-perature determination. In doing so, multicomponent geothermometry leads to more
realistic mean temperature estimation with significantly low variances of mostly ≪30 K
for the natural samples as well as for the experimental fluids. The well-fitting calcula-tions of reaction temperatures for both experiments, reveal a higher independence from
Table 3 Mean in situ temperatures for Villarrica springs and laboratory experiments cal-culated by a suite of classical solute geothermometers, multicomponent geothermometry and pH/aluminum-corrected multicomponent geothermometry
Spring Classical solute
geothermom-eters Multicomponent geother-mometer Corrected multicompo-nent geothermometer Mean T [°C] ΔT [K] Mean T [°C] ΔT [K] Mean T [°C] ΔT [K]
reservoir rock composition as compared to classical solute geothermometers. This could make multicomponent geothermometry an ideal complementary approach to classi-cal solute geothermometer methods evaluating subsurface temperatures particularly in unknown lithologies. The general applicability to a wide range of reservoir rocks has to be proven in the next step. In terms of classical solute geothermometry, we conclude that the impact of reservoir rock composition is of outstanding importance and has to be taken into account in future applications.
Authors’ contributions
FN—conception and design of the study, experimental work, analysis, modelling, paper writing. SH—experimental work, analysis, paper writing. IV—experimental work. TN—analysis, paper revision. TK—interpretation, paper revision. All authors read and approved the final manuscript.
Author details
1 Institute of Applied Geosciences (AGW) at Karlsruhe Institute of Technology, Karlsruhe, Germany. 2 Department of Geol-ogy, Facultad de Ciencias Fısicas y Matematicas, Universidad de Chile, Santiago, Chile.
Acknowledgements
The study is part of a collaborative research project of Karlsruhe Institute of Technology (KIT) and the Andean Geother-mal Center of Excellence (CEGA, Fondap-Conicyt 15090013). The authors appreciate the support of the BMBF-CONICYT International Scientific Collaborative Research Program (FKZ 01DN14033/PCCI130025). Additional support under the topic “Geothermal Energy Systems” of the Helmholtz portfolio project “Geoenergy” and by EnBW Energie Baden-Würt-temberg AG is gratefully acknowledged. Many thanks to two anonymous reviewers, who helped to significantly improve the manuscript.
Competing interests
The authors declare that they have no competing interests.
Availability of data and materials
Data on which conclusions of the manuscript are based are presented in the text, otherwise they are adequately cited.
Appendix
Table
4
M
ain c
onstituen
ts [mg/L] of the geothermal springs in the
Villarric
a ar
ea and of fluids deriv
Publisher’s Note
Springer Nature remains neutral with regard to jurisdictional claims in published maps and institutional affiliations.
Received: 17 March 2017 Accepted: 10 July 2017
References
Aquilina L, Ladouche B, Doerflinger N, Seidel JL, Bakalowicz M, Dupuy C, Le Strat P. Origin, evolution and residence time of saline thermal fluids (Balaruc springs, southern France): implications for fluid transfer across the continental shelf. Chem Geol. 2002;192:1–21.
Arnórsson S. Chemical equilibria in icelandic geothermal systems-implications for chemical geothermometry investiga-tions. Geothermics. 1983;12:119–28.
Arnórsson S. Isotopic and Chemical Techniques in Geothermal Exploration, Development and Use. International Atomic Energy Agency: Vienna; 2000.
Brown K. Mineral scaling in geothermal power production: geothermal training programm. Reykjavik: United Nations University; 2013.
Can I. A new improved Na/K geothermometer by artificial neural networks. Geothermics. 2002;31(6):751–60.
D’Amore F, Gianelli G, Corazza E. The geothermal area of El Pilar-Casanay, state of Sucre. Venezuela. Geochemical explora-tion and model. Geothermics. 1994;23:283–304.
Delany JM, Lundeen SR. The LLNL thermochemical data base—revised data and file format for the EQ3/6 package. 1991. Diaz-Gonzalez L, Santoyo E, Reyes-Reyes J. Tres nuevos geotermómetros mejorados de Na/K usando herramientas
com-putacionales y geoquimiométricas: aplicación a la predicción de temperaturas de sistemas geotérmicos. Revista Mexicana de Ciencias Geológicas. 2008;25(3):465–82.
Fouillac C, Michard G. Sodium/lithium ratio in water applied to geothermometry of geothermal reservoirs. Geothermics. 1981;10(1):55–70.
Fournier RO. Chemical geothermometers and mixing models for geothermal systems. Geothermics. 1977;5:41–50. Fournier RO. A revised equation for the Na/K geothermometer. Geotherm Resour Council Trans. 1979;3:221–4. Fournier RO. Water geothermometers applied to geothermal energy. In: D’Amore F, editor. Applications of geochemistry
in geothermal reservoir development. Italy: UNITAR, Rome; 1991.
Fournier RO, Potter RW. Revised and expanded silica (quartz) geothermometer. Geotherm Resour Counc Bull. 1982;11:3–12.
Fournier RO, Rowe JJ. Estimation of underground temperatures from the silica content of water from hot springs and wet-steam wells. Am J Sci. 1966;264:685–97.
Fournier RO, Truesdell AH. An empirical Na–K–Ca geothermometer for natural waters. Geochim Cosmochim Acta. 1973;37(5):1255–75.
Giggenbach WF. Geothermal solute equilibria. Derivation of Na–K–Mg–Ca geoindicators. Geochim Cosmochim Acta. 1988;52:2749–65.
Giggenbach WF, Goguel RL. Collection and analysis of geothermal and volcanic water and gas discharges. 4th ed. New Zealand: Petone; 1989.
Hedenquist JW. Boiling and dilution in the shallow portion of the Waiotapu geothermal system, New Zealand. Geochim Cosmochim Acta. 1991;55:2753–65.
Held S, Schill E, Pavez M, Diaz D, Morata D, Kohl T. Tectonic control of the geothermal system at Mt. Villarrica—insights from geophysical and geochemical surveys. In: Chilean Geological Conference 2015, La Serena, Chile; 2015. Held S, Schill E, Pavez M, Diaz D, Morata D, Kohl T. Effects of major fault zones on geothermal reservoirs—a case study at
Villarrica Volcano, southern Chile. In: Proceeding European Geothermal Congress 2016, Strasbourg; 2016a. Held S, Schill E, Pavez M, Díaz D, Muñoz G, Morata D, Kohl T. Resistivity distribution from mid-crustal conductor to
near-surface across the 1200 km long Liquiñe-Ofqui Fault System, southern Chile. Geophys J Int. 2016;207(3):1387–400. Kharaka YK, Mariner RH. Chemical geothermometers and their application to formation waters from sedimentary basins.
In: Naeser N, McCulloh TH, editors. Thermal history of sedimentary basins. New York: Springer; 1989.
Meller C, Bremer J, Ankit K, Baur S, Bergfeldt T, et al. Integrated research as key to the development of a sustainable geo-thermal energy technology. Energy Technol. 2016;5:1–44.
Michard G. Behaviour of major elements and some trace elements (Li, Rb, Cs, Sr, Fe, Mn, W, F) in deep hot waters from granitic areas. Chem Geol. 1990;89(1–2):117–34.
Mutlu H. Chemical geothermometry and fluid–mineral equilibria for the Ömer-Gecek thermal waters, Afyon area, Turkey. J Volcanol Geotherm Res. 1998;80:303–21.
Nieva D, Nieva R. Developments in geothermal energy in Mexico—part twelve. A cationic geothermometer for pros-pecting of geothermal resources. Heat Recovery Syst CHP. 1987;7(3):243–58.
Nitschke F, Held S, Mundhenk N, et al. Reactivity of chilean reservoir rocks and the use of geochemical tools for reservoir characterization. In: Proceedings European Geothermal Workshop. European Geothermal Workshop, Strasbourg, France, 19–20 October. 2015.
Nitschke F, Held S, Villalon I, Mundhenk N, Kohl T, Neumann T. Geochemical reservoir exploration and temperature determination at the Mt. Villarrica geothermal system, Chile. In: Proceeding European Geothermal Congress 2016. European Geothermal Congress 2016, Strasbourg, France. September 19–24. 2016.
Palmer CD, Ohly SR, Smith RW, Neupane G, McLing T, Mattson E. Mineral selection for multicomponent equilibrium geothermometry. GRC Trans. 2014;38:453–9.
Parkhurst DL, Appelo CA. Description of input for PHREEQC version 3—a computer program for speciation, batch-reac-tion, one-dimensional transport, and inverse geochemical calculations. 2013.
Peiffer L, Wanner C, Spycher N, Sonnenthal EL, Kennedy BM, Iovenitti J. Optimized multicomponent vs. classical geother-mometry: insights from modeling studies at the Dixie Valley geothermal area. Geothermics. 2014;51:154–69. Pepin J, Person M, Phillips F, Kelley S, Timmons S, Owens L, Witcher J, Gable C. Deep fluid circulation within crystalline
basement rocks and the role of hydrologic windows in the formation of the truth or consequences, New Mexico low-temperature geothermal system. Geofluids. 2015;15(1–2):139–60.
Pérez Y. Fuentes de Aguas Termales de la Cordillera Andina del Centro - Sur de Chile (39 - 42ºS). Servicio Nacional de Geología y Minería, Boletín. vol 54; 1999. p 65.
Reed M, Spycher N. Calculation of pH and mineral equilibria in hydrothermal waters with application to geothermometry and studies of boiling and dilution. Geochim Cosmochim Acta. 1984;48(7):1479–92.
Sánchez P, Pérez-Flores P, Arancibia G, Cembrano J, Reich M. Crustal deformation effects on the chemical evolution of geothermal systems: the intra-arc Liquiñe-Ofqui fault system, Southern Andes. Int Geol Rev. 2013;55(11):1384–400. Sanjuan B, Millot R, Ásmundsson R, Brach M, Giroud N. Use of two new Na/Li geothermometric relationships for
geother-mal fluids in volcanic environments. Chem Geol. 2014;389:60–81.
Santoyo E, Díaz-González L. A new improved proposal of the Na/K geothermometer to estimate deep equilibrium temperatures and their uncertainties in geothermal systems. In: Proceedings World Geothermal Congress, Bali, Indonesia; 2010.
Spycher N, Peiffer L, Sonnenthal EL, Saldi G, Reed MH, Kennedy BM. Integrated multicomponent solute geothermometry. Geothermics. 2014;51:113–23.
Tassi F, Aguilera F, Darrah T, Vaselli O, Capaccioni B, Poreda RJ, Delgado Huertas A. Fluid geochemistry of hydrother-mal systems in the Arica-Parinacota, Tarapacá and Antofagasta regions (northern Chile). J Volcanol Geoth Res. 2010;192(1–2):1–15.
Tonani F. Some Remarks on the Application of Geochemical Techniques in geothermal exploration. In: Strub AS, Ungemach P, editors. Advances in European geothermal research. Proceedings of the second international seminar on the results of EC geothermal energy research, held in Strasbourg, 4–6 March 1980, Strasbourg; 1980.
![Fig. 4 Distribution of temperatures calculated for the Villarrica springs and the laboratory batch experiments mometers (etry ([TON tonalite experiment (180 days), AND andesite experiment (180 days)] using classical solute geother-light grey) compared to t](https://thumb-us.123doks.com/thumbv2/123dok_us/9578887.1940727/9.595.121.478.477.638/distribution-temperatures-calculated-villarrica-laboratory-experiments-experiment-experiment.webp)