DOI: 10.5958/2230-732X.2017.00092.4 ©2017 New Delhi Publishers. All rights reserved
AGRICULTURE ENGINEERING
Effect of Slice Thickness on Drying Kinetics of Papaya using
Food Dehydrator
Naga Hari Sairam, N
1, Naveen Kumar, M
2*, Edukondalu, L
1and Yashwanth Kumar, G
1 1Acharya NG Ranga Agricultural University, College of Agricultural Engineering, Bapatala, Andhra Pradesh, India2Central Institute of Agricultural Engineering, Bhopal, Madhya Pradesh, India
*Corresponding author: [email protected] (ORCID ID: 0000-0003-0251-6556)
Paper No.: 637 Received: 10-07-2017 Accepted: 26-11-2017
ABSTRACT
In this study, the influence of drying air temperature and slice thickness on drying kinetics has been reported. Papaya was sliced into the different thickness of 3, 5 and 7 mm and drying experiments were performed in the food dehydrator (Ezidri Ultra Fd1000, Hydra flow Industries Limited, Newzealand) at temperatures of 45, 55 and 65 oC. The experimental moisture loss data were fitted to the seven thin layer drying models. Three statistical parameters Coefficient of determination (R2), reduced-χ2 and root mean
square error (RMSE) was used to test the mathematical models. All the models gave the best fitting results, but the Page Model shows lower RMSE (0.006), reduced- χ2 (0.314x10⁻⁴) and highest R2 (1.000) value. The
effective diffusivity of slices varied from 7.47751×10-09 to 5.71×10-08, effective diffusivity increased with
increasing temperature and slice thickness. The activation energy of slices varied from 17.323 kJ/mol to 35.100 kJ/mol it is also increased with increasing thickness.
Highlights
mAmong the entire thin layer drying models Page Model explains good relationship between drying time and moisture content.
mThe effective diffusivity increased with increasing temperature as well as thickness also.
mThe activation energy of slice also increased with increasing thickness. Keywords: Drying, papaya, modelling, drying kinetics, temperature
Papaya (Carica papaya L.) is a common fruit to be found in tropical countries. It is a succulent fruit of
the family Caricaceae. It is grown in both tropical and subtropical areas. India is the leading papaya producer with a world share of 43.7%, followed by Brazil (11.8%) (NHB data base 2015). The total production of papaya in India during 2013-2014 was 5639300 Mt, out of which Andhra Pradesh contributes 27.4% and Gujarat 21.0% (NHB database 2015). India exports 9922 MT of papaya during 2013-2014, majorly to United Arab Emirates (37.8%) and Saudi Arabia (21.8%) (NHB database 2015).
Papaya is a rich source of antioxidant nutrients, bioflavonoids, minerals, digestive enzyme, and
fibers. Papaya is perishable product because of its high moisture content around 80-85%
(Ocoro-Zamora et al. 2013). The shelf-life of papaya can be increased by drying in the form of cubes, chips, etc. Drying is the most common method for food preservation due to significant reduction of water activity, physical and chemical changes occurring during storage and microbial activity.
in the transportation cost and storage cost (Saini, 2015; Kothakota et al. 2014).
Most of the authors has been worked on drying of papaya in different drying equipment, refractive window drying (Ocoro-Zamora et al. 2013), microwave vacuum dryer (Cheenkachorn et al.
2012), convective tray dryer (Kurozawa et al. 2012), Osmatic drying (El-Aouar et al. 2003), pre-treated and dried in fixed-bed- (Nagle, et al. 2010), cabinet- (Precoppe, et al. 2011), solar tunnel- (Janjai, et al.
2009) and solar greenhouse dryers (Janjai, et al.
2009b). No work has been carried out on drying of papaya in a food dehydrator so the objective of the present study was to determine the effect of slice thickness on the dying kinetics of papaya slices using a food dehydrator, to select suitable drying models for describing the drying process of papaya slices, and to the effect of slice thickness on the effective moisture diffusivity and activation energy.
MATERIALS AND METHODS
Preparation of material
Fresh papayas were collected from local market Bapatla, Guntur district, Andhra Pradesh, India. They were washed thoroughly with cold water. The outer skin of cleaned ripen papayas was peeled manually by using a peeler in a hygienic environment. Peeled papayas were sliced into 3 mm, 5 mm and 7 mm thickness.
Food dehydrator
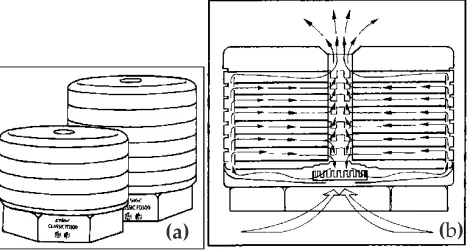
Food dehydrator (Ezidri Ultra Fd1000, Hydra flow Industries Limited, Newzealand) it is used for drying of fruits and fruit rolls, vegetables, herbs, flowers and meats. It consists of 5 trays with one mesh and one solid sheet (Fig. 1).
(a) (b)
Fig 1: (a) Dryer used in the experiment (b) Air flow pattern in dryer
Mesh sheet is used to dry solid materials, fruits, vegetables, flowers and herbs. Solid sheet is used for drying of fruit juices and soups. The number of trays can extend up to 30 and it is designed for 15 kg. Temperature control is by manual ranging from 35-65 °C, the diameter of tray is 390 mm, power consumption is 1000 W. The air flow pattern in the dryer was shown in Fig. 1, air is flow over the food material from the sides to the centre of the dryer.
Drying procedure
Papaya slices were dried in the food dehydrator (Ezidri Ultra Fd 1000, Hydra flow Industries Limited, Newzealand). Initial moisture content of papaya slices was measured by oven drying method
(AOAC 1995; Saini 2015). Drying was carried out at three different temperatures of 45, 55 and 65 °C. The weight of sample in trays was recorded at every 30 min interval using digital balance 0.001 g precision.
Drying was continued until the moisture content of papaya was reached to 13±2%. All experiments were replicated and the average values of data were reported.
Mathematical modelling
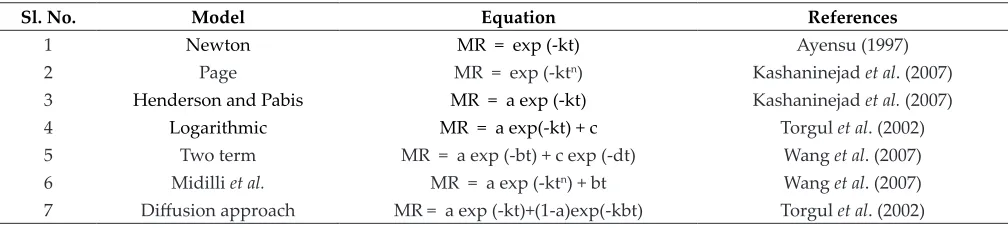
The drying curves were fitted with seven different thin-layer drying models (Table 1). Coefficient of determination (R2), reduced chi-square (χ2) and root mean square error (RMSE) were used to evaluate the goodness fit of the models. The highest values of R2, lowest values of χ2 and RMSE were preferred for goodness of fit. These parameters were calculated using Eqn. (2) and (4) as below. In thin-layer drying, the moisture ratio during drying was calculated using Eqn. (1)
o
M M MR
M M
Θ
Θ − =
− …(1)
Where MR is the dimensionless moisture ratio, M the moisture content (% d.b) at time t, and Mo and
Me are the initial and equilibrium moisture contents respectively, on dry basis. The experimental drying data at three different temperatures were fitted
using seven thin layer drying models as listed in
(
)
2exp, ,
2 1
n i pre i
i
MR MR
N z
χ = = −
−
∑
…(2)Reduced chi-square (χ2) =
2
.
D F χ
…(3)
(
)
2 1/ 2pre, exp,
1
1 n
n n
i
RMSE MR MR
N =
= −
∑
…(4)Where, MRexp,i is the ith experimentally observed
moisture ratio, MRpre,i is the ith predicted moisture
ratio, N is the number of observations and Z is the number of constants in models.
Calculation of Effective diffusivity
Fick’s second law of diffusion equation was used to analyse the drying data in the falling rate period. Crank (1975) developed solution to this equation, and the form of Eqn. (5) can be applicable for slab geometry by assuming uniform initial moisture distribution, constant diffusivity and negligible shrinkage.
(
)
(
)
2 2
2 0 2 2
2 1 8 1 exp 4 2 1 eff n
n D t
MR L n π π ∞ = − + = +
∑
…(5)Where, Deff is the effective diffusivity (m2/s), L is the half thickness of the slab in samples (m), and n is positive integer. Eqn. (5) could be further simplified
to a straight line equation as,
( )
22 2 8 1 1 4 eff D
n MR n t
L π π
= −
…(6)
Effective diffusivities are normally determined by plotting experimental drying data in terms of ln (MR) versus time. From Eqn. (6) a plot of ln (MR)
versus time gives a straight line with a slope of k2. The effective diffusivity is calculated from the slope.
2
2 4 2
eff
D k
L π
= …(7)
Calculation of activation energy
The dependence of Deff can be described by Arrhenius type of relationship (Naveen et al. 2015;
Kongdej 2011) as given by the equation.
(
a)
exp 273.15 eff o E D D R T = − +
…(8)
where Do is the pre-exponential factor of Arrhenius equation (m2/s), E
a is the activation energy (kJ/mol),
T is the temperature of drying air (°C) and R is the gas constant (kJ/mol K). The activation energy (Ea) was calculated from the slope of the plot on ln (Deff) versus 1/(T + 273.15).
RESULTS AND DISCUSSION
Effect of drying temperature and slice thickness on drying rate
Effect of drying temperature on the drying rate at different thickness of the sample was shown in Fig 2. The rate of moisture loss was more at 65 °C drying temperature as compared to the 55 °C and 45 °C. This was due to the increased energy of water molecules when the temperature was increased, as the evaporation of water molecules from the sample occurred more quickly (Kongdej 2011). The similar results were obtained with the previous work carried out on bananas (Nguyen and Price 2007), guava and papaya (Hawlader et al. 2006). There was an initial transient state at the beginning
Table 1: Empirical thin layer-drying models applied to the drying curves
Sl. No. Model Equation References
1 Newton MR = exp (-kt) Ayensu (1997)
2 Page MR = exp (-ktn) Kashaninejad et al. (2007)
3 Henderson and Pabis MR = a exp (-kt) Kashaninejad et al. (2007) 4 Logarithmic MR = a exp(-kt) + c Torgul et al. (2002)
5 Two term MR = a exp (-bt) + c exp (-dt) Wang et al. (2007)
6 Midilli et al. MR = a exp (-ktn) + bt Wang et al. (2007)
of the drying process, where fresh papaya slices at ambient needed some time to reach the set drying temperature before drying started and then drying rate increased. There was only the falling-rate period and no constant rate period was observed during the drying process. The frequency of falling-rate period proved that diffusion had pre-dominantly governed the moisture movement in the samples (Bakshi and Singh 1980). This observation was in agreement with previous work on bananas (Nguyen and Price 2007), guava and papaya (Hawlader et al. 2006). It was also observed that the drying rate decreased continuously with decreasing moisture content or increasing drying time. This was due to
the migration of moisture to the surface and the
evaporation rate from surface to air slowed down with decreasing the moisture in the product. Effect of slice thickness on the drying rate at different drying temperatures was shown in Fig 3. It shows that drying time increased with increasing thickness of papaya slices. The greater sample thickness required a longer drying time due to the increased distance travelled by moisture to the surface (Kongdej 2011). The 3 mm slice thickness had more drying rate when compared to 5 mm and
7 mm thickness with gradual falling rate period. This was due to low evaporation rate of moisture
transfer from the surface to heated air and the reduced distance for the moisture travels in thinly
slices (Siok et al. 2013). The drying times recorded at different drying temperatures for different thickness samples were shown in Table 2.
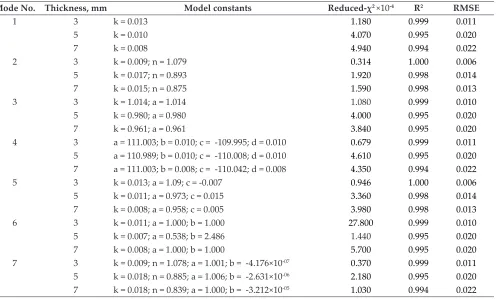
Evaluation of Mathematical models
Thin layer drying models namely, Newton, Page, Henderson and Pabis, Logarithmic, Two term, Midilli et al. and Diffusion approach was fitted to the experimental drying data (Table 1). The
mathematical model constants and statistical
parameters (R2, RMSE and reduced-χ2) for different thickness of papaya slices dried at different temperatures were shown Table 3-5. The statistical results reported that all the drying models gave the best relation between MR and drying time.
The maximum R2 (1.00) value, minimum RMSE (0.006) value and minimum value of reduced-χ2(0.314×10⁻⁴)
were found in Page model. For all models the R2 value was more than the 0.994, which indicates that all the drying models could satisfactorily describe the air drying of different thickness of papaya slices.
Fig. 2: Effect of drying temperature on drying rate of papaya slices at constant thickness (a) 3 mm, (b) 5 mm and (c) 7 mm
Table 2: Effect of drying temperature and thickness of papaya on drying time
Temperature, °C Average drying time, minutes Thickness, mm
3 mm 5 mm 7 mm
45 630 690 780
55 510 600 660
65 420 480 540
Effect of drying temperature and slice thickness on diffusivity
The effective diffusivity of papaya slices at different drying temperatures was calculated by plotting graph between ln MR and time, it is illustrated in Fig. 4. The effective diffusivity of different thickness of papaya at different temperatures was illustrated in Table 6. It can be observed that the effective diffusivity increased with increasing drying temperature and slice thickness. This similar results were reported for pumpkin slices (Kongdej 2011), tender pal shoots (Naveen et al. 2015), and carrot (Doymaz 2004).
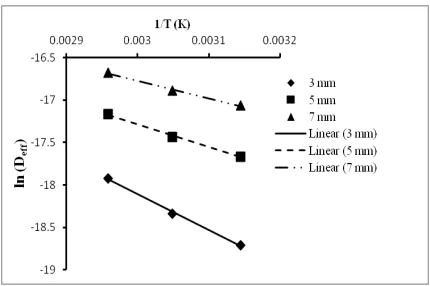
Effect of slice thickness on activation energy
The activation energy of different thickness of papaya samples were obtained from the slope of the plot between ln (Deff) versus 1/(T + 273.15), it is shown in Fig. 5. The activation energy of papaya slices was 17.323 kJ/mol (3 mm), 22.160 kJ/mol (5 mm) and 35.100 kJ/mol (7 mm). It is obvious that the activation energy values increased with increasing slice thickness, showing the sensitivity of Deff values
to the slice thickness. Similar results are reported for pumpkin slices (Kongdej, 2011).
CONCLUSION
Drying kinetics of papaya slices were investigated in a food dehydrator at different drying temperatures 45 °C, 55 °C and 65 °C. Drying of papaya slices in the falling rate period like most food products. All the mathematical models gave the best relationship between moisture ratio and drying time. The Page model gave higher R2 and lower RMSE and reduced-χ2 values among all models. The value of
effective diffusivity ranges from 7.47751×10-09 to 5.71×10-08. The effective diffusivity increased with
Fig. 4: Plot between ln (MR) versus drying time at different drying temperatures (a) 45 °C, (b) 55 °C and (c) 65 °C
Table 3: Results of statistical analyses on the modelling of the moisture content and drying time at 45 °C drying temperature
Model No. Thickness mm Model constants Reduced-χ2 ×10⁻⁴ R2 RMSE
1 3 k = 0.012 3.940 0.995 0.020
5 k = 0.009 1.370 0.998 0.012
7 k = 0.007 2.700 0.997 0.016
2 3 k = 0.016; n = 0.937 3.530 0.996 0.019
5 k = 0.011; n = 0.962 1.160 0.999 0.011
7 k = 0.011; n = 0.911 1.060 0.999 0.010
3 3 k = 0.996; a = 0.996 4.170 0.995 0.020
5 k = 0.997; a = 0.997 1.440 0.998 0.012
7 k = 0.978; a = 0.978 2.450 0.997 0.016
4 3 a = 110.978; b = 0.012; c = -109.820; d = 0.012 4.770 0.995 0.020
5 a = 111.005; b = 0.009; c = -110.008; d = 0.009 1.620 0.998 0.012 7 a = 111.023; b = 0.007; c = -110.045; d = 0.007 2.720 0.997 0.016
5 3 k = 0.013; a = 0.985; c = 0.021 2.110 0.996 0.019
5 k = 0.010; a = 0.992; c = 0.010 1.010 0.999 0.011
7 k = 0.007; a = 0.974; c = 0.010 2.230 0.999 0.010
6 3 k = 0.003; a = 0.092; b = 4.301 1.540 0.995 0.020
5 k = 0.009; a = 0.640; b = 0.998 1.530 0.998 0.012
7 k = 0.007; a = 1.000; b = 1.000 3.000 0.997 0.016
7 3 k = 0.014; n = 0.968; a = 1.006; b = 3.078×10-05 2.920 0.995 0.020
5 k = 0.011; n = 0.965; a = 1.007; b = 9.995×10-06 1.120 0.998 0.012
7 k = 0.013; n = 0.890; a = 1.008; b = -9.526×10-06 1.050 0.997 0.016 Table 4: Results of statistical analyses on the modelling of the moisture content and drying time at 55 °C drying
temperature
Mode No. Thickness, mm Model constants Reduced-χ2 ×10⁻⁴ R2 RMSE
1 3 k = 0.013 1.180 0.999 0.011
5 k = 0.010 4.070 0.995 0.020
7 k = 0.008 4.940 0.994 0.022
2 3 k = 0.009; n = 1.079 0.314 1.000 0.006
5 k = 0.017; n = 0.893 1.920 0.998 0.014
7 k = 0.015; n = 0.875 1.590 0.998 0.013
3 3 k = 1.014; a = 1.014 1.080 0.999 0.010
5 k = 0.980; a = 0.980 4.000 0.995 0.020
7 k = 0.961; a = 0.961 3.840 0.995 0.020
4 3 a = 111.003; b = 0.010; c = -109.995; d = 0.010 0.679 0.999 0.011
5 a = 110.989; b = 0.010; c = -110.008; d = 0.010 4.610 0.995 0.020
7 a = 111.003; b = 0.008; c = -110.042; d = 0.008 4.350 0.994 0.022
5 3 k = 0.013; a = 1.09; c = -0.007 0.946 1.000 0.006
5 k = 0.011; a = 0.973; c = 0.015 3.360 0.998 0.014
7 k = 0.008; a = 0.958; c = 0.005 3.980 0.998 0.013
6 3 k = 0.011; a = 1.000; b = 1.000 27.800 0.999 0.010
5 k = 0.007; a = 0.538; b = 2.486 1.440 0.995 0.020
7 k = 0.008; a = 1.000; b = 1.000 5.700 0.995 0.020
7 3 k = 0.009; n = 1.078; a = 1.001; b = -4.176×10-07 0.370 0.999 0.011
5 k = 0.018; n = 0.885; a = 1.006; b = -2.631×10-06 2.180 0.995 0.020
increasing drying temperature and slice thickness. Activation energy also increased with increasing slices thickness and varied from 17.323 kJ/mol to 35.100 kJ/mol.
REFERENCES
AOAC.1995. Official Methods of Analysis, 17th edition. Association of Official Analytical Chemists, Gaithersburg, MD, USA.
Ayensu, A. 1997. Dehydration of food crops using a solar dryer with convective heat flow. Solar Energy, 59: 121-126.
Bakshi, A.S. and Singh, R.P. 1980. Drying characteristics of parboiled rice. Hemisphere Publishing Company.
Cheenkachorn, K., Jintanatham, P. and Rattanaprapa, S. 2012. Drying of Papaya (Carica papaya L.) using a Microwave-vacuum Dryer. International Journal of Biological,
Biomolecular, Agricultural, Food and Biotechnological Engineering, 6(9).
Crank, J. 1975. The mathematics of diffusion (2nd ed.). Clarendon Press, Oxford, UK.
Doymaz, I. 2004. Convective air drying characteristics of thin layer carrots. Journal of Food Engineering, 61: 359–364. El-Aouar, A.A., Azoubel, P.M. and Murr, F.E.X. 2003. Drying
kinetics of fresh and osmotically pre-treated papaya (Carica papaya L.). Journal of Food Engineering, 59: 85–91. Hawlader, M.N.A., Perera C.O., Tian, M. and Yeo, K.L. 2006.
Drying of guava and papaya: impact of different drying methods. Drying Technology,24: 77–87.
Janjai, S., Lamlert, N., Intawee, P., Mahayothee, B., Bala, B.K. and Nagle, M.2009a. Experimental and simulated performance of a PV-ventilated solar greenhouse dryer for drying of peeled longan and banana. Solar Energy, 83: 1550-1565.
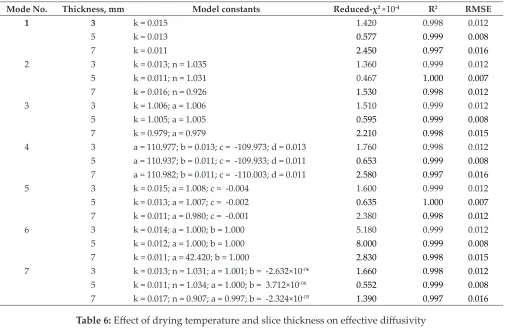
Table 5: Results of statistical analyses on the modelling of the moisture content and drying time at 65 °C drying temperature
Mode No. Thickness, mm Model constants Reduced-χ2 ×10⁻⁴ R2 RMSE
1 3 k = 0.015 1.420 0.998 0.012
5 k = 0.013 0.577 0.999 0.008
7 k = 0.011 2.450 0.997 0.016
2 3 k = 0.013; n = 1.035 1.360 0.999 0.012
5 k = 0.011; n = 1.031 0.467 1.000 0.007
7 k = 0.016; n = 0.926 1.530 0.998 0.012
3 3 k = 1.006; a = 1.006 1.510 0.999 0.012
5 k = 1.005; a = 1.005 0.595 0.999 0.008
7 k = 0.979; a = 0.979 2.210 0.998 0.015
4 3 a = 110.977; b = 0.013; c = -109.973; d = 0.013 1.760 0.998 0.012
5 a = 110.937; b = 0.011; c = -109.933; d = 0.011 0.653 0.999 0.008
7 a = 110.982; b = 0.011; c = -110.003; d = 0.011 2.580 0.997 0.016
5 3 k = 0.015; a = 1.008; c = -0.004 1.600 0.999 0.012
5 k = 0.013; a = 1.007; c = -0.002 0.635 1.000 0.007
7 k = 0.011; a = 0.980; c = -0.001 2.380 0.998 0.012
6 3 k = 0.014; a = 1.000; b = 1.000 5.180 0.999 0.012
5 k = 0.012; a = 1.000; b = 1.000 8.000 0.999 0.008
7 k = 0.011; a = 42.420; b = 1.000 2.830 0.998 0.015
7 3 k = 0.013; n = 1.031; a = 1.001; b = -2.632×10-06 1.660 0.998 0.012
5 k = 0.011; n = 1.034; a = 1.000; b = 3.712×10-06 0.552 0.999 0.008
7 k = 0.017; n = 0.907; a = 0.997; b = -2.324×10-05 1.390 0.997 0.016 Table 6: Effect of drying temperature and slice thickness on effective diffusivity
Temperature, °C Effective diffusivity, m2/s
3 mm 5 mm 7 mm
45 7.47751×10-09 2.12775×10-08 3.87×10-08
55 1.08515×10-08 2.68501×10-08 4.62×10-08
Janjai, S., Lamlert, N., Intawee, P., Mahayothee, B., Haewsungcharern, M. and Bala, B.K. 2009b. Solar drying
of peeled longan using a side loading type solar tunnel dryer: experimental and simulated performance. Drying Technology,27(4): 595-605.
Kashaninejad, M., Mortazavi, A., Safekordi, A. and Tabil, L.G. 2007. Thin-layer drying characteristics and modelling of pistachio nuts. J. Food Engineering, 78: 98-108.
Kongdej Limpaiboon. 2011. Effects of Temperature and Slice Thickness on Drying Kinetics of Pumpkin Slices. Walailak Journal, 8(2): 159-166.
Kothakota, A., Kumar, A., Kumar, M., Juvvi, P., Sankar Rao and Kautkar, S. 2014. Characteristics of spray dried dahi powder with maltodextrin as an adjunct. International Journal of Agriculture, Environment & Biotechnology, 7(4): 849-865.
Kurozawa, E.L., Hubingerb, D.M. and Parkc, J.K. 2012. Shrinkage of papaya (Carica papaya L.) during convective drying: Influence of glass transition phenomenon. 11th International Congress on Engineering and Food. Nagle, M., Azcarraga, J.C.G., Mahayothee, B.,
Haewsungcharern, M., Janjai, S. and Muller, J. 2010. Improved quality and energy performance of a fixed-bed longan dryer by thermodynamic modifications. Journal of Food Engineering,99(3): 392-399.
Naveen Kumar, M., Edukondalu, L., SaiSupraja, Ch., Jyothi, B. and Maheendra Reddy, J. 2015. Mathematical Modelling of the Thin Layer Drying of Tender Palm Shoots (Borassus
flabellifer L.). Intl. J. Food. Ferment. Technol., 5(2): 237-246.
Nguyen M.H. and Price, W.E. 2007. Air drying of banana: infuence of experimental parameters, slab thickness, banana maturity and harvesting season. Journal of Food Engineering, 79: 200–207.
Precoppe, M.F., Nagle, M., Janjai, S., Mahayothee, B. and Muller, J. 2011. Analysis of dryer performance for the improvement of small-scale litchi processing. International Journal of Food Science and Technology,46(3): 561-569. Saini, C.S. 2015. Mass Transfer Kinetics during Osmotic
Dehydration of Pineapple Samples Coated with Pectin. International Journal of Agriculture, Environment and Biotechnology,8(2): 467-476.
Siok Peng Kek., Nyuk Ling Chin. And Yus Aniza Yusof. 2013. Simultaneous time-temperature-thickness superposition theoretical and statistical modelling of convective drying of guava. Journal of Food Science Technology, 51(12): 3609–3622.
Togrul, I.T. and Pehlivan, D. 2002. Mathematical modelling of solar drying of apricots in thin layers. Journal of Food Engineering, 55: 209–216.