Response Surface Optimization of Extraction Parameters of
Green Tea
K.B. Sankalpa
*and Santhi Mary Mathew
Department of Food and Agricultural Process Engineering, Kelappaji College of Agriculture Engineering and Technology, Kerala Agricultural University, Tavanur, Kerala, India
*Corresponding author: [email protected]
Paper No. 569 Received: 18-9-2016 Accepted: 5-3-2017
ABSTRACT
Green tea is one of the most popular beverage in the world. Green tea (Camellia sinensis ) is a rich source of bioactive components so it has been used in traditional medicine. In the present study, green tea is extracted with water to obtain maximum nutritional quality and antioxidant activity. The optimal conditions for extraction of green tea was determined by Response Surface Methodology (RSM).
Box-Behnken design was applied to evaluate the effects of three independent factors, leaf to water ratio (1:10, 1:30 1:50), temperature (40 to 50°C) and extraction time (15 to 45 min). Optimal conditions were, extraction temperature of 51.44°C, time 29.48 min and water to solid ratio of 1:47.80 with highest total polyphenols, total flavonoid, caffeine, antioxidant activity and lowest tannin.
Highlights
• Study gives optimum conditions for extraction functional components
• Green tea is good source of flavonoids and polyphenols
• Study shows that medicinal value of green tea is due to its exhalent antioxidant capacity Keywords: Green tea, antioxidant activity, flavonoids, caffeine, total phenols
Tea is the second most popular drink in the
world after water. Tea can be classified into three major categories: unfermented green tea, partially
fermented oolong tea, and fermented black tea (Yu
el al., 2014). Green tea contains more catechins,
than black tea or oolong tea. So it is included in the
group of beverages with functional properties (Sinija and Mishra 2008). Green tea is steamed and heated immidiatly after harvesting to stop the enzymatic
activity in order to retain the majority of catechin
and flavonoids (Ozturk el al., 2016).
Green tea is getting popular recently due to
increasing awareness of its health benefits. Studies indicate a wide variety of health benefits, its regular
consumption reduced risk of cardiovascular disease
and certain types of cancer, in- flammatory bowel,
liver and neurodegenerative diseases, diabetes,
and even weight loss. These health benefits are
attributed to its high content of catechins which have
been described as potent antioxidants ameliorating disease states related to reactive oxygen species
(Carloni el al., 2013).
Green tea beverage is made be infusing the green tea leaves in hot water, quality of tea infusion is influenced by presence of polyphenols, amino acids, saccharides, flavonoids and caffeine. The water extraction method is excellent because of its
high yield rate, low cost and safety (Danrong el
al., 2009) hence water is selected as the extraction
media in our study. The present study is aimed at
the optimization process parameters for extraction
of functional components from green tea.
International Journal of Agriculture, Environment and Biotechnology
Citation: IJAEB: 10(2): 209-216, April 2017
DOI: 10.5958/2230-732X.2017.00024.9
©2017New Delhi Publishers. All rights reserved
MATERIALS AND METHODS
Materials
Green tea was purchased from Kanan Devan
Hills Plantations Company (P) Ltd. Kerala, India. Standards of caffeine, catechin and 2, 4 ,6- tripyridyl- s- triazine was purchased from Sigma Aldrich. All
other chemicals used were of analytical grade. Green tea leaves were weighed accurately and
extracted with water in three different temperature,
time and water ratio. Extract was analysed for total
polyphenols, total flavonoids, caffeine, tannins and
antioxidant activity.
Total polyphenols
Total phenolics were determined colorimetrically
using Folin-Ciocalteau reagent and concentrations
are expressed as gram of gallic acid equivalents per
one g of dry weight (Hajimahmoodi et al., 2008).
Total flavonoids
Total flvonoid content was measured by the aluminum chloride colorimetric assay. Total
flavonoid content was expressed as mg catechin equivalents/g dry mass (Hajimahmoodi el al., 2008).
Caffeine
Caffeine Estimation was carried out according to method described by Sinija and Mishra 2009.
Absorbance of different samples was measured
at 277 nm against pure chloroform as blank using
UV–VIS spectrophotometer.
Tannins
Estimation of tannin was performed by titrating sample with standard potassium permanganate
solution (AOAC, 1980).
Antioxidant activity
The FRAP (Ferric reducing antioxidant power assay) procedure was used to estimate antioxidant activity and it is expressed in mmol Fe per gram (Yashin,
el al., 2011).
Statistical analysis
RSM was used to investigate the main effects of process variables on total polyphenols, total
flavonoids, caffeine, tannins and antioxidant activity.
The coded and uncoded independent variables used
in the RSM design were listed in Table 1.
Table 1: Uncoded and coded independent variables
used in RSM design
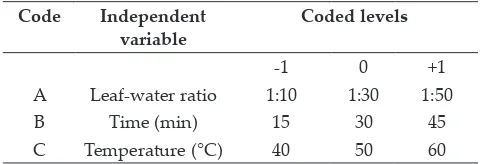
Code Independent
variable Coded levels
-1 0 +1
A Leaf-water ratio 1:10 1:30 1:50
B Time (min) 15 30 45
C Temperature (°C) 40 50 60
A 17-run Box–Behnken design with three factors and three levels, including five replicates at the centre
point, experimental points used according to this
design are shown in Table 2. Statistical analysis was done with the aid of the Design-Expert software version 7.0.0.
RESULTS AND DISCUSSION
Results of different runs of extraction were shown in Table 2. Regression equation coefficients of the
proposed models and statistical significance of
all main effects calculated for each response were obtained and effects being not significant (p > 0.05)
were stepped down from models without damaging
the model hierarchy. ANOVA showed that the lack of fit was not significant for total flavonoids and significant for other response.
Total polyphenols
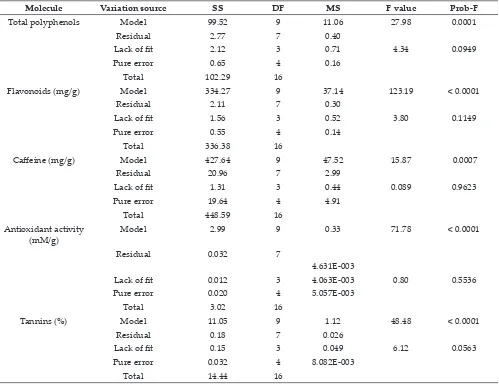
The experimental data for extractable total
polyphenols is given in table 2. The effects of
material to water ratio, extraction time and temperature on extractable polyhenols, as well
as their interactions, are shown in Fig. 1. Total polyphenols was ranges from 3.87 to 12.56 mg/g and maximum polyphenols was extracted 1:30, 30 min and 60°C. Total polyphenols increased significantly with increase in water ratio, while the
total polyphenols extraction reached a maximum when extraction time was up to a certain value,
without significant further improvement thereafter (Fig. 1). Increasing temperature tended to reduce
the total amount of catechins which are main component of tea polyphenols, it was concluded that oxidation occurred during heating besides the
color to be darker and less green (Ananingsih el al., 2013). Similar result was observed by Hilal and Engelhardt 2007 for green tea (13.7–24.7 g/100g)
and Hajimahmoodi el al., 2008 for Ahmad green tea.
For total polyphenols the coefficient estimates and
the corresponding P-values suggest that, among
the test variables used in the study, B (Time), C
(Temperature), A2(leaf to water ratio2), B2(Time2)
were significant model terms with P- values of
less than and 0.05. A (leaf to water ratio) (P < 0.001) had largest effect on total polyphenols. The
mathematical equation expressing relationship of total polyphenols with variables A, B and B is given
in table 3 in terms of coded factors. The p-value of the model was 0.0001 (Table 4), which indicated that the model fitness was significant. By analysis of
variance, the R2 value of this model was determined
to be 0.9730, which showed that the regression model defined well the true behavior of the system.
Total flavonoids
It arised from the results of statistical analysis
that total flavonoids extraction depended on the
extraction time, temperature and amount of water
and it ranges from 12.5 to 26.5 mg Catechin/g of green tea. Obtained value of total falvonoids is similar to
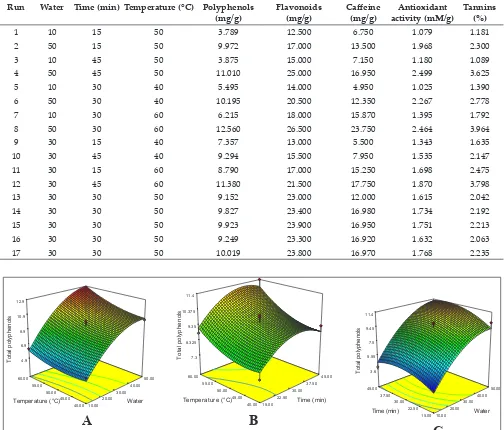
Table 2: Box-Behnkan design with independent and response variables
Run Water Time (min) Temperature (°C) Polyphenols
(mg/g) Flavonoids (mg/g) Caffeine (mg/g) activity (mM/g)Antioxidant Tannins (%)
1 10 15 50 3.789 12.500 6.750 1.079 1.181
2 50 15 50 9.972 17.000 13.500 1.968 2.300
3 10 45 50 3.875 15.000 7.150 1.180 1.089
4 50 45 50 11.010 25.000 16.950 2.499 3.625
5 10 30 40 5.495 14.000 4.950 1.025 1.390
6 50 30 40 10.195 20.500 12.350 2.267 2.778
7 10 30 60 6.215 18.000 15.870 1.395 1.792
8 50 30 60 12.560 26.500 23.750 2.464 3.964
9 30 15 40 7.357 13.000 5.500 1.343 1.635
10 30 45 40 9.294 15.500 7.950 1.535 2.147
11 30 15 60 8.790 17.000 15.250 1.698 2.475
12 30 45 60 11.380 21.500 17.750 1.870 3.798
13 30 30 50 9.152 23.000 12.000 1.615 2.042
14 30 30 50 9.827 23.400 16.980 1.734 2.192
15 30 30 50 9.923 23.900 16.950 1.751 2.213
16 30 30 50 9.249 23.300 16.920 1.632 2.063
17 30 30 50 10.019 23.800 16.970 1.768 2.235
10.00 20.00
30.00 40.00
50.00
40.00 45.00 50.00 55.00 60.00
4.9 6.9 8.9 10.9 12.9
T
ot
al
p
ol
yp
he
no
ls
Water
Temperature (°C) 15.00 22.50
30.00 37.50
45.00
40.00 45.00 50.00 55.00 60.00
7.3 8.325 9.35 10.375 11.4
T
ot
al
po
lyph
en
ol
s
Time (min) Temperature (°C)
10.00 20.00
30.00 40.00
50.00
15.00 22.50 30.00 37.50 45.00
3.6 5.55 7.5 9.45 11.4
T
otal
po
lyph
en
ol
s
Water Time (min)
A
B
C
findings of Hajimahmoodi el al., (2008) who reported total flavonoids of 22.752 mg Catechin/g Chinas
green tea. Total flavonoids extraction increases with increase in time, temperature and amount of water and it is maximum at when extraction time is
30 min, temperature is 60°C and water is 50 times
and further increase in extraction time gave slight
or no increase in total flavonoids (Fig. 2). This was
explained by Labbe el al., 2006, EGC and EC which
are time dependent components and solubilisation
of these components increased rapidly between 0 and 20 min and after stabilized, and whatever the
brewing temperature, this study reported extraction
of green tea catechins was maximum at 50°C for 20-40min. Similar trend was observed by Vuong el al., (2011) for extraction of green tea catechins
Table 3: RSM models and coefficient of determination (R2) values
Molecule RSM model R2
Total
polyphenols = 9.63 + 3.05(A) + 0.71(B) + 0.83(C) + 0.24(A*B) + 0.41(A*C) + 0.16(B*C) -1.53(A
2) – 0.94(B2) +0.51(C2)
0.9730
Total
flavonoids = 23.48 + 3.69(A) + 2.19(B) + 2.50(C) + 1.37(A*B) + 0.50 (A*C) + 0.5(B*C) - 1.55(A
2) -4.55(B2) - 2.18(C2) 0.9937
Caffeine = 15.96 + 3.98(A) + 1.10(B) + 5.23 (C) + 0.76(A*B) + 0.12(A*C) + 0.012(B*C) - 1.13(A2) -3.75(B2) - 0.60(C2) 0.9533 Antioxidant
activity = 1.70 + 0.56(A) + 0.12(B) + 0.16(C) + 0.11(A*B) - 0.043(A*C) – 5.175E-003(B*C) + 0.079(A
2) - 0.098(B2)
+ 9.050E-003(C2) 0.9893
Tannins = 2.15 + 0.90(A) + 0.38(B) + 0.51(C) + 0.35(A*B) + 0.20(A*C) + 0.20(B*C) - 0.067(A2) - 0.034(B2) + 0.40 (C2) 0.9842
Table 4: ANOVA of RSM models
Molecule Variation source SS DF MS F value Prob-F
Total polyphenols Model 99.52 9 11.06 27.98 0.0001
Residual 2.77 7 0.40
Lack of fit 2.12 3 0.71 4.34 0.0949
Pure error 0.65 4 0.16
Total 102.29 16
Flavonoids (mg/g) Model 334.27 9 37.14 123.19 < 0.0001
Residual 2.11 7 0.30
Lack of fit 1.56 3 0.52 3.80 0.1149
Pure error 0.55 4 0.14
Total 336.38 16
Caffeine (mg/g) Model 427.64 9 47.52 15.87 0.0007
Residual 20.96 7 2.99
Lack of fit 1.31 3 0.44 0.089 0.9623
Pure error 19.64 4 4.91
Total 448.59 16
Antioxidant activity
(mM/g) Model 2.99 9 0.33 71.78 < 0.0001
Residual 0.032 7
4.631E-003
Lack of fit 0.012 3 4.063E-003 0.80 0.5536
Pure error 0.020 4 5.057E-003
Total 3.02 16
Tannins (%) Model 11.05 9 1.12 48.48 < 0.0001
Residual 0.18 7 0.026
Lack of fit 0.15 3 0.049 6.12 0.0563
Pure error 0.032 4 8.082E-003
(water-to-tea ratio of 20:1 time 30 min).
The magnitude of p-value indicates that all linear
terms (A, B, C), quadratic terms B2 and C2 were
highly significant 1 per cent level (p < 0.0001), interaction term A*B quadratic terms A2 were
significant 5 percent level (p < 0.05). But interaction term B*C and A*C had not significant at 5 percent level (p > 005). The p-value (Table 4), of the model was <0.0001. The best fit model was expressed by the coefficient of determination R2, which was0.9937
(Table 3), indicating that 99.37 per cent of the
variability of the response could be explained by the model. The quadratic model for total polyphenols in terms of coded levels of the variables is given
in Table 3.
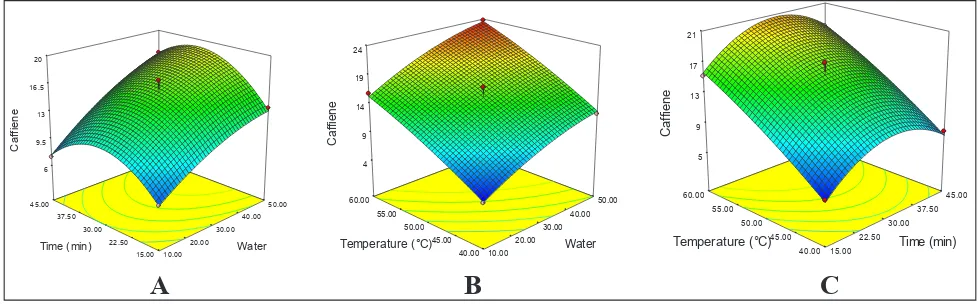
Caffeine
Caffeine content of extract ranged from 4.95 to 23.75 mg/g. With the increase in leaf to water ratio
and temperature there is significant increase in
concentration caffeine (Fig. 3). According to the
report of Ziaedini el al., 2010, temperature has a
positive effect on extraction efficiencies and rates when it is not too high and they reported caffeine extraction was maximum at 20-40 min. Highest caffeine was extracted in 1:50 leaf-water ratio at 60 °C for extraction time of 30 min. Similar trend was observed by Labbe el al., (2006) for extraction green tea caffeine and they reported caffeine solubilisation
increased with a rise in brewing temperature and increased in a moderate manner with infusion
duration and reported best condition as 70–80°C and 20–40 min.
For caffeine the coefficient estimates and the corresponding P-values suggest that, among the test variables used in the study, A (leaf to water ratio)
and B2 (Time2), were significant model terms with
P- values of less than and 0.05 and C (Temperature)
10.00 20.00 30.00 40.00 50.00 15.00 22.50 30.00 37.50 45.00 12 15.75 19.5 23.25 27 T ot al fl av ono id s Water Time (min) 10.00 20.00 30.00 40.00 50.00 40.00 45.00 50.00 55.00 60.00 14 17.25 20.5 23.75 27 T ot al fl av on oi ds Water
Temperature (°C) 15.00
22.50 30.00 37.50 45.00 40.00 45.00 50.00 55.00 60.00 12 15.25 18.5 21.75 25 T ota l fl av onoi ds Time (min) Temperature (°C)
B
A
C
Fig. 2: Response surface plots showing effect of independent parameter on total flavonoids
10.00 20.00 30.00 40.00 50.00 15.00 22.50 30.00 37.50 45.00 6 9.5 13 16.5 20 C af fie ne Water
Time (min) 10.00 20.00
30.00 40.00 50.00 40.00 45.00 50.00 55.00 60.00 4 9 14 19 24 C af fien e Water
Temperature (°C) 15.00 22.50
30.00 37.50 45.00 40.00 45.00 50.00 55.00 60.00 5 9 13 17 21 C af fien e Time (min) Temperature (°C)
B
A
C
was highly significant model terms with P- values of less than and 0.0001. The mathematical equation expressing relationship of caffeine with variables A, B and B is given in Table 3 in terms of coded factors. The p-value of the model was 0.0007, which indicated that the model fitness was significant. By
analysis of variance, the R2 value of this model was
determined to be 0.9533, which showed that the regression model defined well the true behaviour
of the system.
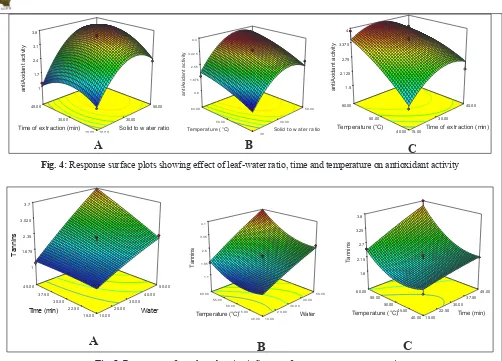
Antioxidant activity
Antioxidant activity of tea extracted in different condition was ranged from 1.025-2.464 mM/g.
Antioxidant activity of tea extract increase with increment in all three parameters, highest value
(2.464 mM/g) was recorded in 1:50 leaf-water ratio, 30 min of infusion time at 60°C. High catechin levels
have been positively correlated with tea radical
scavenging properties (Tenore el al., 2015) that
might be the reason for high antioxidant activity
at high temperature and time. Similar value of antioxidant value of green tea is reported in other
studies Yashin el al., 2011, Hajimahmoodi el al.,
2008 and Gimenez el al., 2013. Response surface
generated for antioxidant activity as the function of
two independent variables given in Fig 4. All linear coefficients (A, B and C), two quadratic coefficients
(A2 and B2) and interaction factor of water and time
had significant effect on antioxidant activity and among the six significant terms leaf-water ratio was highly significant with p value less than 0.0001. The
mathematical model representing the antioxidant activity of green tea extract as a function of the independent variables within the region under
investigation was expressed in equation (Table 3). The value of the determination coefficient for the
equation for tea antioxidant activity is R2 0.9893,
which indicates that only 2% of the total variation
is not explained by the model. The p-value of the
model was less than 0.0001, which indicated that the model fitness was significant.
10.00 30.00 50.00 15.00 30.00 45.00 1 1.7 2.4 3.1 3.8 a nt iA xid an t a ct ivi ty
Solid to w ater ratio Time of extraction (min)
10.00 30.00 50.00 40.00 50.00 60.00 0.8 1.675 2.55 3.425 4.3 anti Ax idant a ct ivi ty
Solid to w ater ratio
Temperature (°C) 15.00
30.00 45.00 40.00 50.00 60.00 1.5 2.125 2.75 3.375 4 a nt iA xid an t a ct ivi ty
Time of extraction (min) Temperature (°C)
B
A
C
Fig. 4: Response surface plots showing effect of leaf-water ratio, time and temperature on antioxidant activity
C
10.00 20.00 30.00 40.00 50.00 15.00 22.50 30.00 37.50 45.00 1 1.675 2.35 3.025 3.7 T an ni ns Water Time (min) 10.00 20.00 30.00 40.00 50.00 40.00 45.00 50.00 55.00 60.00 1.1 1.85 2.6 3.35 4.1 T anni ns WaterTemperature (°C) 15.00 22.50
30.00 37.50 45.00 40.00 45.00 50.00 55.00 60.00 1.6 2.15 2.7 3.25 3.8 T ann ins Time (min) Temperature (°C)
C
B
A
Tannins
Tea tannins are soluble in water and responsible for
the typical bitter taste of tea. Extraction parameters have significant affect on tannins. Minimum tannins value (1.089%) was obtained at the lowest extraction
time, temperature and water ratio and it reached
maximum (3.964%) value at 60°C, 30min and 1:50
water ratio, similar treads is observed by Mache el
al., 2015 for Khaya tea tannins and they reported
with increment in water volume, infusion time and temperature there will be increase in tannin
extraction. Obtained values are in line with the findings of Kopjar el al., 2015 and Khasnabis el al., 2015 for commercially available green tea (2.65%).
According to literature tannin decrease feed intake,
growth rate, feed efficiency and protein digestibility.
Tannins are known to bind to dietary iron and
prevent its absorption specifically of ‘nonheme’ iron
found in plant foods (Khasnabis el al., 2015), so tea
with less tannin content is preferable. Effect of two independent factors on tannins is given in Fig. 5. ANOVA (Table 4) was performed to evaluate the
significance of the coefficients of the quadratic
polynomial models. On the basis of the regression coefficients and the p-value, it was found that the linear (B), quadratic (C2) and all interaction terms
had significant effects effect on tannin content
(p<0.005). The variable with the greatest effect is linear terms of time (A) and temperature (C) with p<0.0001.
Regression equations describing the mathematical relationships between the independent and response
variables obtained (Table 3). The p-value of the model was <0.0001, which indicated that the model fitness was significant. The model can fit well with
the actual data when R2 approaches unity. By
analysis of variance, the R2 value of this model was
determined to be 0.9842.
Optimization
Optimum conditions for extraction of green tea
components were determined to obtain the criteria; maximum total polyphenols, total flavonoid,
caffeine, antioxidant activity and minimum tannins
content. By applying desirability function method, solutions were obtained for the optimum extraction
criteria with desirability value of 0.709.
CONCLUSION
In this study, process parameter for extraction of functional components from green tea was
optimized. Optimization responses were total polyphenols, total flavonoid, caffeine, antioxidant
activity and tannins. By RSM and desirability value optimum condition for maximum functional
component in green tea extract is 1:47.80 leaf-water ratio, 29.48 min extraction time and 51.44°C
extraction temperature to obatain total polyphenols
of 11.282 mg/g, total flavonoids of 25.787 mg/g, caffiene content of 19.310 mg/g, antioxidant activity of 2.275 mM/g and tannins 2.982%.
REFERENCES
A.O.A.C. 1980. Official Methods of Analysis. Association of Analytical Chemists. Arlington, USA.
Ananingsih, V.K., Sharma, A. and Zhou W. 2013. Green tea catechins during food processing and storage: a review
on stability and detection. Food Res. Int.50: 469–479. http://
dx.doi.org/10.1016/j.foodres.2011.03.004.
Carloni, P., Tiano, L., Padella, L., Bacchetti, T., Customu, C., Kay, A. and Damiani, E. 2013. Antioxidant activity
of white, green and black tea obtained from the same tea cultivar. Food Res Int 53(2) : 900–908. http://dx.doi.
org/10.1016/j.foodres.2012.07.057.
Danrong, Z., Yuqiong, C. and Dejiang, N. 2009. Effect of water
quality on the nutritional components and antioxidant activity of green tea extracts. Food Chem., 113(1) : 110-114.
http://dx.doi.org/10.1016/j.foodchem.2008.07.033.
Gimeneza, B., Moreno, S., Lopez-Caballeroa, M.E., Monteroa, P. and Gomez-Guillen, M.C. 2013. Antioxidant properties of green tea extract incorporated to fish gelatin films after simulated gastrointestinal enzymatic digestion. LWT - Food Sci and Technol., 53(2): 445-451. http://dx.doi. org/10.1016/j.lwt.2013.03.020.
Hajimahmoodi, M., Hanifeh, M., Oveisi, M.R., Sadeghi, N. and Jannat, B. 2008. Determination of total antioxidant capacity of green teas by the ferric reducing/antioxidant
power assay. Iran J Environ Health Sci Eng., 5(3) : 167-172. http://www.issr-journals.org/links/papers. journal=ijias&application=pdf&article=IJIAS-15-094-06.
Accessed 18 January 2015.
Hilal, Y. and Engelhardt, U. 2007. Characterisation of white
tea – Comparison to green and black tea. J Consum Protect
Food Safety ,2: 414 – 421. DOI 10.1007/s00003-007-0250-3. Khasnabis, J., Rai, C. and Roy, R. 2015. Determination of
tannin content by titrimetric method from different types
of tea. J Chem Pharmaceut Res., 7(6) : 238-241. http://www.
jocpr.com/articles/determination-of-tannin-content-by-titrimetric-method-from-different-types-of-tea.pdf.
Accessed 18 January 2015.
Kopjar, M., Tadic, M. and Pilizota, V. 2015. Phenol content and
Chem Biol Techn Agr., 2(1) : 1-6. https://doi.org/10.1186/ s40538-014-0028-7.
Labbe, D., Tremblay, A. and Bazinet, L. 2006. Effect of
brewing temperature and duration on green tea catechin
solubilization: Basis for production of EGC and
EGCG-enriched fractions. Sep Purif Technol., 49(1) : 1–9. https://
doi.org/10.1016/j.seppur.2005.07.038.
Mache, A.G., Guiama, V.D. and Mbofung, C.M.F. 2015. Optimization of total polyphenols and tannins content
during extraction of Khaya tea (Khaya senegalensis): Effect
of water volume, temperature and infusion time. Int J Innov Appl Stud., 12: 659-675.
Ozturk, B., Seyhan, F., Ozdemir, I.S., Karadeniz, B., Bahar, B., Ertas, E. and Ilgaz, S. 2016. Change of enzyme activity and quality during the processing of Turkish green tea. LWT
- Food Sci Technol., 65: 318-324. https://doi.org/10.1016/j. lwt.2015.07.068.
Sinija, V.R. and Mishra, H.N. 2008. Moisture sorption
isotherms and heat of sorption of instant (soluble) green tea powder and green tea granules. J Food Eng., 86(4) :
494-500. https://doi.org/10.1016/j.jfoodeng.2007.10.026.
Tenore, G.C., Campiglia, P., Giannetti, D. and Novellino, E. 2015. Simulated gastrointestinal digestion, intestinal
permeation and plasma protein interaction of white, green, and black tea polyphenols. Food Chem., 169:
320–326. https://doi.org/10.1016/j.foodchem.2014.08.006.
Vuong, Q.V., Golding, J.B., Stathopoulos, C.E., Nguyen, M.H. and Roach, P.D. 2011. Optimizing conditions for
the extraction of catechins from green tea using hot water. J Sep Sci., 34(21): 3099-106. https://doi.org/10.1002/ jssc.201000863.
Yashin, A., Yashin, Y. and Nemzer, B. 2011. Determination
of Antioxidant Activity in Tea Extracts, and Their Total
Antioxidant Content. Am J Biomed Sci., 3(4) : 322-335.
https://doi.org/10.5099/aj110400322.
Yu, P., Soo-Lee Yeo, A., Mei-Yin Low and Zhou, W. 2014.
Identifying key non-volatile compounds in ready-to-drink
green tea and their impact on taste profile. Food Chem.,
155 : 9-16. https://doi.org/10.1016/j.foodchem.2014.01.046. Ziaedini, A., Jafari, A., Zakeri, A. Extraction of antioxidants
and caffeine from green tea (Camellia sinensis) leaves:
kinetics and modeling. Food Sci Technol Int.16(6): 505-10.
https://doi.org/10.1177/1082013210367567.