Dentists
’
practice patterns regarding
caries prevention: results from a dental
practice-based research network
Yoko Yokoyama,1,2Naoki Kakudate,3Futoshi Sumida,4Yuki Matsumoto,5 Gregg H Gilbert,6Valeria V Gordan7
To cite:Yokoyama Y,
Kakudate N, Sumida F,et al.
Dentists’practice patterns
regarding caries prevention: results from a dental practice-based research
network.BMJ Open2013;3:
e003227. doi:10.1136/ bmjopen-2013-003227
▸ Prepublication history for
this paper is available online. To view these files please visit the journal online (http://dx.doi.org/10.1136/ bmjopen-2013-003227).
Received 14 May 2013 Revised 2 August 2013 Accepted 9 August 2013
1Japan Society for the
Promotion of Science
2Department of Preventive
Medicine and Epidemiology, National Cerebral and Cardiovascular Center, Suita, Osaka, Japan
3Educational Cooperation
Center, Kyushu Dental University, Kitakyushu, Fukuoka, Japan
4Mikami Dental and
Orthodontics Clinic, Tomakomai, Hokkaido, Japan
5Matsumoto Dental Clinic,
Okazaki, Aichi, Japan
6Department of Clinical and
Community Sciences, School of Dentistry, University of Alabama at Birmingham, Birmingham, Alabama, USA
7Department of Restorative
Dental Sciences, University of Florida College of Dentistry, Gainesville, Florida, USA
Correspondence to Yoko Yokoyama; yyokoyama-kyt@umin.ac.jp
ABSTRACT
Objective:The purposes of this study were to (1) quantify dentists’practice patterns regarding caries prevention and (2) test the hypothesis that certain dentists’characteristics are associated with these practice patterns.
Design:The study used a cross-sectional study design consisting of a questionnaire survey.
Participants:The study queried dentists who worked in outpatient dental practices who were affiliated with the Dental Practice-Based Research Network Japan, which seeks to engage dentists in investigating research questions and sharing experiences and expertise (n=282).
Measurement:Dentists were asked about their practice patterns regarding caries preventive dentistry. Background data on patients, practice and dentist were also collected.
Results:38% of dentists (n=72) provided
individualised caries prevention to more than 50% of their patients. Overall, 10% of the time in daily practice was spent on caries preventive dentistry. Dentists who provided individualised caries prevention to more than 50% of their patients spent significantly more time on preventive care and less time on removable prosthetics treatment, compared to dentists who did not provide individualised caries prevention. Additionally, they provided oral hygiene instruction, patient education, fluoride recommendations, intraoral photographs taken and diet counselling to their patients significantly more often than dentists who did not provide individualised caries prevention. Multiple logistic regression analysis suggested that the percentage of patients interested in caries prevention and the percentage of patients who received hygiene instruction, were both associated with the percentage of patients who receive individualised caries prevention.
Conclusions:We identified substantial variation in dentists’practice patterns regarding preventive dentistry. Individualised caries prevention was significantly related to provision of other preventive services and to having a higher percentage of patients interested in caries prevention, but not to the dentist’s belief about the effectiveness of caries risk
assessment. (Clinicaltrials.gov registration number NCT01 680 848).
INTRODUCTION
Dental caries is a largely preventable disease,1–3 but it continues to affect 60–90% of school children and almost 100% of adults, constitut-ing the most common chronic disease among children and adolescents.4 5 Oral health is essential to general health and optimal quality of life and the high prevalence of dental caries highlights the importance of public health approaches to its prevention.5 According to Zero et al6, dental caries is a dynamic dietomicrobial disease involving cycles of demineralisation and remineralisa-tion. The early stages of this process are reversible by modifying or eliminating aetio-logical factors (such as plaque biofilm and diet) and increasing protective factors (such as fluoride exposure and salivary flow).6 Axelsson et al7 8 noted that improved self-performed oral hygiene, the daily use of fluoridated dentifrice, regularly repeated pro-fessional tooth cleanings and plaque control effectively prevented the recurrence of dental caries.7 8 Caries risk assessment is the first step in preventive treatment.9Risk assessment is the determination of the person’s
ARTICLE SUMMARY
Strengths and limitations of this study
▪ To our knowledge, this is the first study to clarify dentists’practice patterns regarding caries prevention in Japan has substantial variation in the Dental Practice-Based Research Network.
▪ This study suggested possible reasons for the variation of practice patterns regarding caries prevention.
▪ This study has relatively wide diversity of partici-pants, with respondents from all seven regions in Japan. Given the cross-sectional nature of the study, causative relationships between factors and the provision of individualised caries preven-tion were difficult to assess.
on September 22, 2020 by guest. Protected by copyright.
probability of developing new carious lesions during a specific time period and the probability of a change in the size or activity of existing lesions across time.2 10 11 Our previous studies revealed that dentists’perception of each potential caries risk factor and the administration of diet counselling varied between dentists.12 13 However, dentists’ practice patterns regarding caries prevention and factors that affect these patterns remain unclear. The recent establishment of the Dental Practice-Based Research Network Japan ( JDPBRN) created an oppor-tunity for international comparisons. JDPBRN is a consor-tium of dental practices with a broad representation of practice types, treatment philosophies and patient popu-lations and it has a shared mission with the DPBRN,14 now called the National DPBRN (http:// NationalDentalPBRN.org). The network regions of the JDPBRN represent all seven districts in Japan (Hokkaido, Tohoku, Kanto, Chubu, Kansai, Chugoku-Shikoku and Kyushu). The studies conducted in the USA and Japan shared the same purpose of clarifying practice patterns regarding caries diagnosis and treatment.
The purposes of this study were to (1) quantify dentists’ practice patterns regarding caries preventive dentistry and (2) test the hypothesis that certain dentists’characteristics are associated with these practice patterns.
MATERIALS AND METHODS Study design
We conducted a cross-sectional study consisting of a ques-tionnaire survey, which was administered in Japan between May 2011 and February 2012.12 This study followed the World Association’s Declaration of Helsinki. All participants provided written informed consent prior to participation. We used the same questionnaire that was used in the US DPBRN study ‘Assessment of Caries Diagnosis and Caries Treatment’15and the‘DPBRN Enrollment Questionnaire’. 16Four dentists and clinical epidemiologists collaboratively
translated these questionnaires into Japanese. The trans-lated version of these questionnaires is available at http:// www.dentalpbrn.org/uploadeddocs/Study%201(Japanese %20Version.pdf). (Original English version: http:// nationaldentalpbrn.org/pdf/Study%201%20questionnaire %20FINAL%20after%20pre-testing%20021306.pdf). The questionnaires used in this study were validated by expert consultation and focus groups on potential subjects.17 Dentists were asked about their practice patterns regarding caries preventive treatment. Background data on patients, practice and participating dentists were also requested.
Questionnaires were distributed, answered and returned through the method described in the previous study.12 15 18
Participants
We queried dentists working in outpatient dental prac-tices who were affiliated with JDPBRN (n=282). Participants who indicated that they perform restorative dentistry at their practice were recruited from the JDPBRN website and mailings.
Variables
Dentists’practice patterns regarding individualised caries preventive dentistry
Practice patterns regarding individualised caries preventive regimens were measured with the following question: for what per cent of patients do you administer individualised caries preventive treatment specifically for their needs?
Items used to measure practice patterns regarding time spent doing prevention-related care and percentage of patients who receive specific dental services
Practice patterns regarding time spent doing prevention-related care and the percentage of patients who received specific dental services was measured using the ques-tions listed intable 1.
Variable selection
To identify the characteristics of the dentist, patient and practice that were associated with the use of individua-lised caries prevention, theoretical models were dis-cussed and identified in accordance with previous studies.12 15 19 20In addition, explanatory variables were extracted, consisting of four categories shown intable 1.
Statistical analysis
Description and comparison of practice patterns by the use of individualised caries prevention
We examined the relationship between dental practice patterns and the use of individualised caries prevention. χ2 tests were performed to assess the association between practice patterns and the use of individualised caries prevention.
The use of individualised caries prevention was cate-gorised dichotomously: ‘less preventive’ (1–49%) and ‘more preventive’ (50–100%), according to a previous study.9To compare our data with the US data, we calcu-lated the mean percentages of patients who received indi-vidualised caries prevention according to a previous study.9
Factors affecting the decision to provide individualised caries prevention
Descriptive analysis was conducted through univariate regression analysis for explanatory variables associated with dentists’ practice patterns of individualised caries prevention. Subsequently, multiple logistic regression analysis was conducted to examine the relationship between explanatory variables and the prevalence of patients receiving individualised caries prevention. Odds ratios (ORs) and 95% confidential intervals (CIs) were calculated. All statistical analyses were performed with STATA/SE (V.10; STATA Corporation, College Station, Texas, USA). Statistical significance was set at p<0.05.
RESULTS
Demographic information of participants
Questionnaires were distributed to 282 dentists and valid responses were collected from 189 (67%). The
on September 22, 2020 by guest. Protected by copyright.
demographic characteristics of the study participants are shown intable 2.12 13The mean number of years (±SD) elapsed since graduation from dental school was 18.5±9.9 and the participants were predominantly men (n=154, 82%). With regard to practice setting, 40% (n=76) of practices were established in government ordinance-designated cities of over 700 000. The percentage of den-tists who performed caries risk assessment as a routine part of treatment planning was 26% (n=49). The percent-age of dentists who agreed that caries risk assessment is effective was 67% (n=127).
Dentists’practice patterns according to provision of individualised caries prevention
Seventy-two participants (38%) answered that 50% or more of their patients received individualised caries pre-vention (ie, were‘more preventive’). Eleven participants
(6%) answered that 100% of their patients received indi-vidualised caries prevention (figure 1).
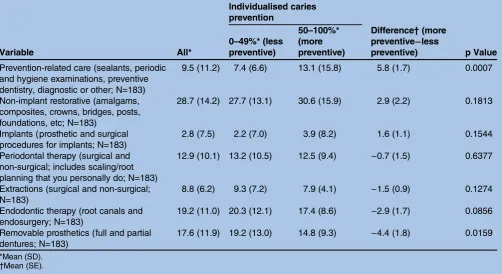
Table 3 shows the practice patterns of dental
proce-dures and the differences of practice patterns by use of individualised caries prevention. Participants spent 29% of their time on non-implant restorative, 19% on endo-dontic therapy and 18% on removable prosthetics. Participants spent 10% of their time on prevention-related care. Participants who were ‘more preventive’ (n=72) spent significantly more time on preventive den-tistry ( p=0.0007) and less time on removable prosthetics ( p=0.0159).
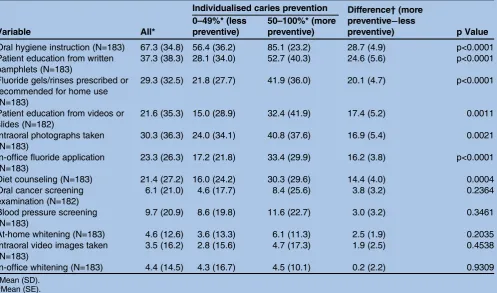
Table 4 shows the relation among certain procedures
performed in general dental practice and the percent-age of time that patients receive prevention-related care. The mean percentage of patients who receive oral hygiene instruction was 67%, while 37% received patient
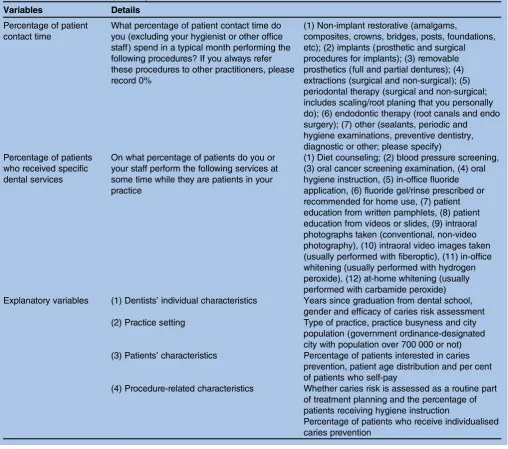
Table 1 Outcomes and explanatory variables
Variables Details
Percentage of patient contact time
What percentage of patient contact time do you (excluding your hygienist or other office staff) spend in a typical month performing the following procedures? If you always refer these procedures to other practitioners, please record 0%
(1) Non-implant restorative (amalgams,
composites, crowns, bridges, posts, foundations, etc); (2) implants (prosthetic and surgical procedures for implants); (3) removable prosthetics (full and partial dentures); (4) extractions (surgical and non-surgical); (5) periodontal therapy (surgical and non-surgical; includes scaling/root planing that you personally do); (6) endodontic therapy (root canals and endo surgery); (7) other (sealants, periodic and hygiene examinations, preventive dentistry, diagnostic or other; please specify) Percentage of patients
who received specific dental services
On what percentage of patients do you or your staff perform the following services at some time while they are patients in your practice
(1) Diet counseling; (2) blood pressure screening, (3) oral cancer screening examination, (4) oral hygiene instruction, (5) in-office fluoride application, (6) fluoride gel/rinse prescribed or recommended for home use, (7) patient education from written pamphlets, (8) patient education from videos or slides, (9) intraoral photographs taken (conventional, non-video photography), (10) intraoral video images taken (usually performed with fiberoptic), (11) in-office whitening (usually performed with hydrogen peroxide), (12) at-home whitening (usually performed with carbamide peroxide) Explanatory variables (1) Dentists’individual characteristics Years since graduation from dental school,
gender and efficacy of caries risk assessment (2) Practice setting Type of practice, practice busyness and city
population (government ordinance-designated city with population over 700 000 or not) (3) Patients’characteristics Percentage of patients interested in caries
prevention, patient age distribution and per cent of patients who self-pay
(4) Procedure-related characteristics Whether caries risk is assessed as a routine part of treatment planning and the percentage of patients receiving hygiene instruction
Percentage of patients who receive individualised caries prevention
on September 22, 2020 by guest. Protected by copyright.
education from written pamphlets. Participants who were‘more preventive’(n=72) administered significantly more oral hygiene instruction ( p<0.0001), gave written pamphlets ( p<0.0001), either prescribed fluoride gels/-rinses or recommended for home use ( p<0.0001), had patient education available from videos or slides ( p=0.0011), obtained intraoral photographs ( p=0.0021), had in-office fluoride applications ( p<0.0001) and pro-vided diet counselling ( p=0.0004).
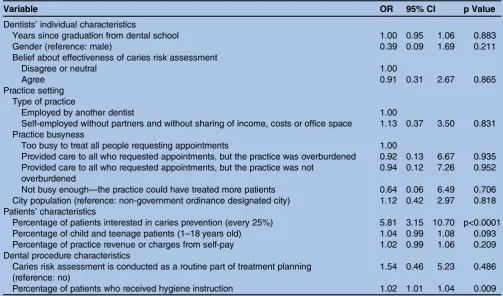
Factors associated with providing individualised caries prevention
The results of multiple logistic regression analysis are shown intable 5. Two factors were significantly associated with whether or not the practitioner reported providing
individualised caries prevention to 50% of patients or more. The ORs (95% CIs) were as follows: the percent-age of patients interested in caries prevention, 5.81 (3.15 to 10.70); and the percentage of patients who received hygiene instruction, 1.02 (1.01 to 1.04).
DISCUSSION
Seventy-two participants (38%) answered that the per-centage of patients who received individualised caries prevention was 50% or more (‘more preventive’). Overall, 10% of the time in daily practice was spent on prevention-related care. Dentists who provided indivi-dualised caries prevention to 50% or more of their patients spent significantly more time on preventive care and provided less removable prosthetics treatment than
Table 2 Summary of dentists’, practices’and patients’characteristics and certain dental procedures performed12 13
Number (%) or mean±SD Dentist’s individual characteristics
Years since graduation from dental school (year)* (n=185) 18.5±9.9
Gender (male), n (%) (n=187) 154 (82)
Belief about the effectiveness of caries risk assessment, n (%) (n=189)
Agree 127 (67)
Disagree or neutral 62 (33)
Practice setting
Type of practice, n (%) (n=182)
Employed by another dentist 77 (41)
Self-employed without partners and without sharing of income, costs or office space 105 (56) Practice busyness, n (%) (n=181)
Too busy to treat all people requesting appointments 19 (11)
Provided care to all, but the practice was overburdened 72 (40)
Provided care to all, but the practice was not overburdened 59 (33)
Not busy enough 31 (17)
City population (government ordinance-designated city), n (%) (n=189) 76 (40) Patients’characteristics
Percentage of patients interested in caries prevention, n (%) (n=189)
0 (none) 16 (8)
1–24 80 (42)
25–49 38 (20)
50–74 46 (24)
75–99 8 (4)
100 1 (1)
Patient age distribution (years)*
1–18 (%) (n=183) 16.1±13.2
19–44 (%) (n=188) 24.8±11.0
45–64 (%) (n=183) 30.4±11.2
65+ (%) (n=183) 28.5±17.4
Percent of patients who self-pay (%)* (n=183) 8.6±16.6
Dental procedure characteristics
Percentages of patients who receive individualised caries prevention, n (%) (n=189)
0 (none) 9 (5)
1–24 68 (36)
25–49 40 (21)
50–74 37 (20)
75–99 24 (13)
100 11 (6)
Caries risk is assessed as a routine part of treatment planning, n (%) (n=189) 49 (26) Percentage of patients who received hygiene instruction (%)* (n=183) 67.3±34.8
*Mean±SD. on September 22, 2020 by guest. Protected by copyright.
those who did not. Additionally, they provided oral hygiene instruction, patient education, fluoride recom-mendations and diet counselling to their patients signifi -cantly more often than dentists who provided individualised caries prevention to less than 50% of their patients. The results of the multiple logistic regres-sion analysis suggested that several variables were asso-ciated with whether or not dentists provide individualised caries prevention to 50% or more of their patients. Specifically, the percentage of patients inter-ested in caries prevention and the percentage of patients
who received hygiene instruction were significantly asso-ciated with high percentages of patients who receive individualised caries prevention.
According to the results of the same questionnaire survey by the US DPBRN, 52% of patients received indi-vidualised caries prevention.9 21The results of this study possibly suggest that dentists in the DPBRN and JDPBRN (41.3%) have similar tendencies in providing individualised caries prevention, but the proportion was lower in Japan than in the USA. Additionally, dentists spent 10% of their time on prevention-related care in
Table 3 Percentage of patient contact time spent doing certain procedures in a typical month, overall and by the percentage
of patients who receive individualised caries prevention
Variable All*
Individualised caries prevention
Difference†(more preventive−less
preventive) p Value 0–49%* (less
preventive)
50–100%* (more preventive)
Prevention-related care (sealants, periodic and hygiene examinations, preventive dentistry, diagnostic or other; N=183)
9.5 (11.2) 7.4 (6.6) 13.1 (15.8) 5.8 (1.7) 0.0007
Non-implant restorative (amalgams, composites, crowns, bridges, posts, foundations, etc; N=183)
28.7 (14.2) 27.7 (13.1) 30.6 (15.9) 2.9 (2.2) 0.1813
Implants (prosthetic and surgical procedures for implants; N=183)
2.8 (7.5) 2.2 (7.0) 3.9 (8.2) 1.6 (1.1) 0.1544
Periodontal therapy (surgical and non-surgical; includes scaling/root planning that you personally do; N=183)
12.9 (10.1) 13.2 (10.5) 12.5 (9.4) −0.7 (1.5) 0.6377
Extractions (surgical and non-surgical; N=183)
8.8 (6.2) 9.3 (7.2) 7.9 (4.1) −1.5 (0.9) 0.1274
Endodontic therapy (root canals and endosurgery; N=183)
19.2 (11.0) 20.3 (12.1) 17.4 (8.6) −2.9 (1.7) 0.0856
Removable prosthetics (full and partial dentures; N=183)
17.6 (11.9) 19.2 (13.0) 14.8 (9.3) −4.4 (1.8) 0.0159
*Mean (SD).
†Mean (SE).
Figure 1 Distribution of the
percentages of patients who receive individualised caries prevention, n. Seventy-two participants (38%) answered that 50% or more of their patients received individualised caries prevention. Eleven participants (6%) answered that 100% of their patients received individualised caries prevention.
on September 22, 2020 by guest. Protected by copyright.
this study, which was less when compared with Northern European dentists. A previous study conducted in Norway reported that the mean caries preventive treat-ment time was 16.6% of the total treattreat-ment time (den-tists who did not treat adult patients were excluded)22 and 22% of the total time for child patients.23 In Denmark, Iceland and Norway, dental prevention con-sumes 18–50% of the dentist’s total time in dental care for children and adolescents.24 In the USA, the average time that general practitioners spent performing pre-ventive procedures increased from 9.4% in 1981 to 12.4% in 1993.25The lower preventive treatment time in Japan may be due to the differences in the healthcare system between Northern Europe and Japan. In Finland in 1999, all inhabitants under the age of 19 were entitled to free comprehensive public dental care, with a utilisa-tion rate of approximately 95%.26 However, in Japan, dental insurance systems mainly cover dental treat-ment,27 so that the percentage of time spent on prevent-ive treatment might be restricted due to economic reasons. In addition, dentists’ perception regarding pre-vention could be one of the reasons that explain varia-tions in preventive practice in this population. Taylor-Goobyet al28 pointed out that professional values for preventive care affect practice patterns of preventive dentistry and that British dentists valued a restorative paradigm as opposed to a preventive paradigm which devalued traditional restorative skills in a context of
‘continuing care’ payment in 1990s. Also Fox29reviewed dentists’perceptions of prevention and its application in practice and highlighted that recently, most dentists regarded aspects of prevention to be part of their profes-sional work, a source of job satisfaction and of value to the practice, its image and a marker of quality of care. Further studies are needed to clarify associations between dentists’ perception of dental prevention and its practice.
A detailed analysis of the practice patterns of prevention-related care revealed that the percentages of time spent on preventive care, which differed between ‘more preventive’ and‘less preventive’dentists, were sig-nificantly different in practices that administered pre-ventive care more than 20% of the time. Dentists in this study or their dental auxiliaries, provided oral hygiene instruction to 67% of their patients at some point in the patient’s course of treatment and this percentage dif-fered significantly as‘more preventive’and‘less prevent-ive’ dentists. The percentage of patients who received hygiene instruction was also associated with the adminis-tration of individualised caries prevention in the mul-tiple regression analysis.
Our study clarified that a positive patient perception of preventive dentistry (as measured by the percentage of patients in the practice who are interested in caries prevention) and a higher percentage of patients in the practice who received hygiene instruction were
Table 4 Dentists’reports of the percentage of patients who receive the procedure at some time in their practice, overall and
by the percentage of patients in the practice who receive individualised caries prevention
Variable All*
Individualised caries prevention Difference†(more preventive−less
preventive) p Value 0–49%* (less
preventive)
50–100%* (more preventive)
Oral hygiene instruction (N=183) 67.3 (34.8) 56.4 (36.2) 85.1 (23.2) 28.7 (4.9) p<0.0001 Patient education from written
pamphlets (N=183)
37.3 (38.3) 28.1 (34.0) 52.7 (40.3) 24.6 (5.6) p<0.0001
Fluoride gels/rinses prescribed or recommended for home use (N=183)
29.3 (32.5) 21.8 (27.7) 41.9 (36.0) 20.1 (4.7) p<0.0001
Patient education from videos or slides (N=182)
21.6 (35.3) 15.0 (28.9) 32.4 (41.9) 17.4 (5.2) 0.0011
Intraoral photographs taken (N=183)
30.3 (36.3) 24.0 (34.1) 40.8 (37.6) 16.9 (5.4) 0.0021
In-office fluoride application (N=183)
23.3 (26.3) 17.2 (21.8) 33.4 (29.9) 16.2 (3.8) p<0.0001
Diet counseling (N=183) 21.4 (27.2) 16.0 (24.2) 30.3 (29.6) 14.4 (4.0) 0.0004
Oral cancer screening examination (N=182)
6.1 (21.0) 4.6 (17.7) 8.4 (25.6) 3.8 (3.2) 0.2364
Blood pressure screening (N=183)
9.7 (20.9) 8.6 (19.8) 11.6 (22.7) 3.0 (3.2) 0.3461
At-home whitening (N=183) 4.6 (12.6) 3.6 (13.3) 6.1 (11.3) 2.5 (1.9) 0.2035
Intraoral video images taken (N=183)
3.5 (16.2) 2.8 (15.6) 4.7 (17.3) 1.9 (2.5) 0.4538
In-office whitening (N=183) 4.4 (14.5) 4.3 (16.7) 4.5 (10.1) 0.2 (2.2) 0.9309
*Mean (SD).
†Mean (SE).
on September 22, 2020 by guest. Protected by copyright.
associated with the use of individualised caries preven-tion to a higher percentage of patients. According to the results of the same questionnaire survey by the US DPBRN, dentists’ individual characteristics, practice set-tings and dental procedures were associated with provid-ing individualised caries prevention to a greater percentage of patients.9 Additionally, Brennan and Spencer30 noted that dentists’ individual characteristics, practice settings and patient characteristics influenced the pattern of preventive care delivered. Our model also included dentists’ individual characteristics, practice set-tings and dental procedures and the dentists’ ratings of patients’ preference for preventive care were related more strongly than those factors. In addition, a previous systematic review noted that potential barriers to the adherence to physicians’ guidelines included dentists’ and patients’ preferences.31 32 As Cabana et al31 noted, potential barriers to the adherence to physicians’ guide-lines changed depending on the topic and it is possible that dentists’ ratings of patient preference are strongly related to the practice of preventive dentistry.
However, our studies suggested that dentists’ beliefs about the effectiveness of caries risk assessment were not related to their tendency to use individualised caries pre-vention. A possible reason for this is that the majority of participants (67%) agree that caries risk assessment is effective. This high percentage of agreement with the
effectiveness of caries risk assessment is consistent with previous studies. According to the results of the same questionnaire by the US DPBRN, 77% of dentists answered that they agree with the effectiveness of caries risk assessment. Further studies are needed to clarify the relationship between the use of preventive dentistry and their beliefs about its effectiveness.
The main strength of this study was its relatively wide diversity of participants, with respondents from all seven regions of Japan. The age and gender distribution of this study sample was similar to the actual distribution of den-tists in Japan (80% male, average age in the 40s),33 thereby enhancing the generalisability of the findings. However, the study results should be approached with caution. First, participants were not selected by random sampling, but rather by responding to the invitation to participate in the JDPBRN. Second, no objective standard for cut-off regarding an adequate prevalence of patients receiving individualised caries prevention has been estab-lished, although we used prior planned cut-offs with the mean from the previous US studies. Third, it is possible that the questionnaire’s validity is influenced by the reim-bursement/insurance system, which is quite different between the USA and Japan. Finally, given the cross-sectional nature of our study, causative relationships between factors and the provision of individualised caries prevention were difficult to assess.
Table 5 A multiple logistic regression of whether the dentist provides individualised caries prevention on 50% or more of
patients (n=163)
Variable OR 95% CI p Value
Dentists’individual characteristics
Years since graduation from dental school 1.00 0.95 1.06 0.883
Gender (reference: male) 0.39 0.09 1.69 0.211
Belief about effectiveness of caries risk assessment
Disagree or neutral 1.00
Agree 0.91 0.31 2.67 0.865
Practice setting Type of practice
Employed by another dentist 1.00
Self-employed without partners and without sharing of income, costs or office space 1.13 0.37 3.50 0.831 Practice busyness
Too busy to treat all people requesting appointments 1.00
Provided care to all who requested appointments, but the practice was overburdened 0.92 0.13 6.67 0.935 Provided care to all who requested appointments, but the practice was not
overburdened
0.94 0.12 7.26 0.952
Not busy enough—the practice could have treated more patients 0.64 0.06 6.49 0.706 City population (reference: non-government ordinance designated city) 1.12 0.42 2.97 0.818 Patients’characteristics
Percentage of patients interested in caries prevention (every 25%) 5.81 3.15 10.70 p<0.0001
Percentage of child and teenage patients (1–18 years old) 1.04 0.99 1.08 0.093
Percentage of practice revenue or charges from self-pay 1.02 0.99 1.06 0.209
Dental procedure characteristics
Caries risk assessment is conducted as a routine part of treatment planning (reference: no)
1.54 0.46 5.23 0.486
Percentage of patients who received hygiene instruction 1.02 1.01 1.04 0.009
The outcome of interest (individualised caries prevention) was coded as follows: 1=provides individualised caries prevention on 50% or more of the practice’s patients; 0=does not. Hosmer-Lemshow goodness-of-fit, 0.0503.
on September 22, 2020 by guest. Protected by copyright.
CONCLUSION
We identified substantial variation in dentists’ practice patterns regarding caries preventive dentistry in this study population. Individualised caries prevention was significantly related to provision of other preventive ser-vices and to the practice having a higher percentage of patients interested in prevention, but not to the dentist’s belief about the effectiveness of caries risk assessment.
Contributors YY, NK, FS, YM, GHG and VVG contributed in arranging
reagents/materials/analysis tools, conceived and designed the experiments and revised and reviewed the paper. NK, YM and FS performed the experiments. YY and NK analyzed the data and wrote the paper.
Funding Certain components of this work were supported by the National
Institutes of Health grants U01-DE-16746, U01-DE-16747 and U19-DE-22516; a Grant-in-Aid for JSPS Fellows Grant number 23-10883 from the Japan Society for the Promotion of Science ( JSPS), Japan.
Competing interests Two authors are dentists employed by a dental clinic
(Dr Futoshi Sumida: Mikami Dental and Orthodontics Clinic and Dr Yuki Matsumoto: Matsumoto Dental Clinic).
Patient consent Obtained.
Ethics approval The Ethics Committee of Kyoto University Graduate School
and Faculty of Medicine.
Provenance and peer review Not commissioned; externally peer reviewed.
Data sharing statement The translated version of these questionnaires is
available at http://www.dentalpbrn.org/uploadeddocs/Study%201( Japanese% 20Version.pdf). (Original English version: http://nationaldentalpbrn.org/pdf/Study %201%20questionnaire%20FINAL%20after%20pre-testing%20021306.pdf).
Open Access This is an Open Access article distributed in accordance with
the Creative Commons Attribution Non Commercial (CC BY-NC 3.0) license, which permits others to distribute, remix, adapt, build upon this work non-commercially, and license their derivative works on different terms, provided the original work is properly cited and the use is non-commercial. See: http:// creativecommons.org/licenses/by-nc/3.0/
REFERENCES
1. Balakrishnan M, Simmonds RS, Tagg JR. Dental caries is a preventable infectious disease.Aust Dent J2000;45:235–45. 2. Reich E, Lussi A, Newbrun E. Caries-risk assessment.Int Dent J
1999;49:15–26.
3. Rank P, Julien JH, Lyman DO. Preventable dental disease.West J Med1983;139:545–6.
4. Centers for Disease Control and Prevention. Preventing Dental Caries with Community Programs, 2012. http://www.cdc.gov/ oralhealth/publications/factsheets/dental_caries.htm
5. World Health Organization. Oral health.Fact sheet N°318. 2012. http://www.who.int/mediacentre/factsheets/fs318/en/index.html 6. Zero DT, Fontana M, Martinez-Mier EA,et al. The biology, prevention,
diagnosis and treatment of dental caries: scientific advances in the United States.J Am Dent Assoc2009;140(Suppl 1):25S–34S. 7. Axelsson P, Lindhe J, Nystrom B. On the prevention of caries and
periodontal disease. Results of a 15-year longitudinal study in adults.J Clin Periodontol1991;18:182–9.
8. Axelsson P, Nystrom B, Lindhe J. The long-term effect of a plaque control program on tooth mortality, caries and periodontal disease in adults. Results after 30 years of maintenance.J Clin Periodontol
2004;31:749–57.
9. Riley JL 3rd, Gordan VV, Ajmo CT,et al. Dentists’use of caries risk assessment and individualized caries prevention for their adult patients: findings from The Dental Practice-Based Research Network.Community Dent Oral Epidemiol2011;39:564–73.
10. Fontana M, Zero DT. Assessing patients’caries risk.J Am Dent Assoc2006;137:1231–9.
11. Twetman S, Fontana M. Patient caries risk assessment.Monogr Oral Sci2009;21:91–101.
12. Kakudate N, Sumida F, Matsumoto Y,et al. Restorative treatment thresholds for proximal caries in dental PBRN.J Dent Res
2012;91:1202–8.
13. Yokoyama Y, Kakudate N, Sumida F,et al. Dentists’dietary perception and practice patterns in a dental practice-based research network.PLoS ONE2013;8:e59615.
14. Gilbert GH, Williams OD, Rindal DB,et al. The creation and development of the dental practice-based research network.J Am Dent Assoc2008;139:74–81.
15. Gordan VV, Garvan CW, Heft MW,et al. Restorative treatment thresholds for interproximal primary caries based on radiographic images: findings from the Dental Practice-Based Research Network.
Gen Dent2009;57:654–63; quiz 64–6, 595, 680.
16. Makhija SK, Gilbert GH, Rindal DB,et al. Dentists in practice-based research networks have much in common with dentists at large: evidence from the Dental Practice-Based Research Network.Gen Dent2009;57:270–5.
17. Sperber AD. Translation and validation of study instruments for cross-cultural research.Gastroenterology2004;126(1 Suppl 1): S124–8.
18. Gordan VV, Bader JD, Garvan CW,et al. Restorative treatment thresholds for occlusal primary caries among dentists in the dental practice-based research network.J Am Dent Assoc
2010;141:171–84.
19. Bader JD, Shugars DA. What do we know about how dentists make caries-related treatment decisions?.Community Dent Oral Epidemiol
1997;25:97–103.
20. Gilbert GH, Shewchuk RM, Litaker MS. Effect of dental practice characteristics on racial disparities in patient-specific tooth loss.Med Care2006;44:414–20.
21. Gordan VV, Riley JL III, Carvalho RM,et al. Methods used by Dental Practice-based Research Network (DPBRN) dentists to diagnose dental caries.Oper Dent2011;36:2–11.
22. Haugejorden O, Nielsen WA. Experimental study of two methods of data collection by questionnaire.Community Dent Oral Epidemiol
1987;15:205–8.
23. Wang NJ, Aspelund GO. Preventive care and recall intervals. Targeting of services in child dental care in Norway.Community Dent Health2010;27:5–11.
24. Wang NJ, Kalletstal C, Petersen PE,et al. Caries preventive services for children and adolescents in Denmark, Iceland, Norway and Sweden: strategies and resource allocation.Community Dent Oral Epidemiol1998;26:263–71.
25. Brown LJ, Lazar V. Dental procedure fees 1975 through 1995: how much have they changed?J Am Dent Assoc1998; 129:1291–5.
26. Helminen SK, Vehkalahti MM. Does caries prevention correspond to caries status and orthodontic care in 0- to 18-year-olds in the free public dental service?Acta Odontol Scand2003;61: 29–33.
27. Miyazaki H, Morimoto M. Changes in caries prevalence in Japan.
Eur J Oral Sci1996;104(4 (Pt 2)):452–8.
28. Taylor-Gooby P, Sylvester S, Calnan M,et al. Knaves and gnashers: professional values and private dentistry.J Soc Policy
2000;29:375–95.
29. Fox C. Evidence summary: what do dentists mean by‘prevention’ when applied to what they do in their practices?Br Dent J
2010;208:359–63.
30. Brennan DS, Spencer AJ. The role of dentist, practice and patient factors in the provision of dental services.Community Dent Oral Epidemiol2005;33:181–95.
31. Cabana MD, Rand CS, Powe NR,et al. Why don’t physicians follow clinical practice guidelines? A framework for improvement.JAMA
1999;282:1458–65.
32. Cochrane LJ, Olson CA, Murray S,et al. Gaps between knowing and doing: understanding and assessing the barriers to optimal health care.J Contin Educ Health Prof2007;27:94–102. 33. Ministry of Health Labour and Welfare. Survey of Physicians,
Dentists and Pharmacists: trends in the number of dentists. 2010. http://www.mhlw.go.jp/toukei/saikin/hw/ishi/10/dl/ kekka_2.pdf
on September 22, 2020 by guest. Protected by copyright.