RESEARCH
Highly efficient methane generation
from untreated microalgae biomass
Viktor Klassen
1, Olga Blifernez‑Klassen
1, Daniel Wibberg
1, Anika Winkler
1, Jörn Kalinowski
1, Clemens Posten
2and Olaf Kruse
1*Abstract
Background: The fact that microalgae perform very efficiently photosynthetic conversion of sunlight into chemi‑ cal energy has moved them into the focus of regenerative fuel research. Especially, biogas generation via anaerobic digestion is economically attractive due to the comparably simple apparative process technology and the theoretical possibility of converting the entire algal biomass to biogas/methane. In the last 60 years, intensive research on biogas production from microalgae biomass has revealed the microalgae as a rather challenging substrate for anaerobic digestion due to its high cell wall recalcitrance and unfavorable protein content, which requires additional pretreat‑ ment and co‑fermentation strategies for sufficient fermentation. However, sustainable fuel generation requires the avoidance of cost/energy intensive biomass pretreatments to achieve positive net‑energy process balance.
Results: Cultivation of microalgae in replete and limited nitrogen culture media conditions has led to the formation of protein‑rich and low protein biomass, respectively, with the last being especially optimal for continuous fermen‑ tation. Anaerobic digestion of nitrogen limited biomass (low‑N BM) was characterized by a stable process with low levels of inhibitory substances and resulted in extraordinary high biogas, and subsequently methane productivity [750 ± 15 and 462 ± 9 mLN g−1 volatile solids (VS) day−1, respectively], thus corresponding to biomass‑to‑methane
energy conversion efficiency of up to 84%. The microbial community structure within this highly efficient digester revealed a clear predominance of the phyla Bacteroidetes and the family Methanosaetaceae among the Bacteria and Archaea, respectively. The fermentation of replete nitrogen biomass (replete‑N BM), on the contrary, was demon‑ strated to be less productive (131 ± 33 mLN CH4 g−1VS day−1) and failed completely due to acidosis, caused through
high ammonia/ammonium concentrations. The organization of the microbial community of the failed (replete‑N) digester differed greatly compared to the stable low‑N digester, presenting a clear shift to the phyla Firmicutes and Thermotogae, and the archaeal population shifted from acetoclastic to hydrogenotrophic methanogenesis.
Conclusions: The present study underlines the importance of cultivation conditions and shows the practicability of microalgae biomass usage as mono‑substrate for highly efficient continuous fermentation to methane without any pretreatment with almost maximum practically achievable energy conversion efficiency (biomass to methane). Keywords: Biofuel, Biogas, Methane, Microalgae mono‑substrate, Nitrogen limitation, Continuous anaerobic fermentation/digestion, Maximal energy conversion efficiency, Microbial community, Ammonia/ammonium inhibition
© The Author(s) 2017. This article is distributed under the terms of the Creative Commons Attribution 4.0 International License (http://creativecommons.org/licenses/by/4.0/), which permits unrestricted use, distribution, and reproduction in any medium, provided you give appropriate credit to the original author(s) and the source, provide a link to the Creative Commons license, and indicate if changes were made. The Creative Commons Public Domain Dedication waiver (http://creativecommons.org/ publicdomain/zero/1.0/) applies to the data made available in this article, unless otherwise stated.
Open Access
*Correspondence: olaf.kruse@uni‑bielefeld.de
1 Department of Biology/Center for Biotechnology (CeBiTec), Bielefeld University, Universitätsstrasse 27, 33615 Bielefeld, Germany
Background
The steadily increasing global energy demand and lim-ited fossil fuel sources have created tremendous efforts in developing renewable energy sources [1, 2]. Third gen-eration biofuels, specifically derived from microalgae, are considered to be a viable alternative energy resource [3–5] because they can grow on non-arable land using fresh, saline or waste water and produce large amounts of lipids, proteins and carbohydrates over short periods of time, which can be processed into biofuels (e.g., biodiesel, bioethanol, hydrogen, methane) and valuable co-prod-ucts [5–9]. Microalgae are often described as “lower” plants that never have true stems, roots, and leaves, and grow photoautotrophically by performing oxygenic pho-tosynthesis [10], achieving biomass productivities of up to 91 tons ha−1 year−1 with relatively simple cultivation systems such as raceway ponds [11, 12]. And although mass production of microalgae is still expensive at the moment, because of their high theoretical and practical areal productivities, microalgae are in focus of research for biofuel production [3, 9, 13]. Nowadays, however, the generation of biofuels such as biodiesel or bioethanol is not economically relevant, due to the currently incurred costs for biomass production and downstream process-ing [13].
Methane generation via anaerobic fermentation rep-resents an alternative way, generating gaseous fuel from biomass. Anaerobic digestion (AD) is simple in appli-cation and highly efficient, since up to 88% conversion efficiency can be reached with the appropriate substrate [14]. AD is widely used for fermentation of the so-called energy crops and organic waste material to gain methane, which is used as fuel or for electricity and heat genera-tion [15–17]. Nevertheless, today microalgae biomass is not regarded as suitable substrate for biogas generation in AD process mainly for two reasons: (1) high recalci-trance towards microbial decomposition mediated by the rigid cell wall, and (2) unfavorable low carbon-to-nitrogen (C/N) ratio of the biomass caused by a high pro-tein content [18, 19]. The resistance of the cell wall can be overcome by application of physical and enzymatical pretreatments [20–24], hereby unfortunately increasing investment costs for biomass processing. Additionally, the continuous fermentation of this pretreated, and thus completely accessible biomass as mono-substrate was shown to be not efficient [19], mainly due to ammonia inhibition of methanogens, released from protein deg-radation [20, 24–26]. To avoid the C/N imbalance of the substrate, co-fermentation with other carbon-rich sub-strates represents one possible strategy [27, 28]. Alter-natively, some research was performed in the past, for the reduction of the protein content in the biomass by applying limited amounts of nitrogen or phosphate to the
culture media [29, 30]. This strategy seem to be favoring not only lower protein content but also the accessibility of algae to microbial communities, which was monitored by methane potential tests and intact cells counting before and after the batch fermentation process [30]. Microal-gae belonging to three different genera Chlamydomonas,
Chlorella and Scenedesmus revealed with ongoing starva-tion status higher C/N ratios (24–26, on weight basis) in the biomass and lost subsequently the capability to resist the bacterial degradation, leading consequently to higher methane yields [30] with conversions rates near the theo-retical maximum [19].
However, these experiments were performed in batch fermentation mode, allowing conclusions only regarding the accessibility of biomass towards anaerobic degrada-bility and the achievement of maximal possible methane yields. In a regular case (industrial scale), fermentation of biomass is performed in a continuous or semi-con-tinuous mode since this is more efficient regarding volu-metric productivity. In this mode, other factors besides biodegradability can play a crucial role, e.g., ammonia or ammonium inhibition (often caused by high protein con-tent), long chain fatty acid inhibition (caused by high lipid content), enrichment of toxic compounds and unbal-ance of macro/micro nutrients (necessary for growth of microbial community) [13, 15, 31]. Additionally, a variety of process parameters [hydraulic retention time (HRT), organic loading rate (OLR), temperature, pH] has to be considered for optimal performance of the digester, to avoid a complete failure of the process [19, 31].
The present study was aiming to prove the feasibility of microalgae biomass as mono-substrate, derived from nitrogen-limited growth conditions, in a long-term con-tinuous fermentation process.
Results and discussion
from previous work [30], biomass harvesting was always performed after 6 days of cultivation for both conditions.
The phototrophic algae, cultivated in culture media with low and replete nitrogen concentrations, showed no significant differences in biomass accumulation rates at the harvesting time (Fig. 1, 6 days). After 7 days of cul-tivation, an obvious starvation of biomass accumulation could be monitored in low-N media, due to nitrogen depletion. In accordance with the expectation, biomass accumulation was observed in replete-N conditions up to day 10. Conclusively, no obvious disadvantages in bio-mass productivity (until day 6, harvesting time point) could be observed after the application of nitrogen limit-ing culturlimit-ing conditions (Fig. 1).
The biomass composition of C. reinhardtii cultivated under replete-N and low-N conditions revealed signifi-cant differences regarding the protein and almost no dif-ference in lipid content (Table 1), which is consistent with earlier observations on the total lipid and carbohydrate
(mainly starch) content in C. reinhardtii CC-1690 under nitrogen deprivation [34, 35]. Consequently, carbohy-drates represent the main carbon sink in nitrogen starved
C. reinhardtii cells.
Based on biomass composition, the theoretical meth-ane potential was calculated using the Buswell equa-tion [36] and empirical formula stated by Heaven et al. [37] and revealed no significant difference with approxi-mately 551 and 549 mLN g−1 VS between replete-N and low-N biomass, respectively (Table 1). Furthermore, cor-responding to 2.2-fold lower protein content, the con-centration of elemental nitrogen in the low-N biomass was decreased to only 2.9 ± 0.2% of dry weight (DW), whereas the nitrogen amount in the replete-N condi-tions resulted in 7.3 ± 0.7% of DW. This finding has a direct impact on the C/N ratio in the biomass, which is one of the most critical factors for a continuous fer-mentation process (C/N ratio: replete-N = 6.9 ± 0.7, low-N = 16.3 ± 1.1, Table 1) [38, 39]. In this particular case, the C/N ratio of the biomass, cultured under low-N conditions was within the range of 15–30, which is gen-erally regarded as optimal for fermentation processes [15,
39, 40].
Anaerobic digestion of microalgae biomass as mono‑substrate
The continuous fermentation of algal biomass, generated under replete-N and low-N culture conditions was per-formed under a constant HRT of 20 days, and the organic loading rate (ORL) was subsequently increased from 1 g VS L−1 day−1 in the beginning, over 2 g VS L−1 day−1 and to 4 g VS L−1 day−1 at the end of the experiment (ORL 1, 2 and 4, respectively, Fig. 2). These loading rates were chosen since ORL 2 and 4 (2 and 4 g VS L−1 day−1, respectively) are generally used in biogas plants for con-tinuous wet fermentation processes on industrial scale [15]. Differences in the fermentation performance of these two types of biomass were already obvious in the beginning at OLR 1 (adaptation phase), where the gas productivity was not only lower in the replete-N reac-tor, but was also coupled to a slower adaptation process (defined by stable biogas production). During the whole OLR 2-period, biogas as well as methane productivities were lower and less constant in the replete-N reactor compared to the low-N reactor. With the start of OLR 4, the gas productivity of the replete-N reactor started to decrease and reached the minimum level of specific biogas productivity of 62 ± 2 mLN day−1 g−1 VS, at the end of the experiment. In contrast to replete-N biomass, the biogas as well as methane productivity of the low-N BM reactor remained constantly high (Fig. 2) during the whole experiment (exclusive adaptation period, OLR 1). Despite the significantly lower methane concentration in Fig. 1 Photoautotrophic accumulation of algal biomass under
replete‑N and low‑N culture conditions. Harvesting for fermenta‑ tion experiments was performed at day 6 for both media conditions (indicated by arrow). VS volatile solids
Table 1 Microalgae biomass characteristics
After harvesting for fermentation, important parameters of C. reinhardtii biomass were determined and presented as mean values. Error bars represent standard error (SE, n = 8)
BM biomass, DW dry weight, N nitrogen, C carbon, VS volatile solids, TMP theoretical methane potential, COD chemical oxygen demand
Replete‑N
BM Low‑N BM
Proteins (% DW) 61.0 ± 5.1 28.0 ± 3.1 Carbohydrates (% DW) 21.0 ± 3.8 52.9 ± 3.5 Lipids (% DW) 20.1 ± 0.8 21.4 ± 1.2
C (% DW) 50.3 ± 1.6 46.4 ± 1.7
N (% DW) 7.3 ± 0.7 2.9 ± 0.2
Volatile solids (% DW) 95.3 ± 1.0 95.6 ± 0.4 COD (g−g DW) 1.34 ± 0.11 1.31 ± 0.11
C/N ratio 6.9 ± 0.7 16.3 ± 1.1
the biogas of low-N digester with 61 ± 0.4% compared to 65 ± 0.9% of replete-N digester (Additional file 1: Figure S1), the overall methane productivity was higher from low-N biomass (Fig. 2) during the complete experimen-tal time course. The overview of the mean biogas and methane productivities, presented in Table 2, under-lines that microalgae biomass from replete-N conditions can only efficiently be used at OLR 2 (2 g VS L−1 day−1). However, even this organic loading rate of replete-N biomass is already critical since the biogas productivity was not continually stable. The application of a higher loading rate (OLR 4) has a strongly negative effect on the biogas productivity from replete-N biomass (Fig. 2). On the other hand, fermentation of low-N biomass was observed to be stable over both periods OLR 2 and 4, with constantly high methane productivities of 464 ± 9 and 462 ± 9 mLN g−1 VS day−1, respectively (Table 2). The overall achieved methane productivity of low-N algal biomass showed a 36% higher productivity in compari-son to maize (Table 2) [41].
Despite of the fact that the theoretical methane poten-tial of replete-N and low-N biomass were quite similar, the specific methane productivity of low-N biomass was significantly higher compared to the biomass derived
from replete-N conditions [464 ± 9 mLN g−1 VS day−1 vs. 416 ± 11 mLN g−1 VS day−1 at OLR 2 and 462 ± 9 mLN g−1 VS day−1 vs. 131 ± 33 mLN g−1 VS day−1 at OLR 4, respectively (Table 2)]. However, this finding corresponds well to previous observations, where starved biomass showed a higher accessibility and biodegradabil-ity compared to biomass from the linear growth phase [30]. To evaluate the possible reasons for the productivity differences between replete-N and low-N biomass, some essential fermentation parameters were analyzed for both reactors (Fig. 3; Additional file 1: Figures S2, S3, S4, Addi-tional file 1: Table S1).
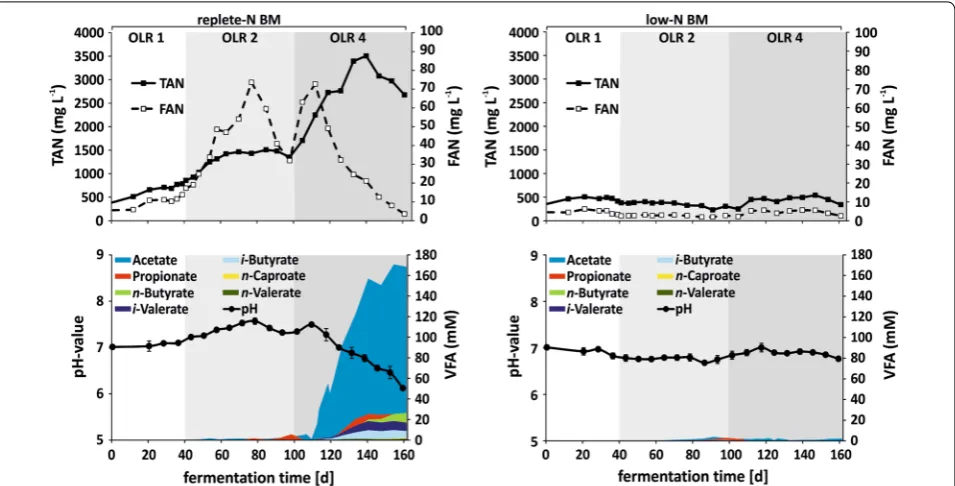
One of the most crucial parameters for the fermenta-tion of protein-rich biomass is nitrogen, which is released during anaerobic decomposition of biomass in form of ammonium into the reactor supernatant [26]. Monitor-ing of total ammonia nitrogen (TAN) concentration in the reactor revealed indeed a huge difference between the protein-rich (replete-N BM) and low protein (low-N BM) biomass (Fig. 3). The TAN concentrations in low-N reactor were observed to be constantly below 600 mg L−1 during the entire experiment. However, the TAN con-centration in the replete-N reactor increased at OLR 2 to a value of nearly 1500 mg L−1, which is already close to Fig. 2 Biogas and methane productivity via anaerobic fermentation of algal biomass in continuous mode. The biogas productivity was moni‑ tored online and methane content was measured weekly (left = replete‑N BM, right = low‑N BM). Organic loading rate (OLR) is indicated by shades of gray in the background, thereby following biomass concentrations were applied: OLR1 = 1 g VS L−1 day−1, OLR2 = 2 g VS L−1 day−1,
OLR4 = 4 g VS L−1 day−1. Error bars represent mean productivity of previous 7 days (SE, n= 7). N nitrogen, BM biomass, VS volatile solids
Table 2 Overview of mean biogas and methane productivities for the low-N and replete-N reactors
The values were summarized by distinct OLR-phases (OLR 2 = 2 g VS L−1 day−1, OLR 4 = 4 g VS L−1 day−1). Maize silage productivities were included for comparison as
predominantly used renewable substrate for industrial scale fermentation. Error bars represent standard error (SE, n = 8) N nitrogen, VS volatile solids
a Literature values for maize silage [41]
Specific biogas productivity Specific methane productivity (mLN g−1 VS day−1) (mLN g−1 VS day−1)
Replete‑N BM Low‑N BM Maize silage Replete‑N BM Low‑N BM Maize silage
OLR 2 g VS L−1 day−1 634 ± 15 761 ± 12 740a 416 ± 11 464 ± 9 404a
described inhibitory levels of 1700–1800 mg L−1 [26, 42,
43]. These inhibitory levels were exceeded directly after the loading rate of 4 g VS L−1 day−1 (OLR 4), reaching the maximum of 3507 ± 14 mg L−1 at day 140.
Nevertheless, free ammonia is known to be a more efficient inhibitor than ammonium and to have a strong negative effect primarily to the methanogens already at low concentration of 50–100 mg L−1 [26]. Indeed, high free ammonia nitrogen (FAN) concentration was observed in the replete-N reactor already at OLR 2 (Fig. 3), which could have had an inhibitory effect on methanogens, indicated by simultaneous decline in methane productivity at days 45–60 (Fig. 2). Yet, despite further increase of FAN to 74 ± 0.06 mg L−1 at day 77, the methane productivity remained stable, which may be due to Bacteria or Archaea adaptation to these FAN concentrations, and then the FAN-levels decreased again to 32 ± 0.05 mg L−1 (Fig. 3). At the beginning of OLR 4 (day 105), the FAN concentration in replete-N reactor increased again and reached maximal levels at day 112 with 73 ± 0.11 mg L−1 comparable to the maximal levels at OLR 2. Additionally, this increase was accompanied by a simultaneous increase of TAN (starting at day 105 as well), followed by a subsequent accumulation of acetate (from day 112, Fig. 3). Never-theless, the FAN concentration started to decrease after day 112 (Fig. 3, replete-N BM, upper graph), mostly due
to a drop of the pH which was caused by the constant increase of the volatile fatty acid (VFA) concentration. Especially, acetate (up to 170 mM) and other intermedi-ate fermentation products (from day 120) such as pro-pionate, n-butyrate, i-valerate, i-butyrate, n-caproate,
n-valerate increased further during the time course of the experiment (Fig. 3, replete-N BM, lower graph; detailed values in SI, Additional file 1: Table S1). It can be assumed that an efficient adaptation of anaerobic microorganisms (especially methanogens) was not pos-sible within the short time period, when the change of crucial factors such as FAN, TAN and VFA occurred. As a consequence, the process inhibition could not be surmounted, resulting in a drastic decrease of methane productivity and finally a complete failure of the fer-mentation process (Figs. 2, 3, replete-N BM). Similar observations were also made in other continuous fer-mentation approaches with protein-rich algal biomass as mono-substrate, where high TAN/FAN concentra-tions, and consequently increasing VFAs have led to decreased methane productivities [20, 24, 25, 29, 44,
45].
On the other hand, the reactor, fed with low-N bio-mass, did not show any imbalances in fermentation parameters, being constantly low throughout the entire experiment (Fig. 3, low-N BM). Especially, the FAN con-centration showed values lower than 5 mg L−1 during the Fig. 3 Analysis of essential fermentation parameters during anaerobic digestion of algal biomass in continuous mode. Left = replete‑N BM, Right = low‑N BM. Organic loading rate (OLR) is indicated by shades of gray in the background: OLR 1 = 1 g VS L−1 day−1, OLR 2 = 2 g VS L−1 day−1,
OLR 4 = 4 g VS L−1 day−1. Error bars represent standard deviation (SD, n= 3). Detailed VFA concentration values in SI, Additional file 1: Table S1.
complete experimental time, far below inhibitory levels [26]. Furthermore, this observation is also reflected by constantly high methane productivity at different loading rates (Fig. 2, low-N BM, Table 2).
Since the fermentation of microalgae biomass, gener-ated under nitrogen limited conditions was stable and produced constant amounts of methane, it was inter-esting to evaluate the conversion efficiency level of this process. For this purpose, the theoretical methane poten-tial (TMP) of the biomass was compared to the specific methane productivity reached in the experiments [46]. According to our calculations, the conversion efficiency for low-N biomass to methane reached 84% [calcula-tion specific methane productivity (Table 2) of TMP (Table 1)] for both loading rates (OLR 2 and 4). Hav-ing in mind that approximately 12–15% of the organic matter is used for bacterial growth and maintenance requirements during the anaerobic digestion process [14], and therefore being not available for fermentation to methane. The fermentation of low-N biomass within this study reached almost the maximal capacity and rep-resents the most efficient process so far described in the literature for algal biomass as a mono-substrate [19]. For instance, Samson and colleagues observed maximal methane productivity by digestion of Spirulina maxima
of only 350 mLN g−1 VS day−1, and thus a maximal con-version efficiency of 59%. These results, however, were achieved only under OLR 1 and HRT of 30 days, whereas the productivities decreased significantly when higher loading rates were applied, due to pronounced ammo-nia inhibition [45]. Even lower maximal productivities of only 267 mLN CH4 g−1 VS day−1 (at OLR 4 and HRT of 20 days) were obtained in another recent study using
Spirulina biomass [47]. Similar results could be achieved for green algae biomass in other studies, where only 160 mLN CH4 g−1 VS day−1 could be reached for raw
Chlorella vulgaris biomass, corresponding to 32% con-version efficiency. After thermal pretreatment of the bio-mass, the yield could be increased by 1.5-fold and still reached only 233 mLN CH4 day−1 g−1 VS corresponding to only 49% of TMP (OLR 0.8, HRT 15) [25]. Very low methane productivities of only 70 mLN day−1 g−1 VS were published by Mahdy and co-workers for C. vul-garis, corresponding to only 15% conversion efficiency (OLR 1, HRT 15). Nevertheless, parallel digestion of enzymatically pretreated algae biomass was 2.2 times more efficiently digested and resulted in 196 mLN CH4 day−1 g−1 VS corresponding again to only 49% of TMP (OLR 1, HRT 20) [20]. Moreover, in com-parison to the fermentation performance with microal-gae, the theoretical maximum achieved for macroalgae substrate was in the range of 25–45% [48]. Moreover, the methane productivity from macroalgae fermentation lies
often in the range of less than 300 mL CH4 g−1 VS day−1 [27, 49, 50], which is significantly lower compared to the productivity of 462 mLN CH4 g−1 VS day−1 achieved in this work with microalgae. Apart from the finding that the methane yield from batch experiments with macroal-gae biomass [27] is rather low compared to microalgae, the continuous fermentation under comparable condi-tions (regarding loading rate) seems also to be less effi-cient and sensible towards residual salt content in the biomass due to marine origin [49].
Thus, the biomass-to-methane conversion efficiency of 84% demonstrated within this work by the applica-tion of low-N algae biomass is not only significantly higher compared to other long-term fermentation trails with untreated biomass but also compared to the results achieved after successful pretreatment of microalgae biomass. Furthermore, this efficiency may represent the maximum practically achievable under the AD condi-tions [14]. Considering the energy consumption of micro-bial biomass, the practical efficiency of the fermentation process presented here is at 96–99%, and thus the pro-cess may be described as optimal. Based on these “proof of concept” results, this strategy can also be performed under more applied levels. So for instance, the cultivation of microalgae under non-axenic conditions was tested and revealed rather low/negligible contamination levels due to the nature of the photoautotropic culture media (especially low-N conditions) and no negative effect dur-ing the fermentation process of this biomass could be observed (unpublished observations). Additionally, other more industrially relevant microalgae species can also be tested in continuous fermentation mode, since our pre-vious batch results for Parachlorella kessleri and Scened-esmus obliquus were quite promising, exhibiting very similar properties in terms of C/N ratios and methane yields such as C. reinhardtii [30]. Moreover, to reduce the cultivations costs of the microalgae and to include more positive environmental aspects to the process, wastewa-ter could be used as nutrition source and flue gas (e.g., biogas after combustion) could be integrated as CO2 source in the process [27].
Consequence of the fermentation parameter on the microbial community
were chosen. In all investigated samples, no evidence of eukaryotic plastid 16S rRNA could be found, suggesting that the algal DNA was completely disintegrated dur-ing the anaerobic fermentation. Based on the 16S rRNA gene amplicon database (RDP) [51], the biogas produc-ing microbial community was dominated by Bacteria with 99%, and the Archaea was only represented with approximately 1% (Fig. 4). These findings have previously been reported [52–55], and are in agreement with the fact that bacteria are involved in the first three steps of biomass transformation with a high variety of substrate preferences, and Archaea are restricted to a very narrow substrate spectrum in terms of acetate, methyl-group containing compounds as well as CO2 and H2.
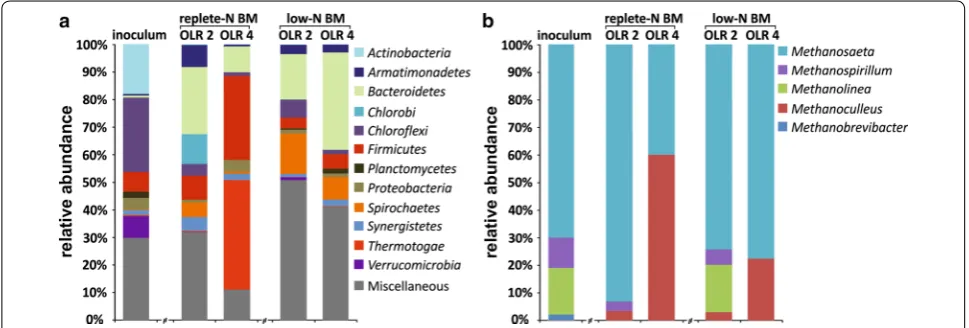
According to The prokaryots [56] and Bergey’s Manual of Systematic Bacteriology [57, 58], all identified bacte-rial community members within the investigated samples are typically involved in the anaerobic degradation of the supplied feedstock as they are described to have cellulo-lytic, saccharocellulo-lytic, glycocellulo-lytic, lipocellulo-lytic, proteolytic and/ or acido-/acetogenic capacities. However, many of the bacterial 16S rRNA amplicon reads (27.26 ± 2.75% for inoculum, 28.94 ± 1.37 and 10.39 ± 0.43% for replete-N BM OLR 2 and OLR 4, as well as 48.01 ± 1.77 and 40.58 ± 1.59% for low-N BM OLR 2 and OLR 4, respec-tively, Fig. 4a) could not be classified at the phylum levels, respectively, confirming that largely bacterial communi-ties in AD reactors remain unknown [59].
The active sludge (inoculum) revealed very high spe-cies diversity comprised 603 ± 52 OTUs (Additional file 1: Table S2). Overall, 73% of the identified sequence reads could be assigned to 18 different phyla, with the most abundant among them the members of the phyla
Chloroflexi (26.78%), Actinobacteria (17.96%), Verru-comicrobia (7.80%) and Firmicutes (7.01%), whereas all other phyla were found only to a minor portion (Fig. 4a). The bacterial diversity dropped significantly during the anaerobic fermentation of algal biomass as mono-sub-strate, cultivated under replete-N and low-N culture conditions and revealed 178 ± 34 and 111 ± 7 OTUs, as well as 269 ± 20 and 177 ± 2 OTUs for OLR2 and OLR4, respectively (Additional file 1: Table S2). This develop-ment indicates that distinct bacteria species begun to dominate due to the selection pressure based on the cer-tain substrate type and amount and other species were extinct. Similar observations were obtained in other studies [60, 61].
Furthermore, in the reactors with no obvious inhibi-tion, the members of the phyla Bacteroidetes became dominant in the AD process, followed by Chlorobi in the digester with replete-N biomass at OLR 2 or Spirochaetes
with low-N biomass at OLR 2 and 4 (Fig. 4a). Interest-ingly, within the phylum Bacteroidetes, mainly three dif-ferent main OTUs were identified (OTU_2, 3 and 26; Additional file 1: Figure S5). OTU_26 is representing the genus Paludibacter of the family Porphyromona-daceae, which was described to ferment various sug-ars to acetate and propionate as the major fermentation products [58], and is mostly abundant in the low-N BM digester with high amount of carbohydrates (Table 1). The phyla Chlorobi is represented by only one member of the genus Ignavibacterium (OTU_36, Additional file 1: Figure S5), which was also described to utilize various carbohydrates [56]. The phyla Spirochaetes mainly con-sists of two OTUs of the order Spirochaetales (OTU_8 and 18, Additional file 1: Figure S4), of which OTU_18
Fig. 4 Bacterial diversity dynamic as assessed by high‑throughput 16S rDNA amplicon sequencing. The data is represented at the phyla level for Bacteria (a) and family level for Archaea (b). The reactors fed with biomass cultivated with replete and low nitrogen content (replete‑N BM and low‑N BM) were exposed to increasing organic loading rates OLR 2 (2 g VS L−1 day−1) and OLR 4 (4 g VS L−1 day−1). The inoculum and the sampling
could be classified to the genus Treponema that utilizes carbohydrates and/or amino acids as carbon and energy source [58]. Interestingly, the digester (replete-N BM, OLR 4), which experienced acidosis because of the high FAN/TAN and VFA concentrations (Fig. 3 replete-N BM), showed a completely different bacterial popula-tion, with the members of phyla Firmicutes and Thermo-togae being the most abundant in this samples (Fig. 4a). Thereby, the Firmicutes were to 70% represented by the genus Sporanaerobacter (OTU_108), and the Thermoto-gae to 99.9% by the species (OTU_125, Additional file 1: Figure S5) similar to Defluviitoga tunisiensis [62]. Spora-naerobacter was described to be able to utilize some sug-ars, peptides and various single amino acids into acetate [57, 63]. Moreover, members of Thermotogae have been characterized for complex polysaccharide fermentation and hydrogen production [62, 64], what might promote beneficial associations with hydrogenotrophic methano-gens [65]. The phyla Bacteroidetes is also present in these samples, however, it is in contrast to the well-performing digesters, mainly represented by other members of the family Porphyromonadaceae (OTU_78 and 111, Addi-tional file 1: Figure S5). The most members of the fam-ily Porphyromonadaceae are primarily described to be weakly saccharolytic in contrast to Paludibacter observed in well-performing digester, since the bacterial growth was not observed to be significantly affected by carbo-hydrates, but is enhanced by protein hydrolysates [58], which is also in agreement with the fact that this digester was fed with protein-rich biomass.
In general, archaeal communities were much less diverse than bacterial ones (Fig. 4a, b), with Methanomi-crobiaceae, Methanobacteriaceae and Methanosaetaceae
being the dominant families. The members of Euryar-chaeota in the inoculum (active sludge of the local waste water treatment plant) are present to 1.18% ± 0.13 and are consistent on the genus level of Methanobrevibacter,
Methanolinea and Methanospirillum and Methanosaeta, with the last being the most abundant of the metha-nogenic community. This finding is also in agreement with the general consideration of the acetoclastic activ-ity being the dominant methanogenic pathway [66, 67]. Distribution, similar to the inoculum, could be observed in the well-performing (replete-N BM OLR 2 and low-N BM OLR 2, 4) digesters, with Methanosaeta sp. repre-senting the most abundant Archaea in the methanogenic community, followed by Methanoculleus sp. and Metha-nospirillum sp. and Methanolinea sp (Fig. 4b). On the other hand, the archaeal community in replete-N BM digester OLR 4 is dominated by Methanoculleus sp. and to lesser extent by Methanosaeta sp., suggesting an appar-ent redirection from the acetoclastic towards hydrog-enotrophic methanogenesis. The increased abundance of
Methanoculleus sp. could possibly be attributable to the sensitivity of acetoclastic Archaea towards volatile fatty acid intoxication (acidosis) and/or higher availability of hydrogen provided by certain bacterial species [68] like the members of the phyla Thermotogae. Similar behav-ior could be also observed in other studies, whereby the authors suggested that the replacement of the domi-nant Methanosaeta sp. by Methanoculleus sp. might be a potential warning indicator of acidosis within the fer-menter [60, 61, 69].
Conclusions
Biogas generation from microalgae biomass has been researched for approximately 60 years with the major outcome that microalgae represent a rather challeng-ing substrate for anaerobic digestion due to high cell wall recalcitrance and unfavorable C/N ratio, owing to its high protein content [18, 19]. The present study investigated the anaerobic digestion from microalgae biomass gener-ated in replete-N as well as naturally occurring (nitrogen limitation, low-N) conditions. The use of algal biomass from replete nitrogen conditions, especially at OLR 4 have led to an inhibition of the digester, caused by high TAN/ FAN and VFA concentrations, and thus to fermentation failure with very low methane productivity. In the failed reactor (replete-N biomass, OLR 4), a clear shift could be observed in the bacterial community to the phyla Firmi-cutes and Thermotogae and archaeal population changed from acetoclastic to hydrogenotrophic methanogenesis.
almost the practically achievable maximum of 96–99%. According to these considerations, algae biomass can be used highly efficiently for AD without any energy or cost intensive pretreatments. Thus, the presented results of the efficient continuous fermentation of low-N biomass are moving the industrial application of biofuel genera-tion from algal biomass in a more economically feasible direction, especially because the generation of algae bio-mass under these conditions saves significantly expensive fertilizers (e.g., nitrogen).
Methods
Strains and growth conditions
Chlamydomonas reinhardtii strain CC-1690 from the Chlamydomonas Center (Duke University, Durham NC, USA) was used for all experiments. Liquid algal cultures were grown photoautotrophically under con-tinuous white light (300 µmol photons m−2 s−1; Osram L 36 W/865, Osram Germany). Cultivations were con-ducted in glass bottles (DURAN®, max. capacity 3.5 L, outer diameter 110 mm and 450 mm high, Schott Ger-many) with 3 L of algae culture, under continuous agita-tion on a magnetic stirrer. Carbon supply was achieved by bubbling with moisture pre-saturated, carbon dioxide-enriched air (3% v/v) with a flow rate of 5 L h−1. Nutrients were provided by a modified Provasoli based minimal medium [70]. For replete nitrogen culture conditions, the following components and concentrations were applied: K2HPO4 0.57 mM; H3BO3 0.16 mM; MgSO4 4.87 mM; KCl 21.46 mM; NaNO3 11.77 mM; CaCl2 * 2H2O 2.72 mM; FeCl3 * 6 H2O 12.2 µM; Na2-EDTA 12.5 µM; EDTA 103 µM; ZnCl2 2.2 µM; MnCl2 * 4H20 16.7 µM; CoCl2 * 6 H2O 50.4 nM; CuCl2 * 2H2O 17.6 nM; Na2MoO4-* 2H2O 24.8 nM. Low-nitrogen cultivation conditions were realized according to previous work [30] by applying a limited amount of nitrogen (3.56 mM NaNO3 equals to 50 mg of nitrogen per liter culture).
Determination of algal biomass concentration
The biomass concentration was determined by centrifu-gation of 15 mL of cell culture (3000×g for 5 min, at least three technical replicates per sample) and drying of the cell pellet in a pre-weighted glass tube at 105 °C for 24 h. To determine the organic biomass fraction, the sample tubes were subsequently incubated at 550 °C for 5 h and the residual ash determined by weighing. The amount of organic biomass (dry weight minus the ash content) was calculated and expressed as volatile solids (VS, g L−1).
Measurement of elemental N and C content in the biomass (C/N ratio)
Total carbon (C) and nitrogen (N) content of the algal biomass was determined via an element analyzer (VARIO
EL III, Elementar Analysesysteme, Hanau, Germany) as described before [71].
Anaerobic fermentation and quantitative biogas measurement
The continuous fermentation of algae biomass was per-formed according to the VDI 4630 guideline [46]. Fer-mentation was performed in B Braun glass fermenters, maximal capacity of 2 L. Fermentation temperature of 38 °C was provided by external tempered water bath via water circulation thought a build-in water jacket in the fermenter. Reactor content was stirred at 100 rpm via slices stirring system (in a 15 min. ON- and 15 min OFF-mode). The digester was operated with 1 L work-ing volume (inoculated with microbial community from anaerobic digester of a local waste water treatment plant Bielefeld–Heepen, Germany) and constant hydraulic retention time (HRT) of 20 days. Feeding/withdraw-ing was performed manually with a syrFeeding/withdraw-inge (first 50 mL rector content out, thereafter 50 mL algae substrate in) daily (despite of semi-continuous feeding mode, the fermentation is designated here, in agreement to VDI guideline [46] as a continuous process). Biogas (water free after condensations column) evolution was meas-ured continuously by a MilliGascounter® (MGC-1 V 3.0, 3, 2 mL, Ritter, Germany) and evaluated by apply-ing RIGAMO Software (Ritter, Germany), followed by normalization of the gas volume to standard tempera-ture of 0 °C. Organic loading rate (OLR) was increased subsequently and simultaneously in both digesters [fed with replete-N and low-N biomass (BM)], from day 0 to 40 (OLR 1 = 1 g VS L−1 day−1), from day 40 to 100 (OLR 2 = 2 g VS L−1 day−1) and from day 100 to 160 (OLR 4 = 4 g VS L−1 day−1). The fresh algal substrate was obtained by centrifugation of the cultures at 3000×g for 5 min and removal of the supernatant. To avoid freezing or drying artifacts, biomass was diluted by addition of H2O to required concentration and stored by 2 °C prior feed (max. 2 weeks long).
Methane content measurement via gas chromatography (GC)
used as the carrier gas and the calibration of the GC was performed with defined gas (Linde, Germany) contain-ing O2(0.103%), H2S(0.208%), H2(0.498%), CH4(59.4%), CO2(34.4%) and N2(5.391%), mixed according to DIN EN ISO 6141.3.
Determination of biomass composition and theoretical methane potential
Determination of lipid fraction was performed in two technical and four biological replicates from 50 mg of lyo-philized biomass each. After homogenization (3 × 30 s at 6500 rpm using a Precellys 24, Peqlab, Erlangen, Ger-many), the total lipid fraction was extracted according to a modified Folch protocol [72] using a total of 4 mL of methanol and 8 mL of chloroform. Contaminants were removed by washing the extract with 3 mL of deion-ized water. After evaporation of solvents under nitrogen atmosphere, lipid fraction was determined via gravi-metrical measurement. The total cellular protein amount was determined using Bio-Rad DC Protein assay (Bio-Rad, CA, USA). The amount of total carbohydrates was determined using the protocol according to Dubios et al. [73]. The theoretical methane potential was calculated in accordance with Buswell equation and empirical for-mula stated by Heaven et al. with TMP`s of 446, 415 and 1014 mLN g−1 VS for proteins, carbohydrates and lipids, respectively. Within the formula P stays for protein, C for carbohydrate and L for lipid content on VS basis.
Determination of the fermentation parameters
Total ammonium nitrogen (TAN) was determined using colorimetric verification via cuvette tests LCK302 (Hach Lange GmbH, Germany). Free ammonia nitrogen (FAN) was calculated from TAN value in respect to tempera-ture and pH according to the formula given by Astals and colleagues [74]. Total organic- and inorganic-carbon (TOC and TIC, respectively) were measured via LCK381, total nitrogen was determined via LCK 338, (Hach Lange GmbH, Germany). The determination of volatile fatty acid (VFA) concentrations was performed via GC-FID analy-sis. Sample preparation was done according to the 5560D procedure [75] and analyzed using a Shimadzu GC-2010 plus Gas Chromatograph equipped with a Macherey– Nagel OPTIMA® FFAPplus (Length: 30 m, inner diam-eter: 0.25 mm) column (Macherey–Nagel, Germany) and coupled to an FID detector (supplied with H2 and
TMP
mLNg−1VS
=
P%
(P%+C%+L%) ×446
+
C%
(P%+C%+L%) ×415
+
L%
(P%+C%+L%) ×1014
.
synthetic air). Analysis was performed under constant pressure of 231.9 kPa with He as carrier gas and N2 as makeup gas with constant flow rate of 60 cm s−1. Column temperature in the first 2 min was at 100 °C with follow-ing linear increase to 175 °C within 15 min. VFA-Mix standard (46975-U, Supelco Analytical, Sigma-Aldrich, USA) at concentrations of 0.1, 1 and 10 mM was used for calibration.
Microbial monitoring by high‑throughput 16S rRNA amplicon sequencing
Genomic DNA was extracted as previously described by Zhou et al. [76]. For the determination of the taxo-nomic profile of the biogas community, high-throughput sequencing of the hypervariable V3–V4 regions of the 16S rRNA gene was performed on the Illumina MiSeq system by applying the paired-end protocol, accord-ing to the manufacturer’s instructions and usaccord-ing of the Illumina recommended gene specific primer sequences [77]. For the data processing and analysis, an amplicon analysis pipeline was used as recently described [59, 78]. Briefly, raw sequences were merged by FLASH [79] and further processed and analyzed using the UPARSE pipe-line [80] based on Usearch 8.0 [81] with default settings. Processed operational taxonomic units (OTU) were taxo-nomically classified using the RDP classifier 2.7 [51].
Additional file
Additional file 1: Figure S1. Methane concentration in the biogas, produced during the fermentation of replete‑N and low‑N algae biomass (replete‑N BM and low‑N BM, respectlively). Statistics: two‑sample t‑test with 95% confidence interval. Figure S2. Concentration of total carbon and nitrogen during the experimental time course in replete‑N BM digester (A) and low‑N BM digester (B). Concentration of total organic and inorganic carbon (TOC and TIC) is shown for replete‑N BM digester (C) and low‑N BM digester (D). Measurements were performed in three replicates; error bars represent standard deviation (SD). Figure S3.
Concentration of volatile and total solids (VS and TS, respectively) during the experimental time course in replete‑N BM digester (A) and low‑N BM digester (B). Measurements were performed in at least three replicates; error bars represent standard deviation (SD). Figure S4. Concentration of chemical oxygen demand (COD) during the experimental time course in replete‑N BM digester (A) and low‑N BM digester (B). Measurements were performed in three technical replicates; error bars represent standard deviation (SD). Figure S5. Bacterial diversity dynamics as assessed by high‑throughput 16S rRNA amplicon sequencing and represented at the OTU level. The reactors, fed with biomass cultivated in media with replete and low nitrogen content (replete‑N BM and low‑N BM) were exposed to increasing organic loading rates of 2 and 4 g VS L‑1 d‑1 (OLR 2 and OLR 4, respectively). The inoculum and the sampling periods at the end of each OLR were chosen for microbial community monitoring. Table S1.
Abbreviations
AD: anaerobic digestion; C/N: carbon‑to‑nitrogen ratio; DW: dry weight; BM: biomass; SE: standard error; SD: standard deviation; FAN: free ammonia nitro‑ gen; TAN: total ammonium nitrogen; OLR: organic loading rate; HRT: hydraulic retention time; VFA: volatile fatty acids; C: carbon; N: nitrogen; TMP: theoretical methane potential; VS: volatile solids.
Authors’ contributions
VK, OBK and OK designed the experiments; VK performed algae biomass cul‑ tivation and fermentation with all concomitant measurements; OBK and AW preformed 16S rDNA amplicon sequencing, DW performed the bioinformatic analysis; interpretation and visualization of all data was done by VK and OBK; VK, OBK, CP, JK and OK wrote and edited the manuscript. All authors read and approved the final manuscript.
Author details
1 Department of Biology/Center for Biotechnology (CeBiTec), Bielefeld University, Universitätsstrasse 27, 33615 Bielefeld, Germany. 2 Institute of Life Science Engineering (KIT), Bioprocess Engineering, University of Karlsruhe, Fritz‑Haber‑Weg 2, 76131 Karlsruhe, Germany.
Acknowledgements
OK and VK gratefully acknowledge the Deutsche Forschungsgemeinschaft [DFG Grant No. KR 1586/7‑1] and DW the “Bielefeld‑Gießen Resource Center for Microbial Bioinformatics”—BiGi [BMBF Grant No. 031A533] for support. The authors would like to thank Swapnil Chaudhari for providing technical assistance for lipid extraction.
Competing interests
VK, OBK and OK are inventors of a EP‑Patent application (No. 17152658.5— 1501, applicant Universität Bielefeld). The authors declare that they have no further/other competing interests.
Availability of supporting data
The 16S rRNA amplicon sequencing data obtained in this study have been deposited to the European Nucleotide Archive (ENA) and are available under the project Accession Number PRJEB12949 (http://www.ebi.ac.uk/ena/data/ view/PRJEB12949).
Publisher’s Note
Springer Nature remains neutral with regard to jurisdictional claims in pub‑ lished maps and institutional affiliations.
Received: 19 April 2017 Accepted: 10 July 2017
References
1. Martinot E, Dienst C, Weiliang L, Qimin C. Renewable energy futures: tar‑ gets, scenarios, and pathways. Annu Rev Environ Resour. 2007;32:205–39. 2. REN21. Renewables 2015 global status Report. REN21 renewables. Paris; 2015. 3. Stephens E, Ross IL, King Z, Mussgnug JH, Kruse O, Posten C, et al. An eco‑
nomic and technical evaluation of microalgal biofuels. Nat Biotechnol. 2010;28:126–8.
4. Borowitzka MA, Moheimani NR. Algae for biofuels and energy. Berlin: Springer; 2013.
5. Formighieri C. Solar‑to‑fuel conversion in algae and cyanobacteria. 1st ed. Cham: Springer International Publishing; 2015. http://dx.doi. org/10.1007/978‑3‑319‑16730‑5_2.
6. Brennan L, Owende P. Biofuels from microalgae‑A review of technologies for production, processing, and extractions of biofuels and co‑products. Renew Sustain Energy Rev. 2010;14(2):557–77.
7. Kruse O, Hankamer B. Microalgal hydrogen production. Curr Opin Bio‑ technol. 2010;21(3):238–43.
8. Grewe S, Ballottari M, Alcocer M, D’Andrea C, Blifernez‑Klassen O, Hankamer B, et al. Light‑harvesting complex protein LHCBM9 is critical for photosystem II activity and hydrogen production in Chlamydomonas reinhardtii. Plant Cell. 2014; 26: 1598–611. http://www.ncbi.nlm.nih.gov/pubmed/24706511.
9. Georgianna DR, Mayfield SP. Exploiting diversity and synthetic biology for the production of algal biofuels. Nature. 2012; 488: 329–35. http://www. nature.com/doifinder/10.1038/nature11479.
10. Hallmann A, Hallman A. Algal transgenics and biotechnology. Transgenic Plant J. 2007; 1: 81–98. http://www.uni‑bielefeld.de/biologie/Zellbiologie/ publik/paper/2007tpj.pdf.
11. Chisti Y. Raceways‑based production of algal crude oil. Green. 2013;3:195–216.
12. Wolf J, Stephens E, Steinbusch S, Yarnold J, Ross IL, Steinweg C, et al. Multifactorial comparison of photobioreactor geometries in parallel microalgae cultivations. Algal Res. 2016;15:187–201.
13. Bux F, Chisti Y, editors. Algae biotechnology: products and processes. Cham: Springer International Publishing; 2016.
14. Raposo F, Fernández‑Cegrí V, De la Rubia MA, Borja R, Béline F, Cavinato C, et al. Biochemical methane potential (BMP) of solid organic substrates: evaluation of anaerobic biodegradability using data from an international interlaboratory study. J Chem Technol Biotechnol. 2011;86:1088–98. 15. Weiland P. Biogas production: current state and perspectives. Appl Micro‑
biol Biotechnol. 2010;85(4):849–60.
16. Thi NBD, Sen B, Chen CC, Kumar G, Lin CY. Food waste to bioenergy via anaerobic processes. Energy Procedia. 2014;61:307–12.
17. Thi NBD, Lin C‑Y, Kumar G. Waste‑to‑wealth for valorization of food waste to hydrogen and methane towards creating a sustainable ideal source of bioenergy. J Clean Prod Elsevier. 2016;122:29–41.
18. Golueke CG, Oswald WJ, Gotaas HB. Anaerobic digestion of Algae. Appl Microbiol. 1957;5:47–55.
19. Klassen V, Blifernez‑Klassen O, Wobbe L, Schlüter A, Kruse O, Mussgnug JH. Efficiency and biotechnological aspects of biogas production from microalgal substrates. J Biotechnol. 2016;234:7–26.
20. Mahdy A, Mendez L, Ballesteros M, González‑Fernández C. Protease pretreated Chlorella vulgaris biomass bioconversion to methane via semi‑ continuous anaerobic digestion. Fuel. 2015;158:35–41.
21. Mahdy A, Mendez L, Ballesteros M, González‑Fernández C. Autohydrolysis and alkaline pretreatment effect on Chlorella vulgaris and Scenedesmus sp. methane production. Energy. 2014;78:48–52.
22. Marsolek MD, Kendall E, Thompson PL, Shuman TR. Thermal pretreatment of algae for anaerobic digestion. Bioresour Technol. 2014;151:373–7. 23. Mendez L, Mahdy A, Demuez M, Ballesteros M, González‑Fernández C. Effect
of high pressure thermal pretreatment on Chlorella vulgaris biomass: organic matter solubilisation and biochemical methane potential. Fuel. 2014;117:674–9. 24. Schwede S, Rehman ZU, Gerber M, Theiss C, Span R. Effects of thermal
pretreatment on anaerobic digestion of Nannochloropsis salina biomass. Bioresour Technol. 2013;143:505–11.
25. Mendez L, Mahdy A, Ballesteros M, González‑Fernández C. Biomethane production using fresh and thermally pretreated Chlorella vulgaris bio‑ mass: a comparison of batch and semi‑continuous feeding mode. Ecol Eng. 2015;84:273–7.
26. Yenigün O, Demirel B. Ammonia inhibition in anaerobic digestion: a review. Process Biochem. 2013;48(5):901–11.
27. Dȩbowski M, Zieliński M, Grala A, Dudek M. Algae biomass as an alterna‑ tive substrate in biogas production technologies—Review. Renew Sustain Energy Rev. 2013;27:596–604.
28. Zhen G, Lu X, Kobayashi T, Kumar G, Xu K. Anaerobic co‑digestion on improving methane production from mixed microalgae (Scenedesmus sp., Chlorella sp.) and food waste: kinetic modeling and synergistic impact evaluation. Chem Eng J. 2016;299:332–41.
29. Markou G, Angelidaki I, Georgakakis D. Carbohydrate‑enriched cyano‑ bacterial biomass as feedstock for bio‑methane production through anaerobic digestion. Fuel. 2013;111:872–9.
30. Klassen V, Blifernez‑Klassen O, Hoekzema Y, Mussgnug JH, Kruse O. A novel one‑stage cultivation/fermentation strategy for improved biogas production with microalgal biomass. J Biotechnol. 2015;215:44–51. 31. Speece RE. Anaerobic biotechnology for industrial wastewater treatment.
Environ Sci Technol. 1983;17:416A–27A.
32. Gruber‑Brunhumer MR, Jerney J, Zohar E, Nussbaumer M, Hieger C, Boch‑ mann G, et al. Acutodesmus obliquus as a benchmark strain for evaluat‑ ing methane production from microalgae: influence of different storage and pretreatment methods on biogas yield. Algal Res. 2015;12:230–8. 33. Mussgnug JH, Klassen V, Schlüter A, Kruse O. Microalgae as substrates for
34. Bogen C, Al‑Dilaimi A, Albersmeier A, Wichmann J, Grundmann M, Rupp O, et al. Reconstruction of the lipid metabolism for the microalga Mono‑ raphidium neglectum from its genome sequence reveals characteristics suitable for biofuel production. BMC Genom. 2013;14:926.
35. Li Y, Han D, Hu G, Sommerfeld M, Hu Q. Inhibition of starch synthesis results in overproduction of lipids in Chlamydomonas reinhardtii. Biotech‑ nol Bioeng. 2010;107:258–68.
36. Symons GE, Buswell AM. The methane fermentation of carbohydrates. J Am Chem Soc. 1933;55:2028–36.
37. Heaven S, Milledge J, Zhang Y. Comments on “Anaerobic digestion of microalgae as a necessary step to make microalgal biodiesel sustainable”. Biotechnol Adv. 2011;29:164–7.
38. Bohutskyi P, Bouwer E. Biogas production from algae and cyanobacteria through anaerobic digestion: a review, analysis, and research needs. In: Lee JW, editor. Adv biofuels Bioprod. New York: Springer; 2013. p. 873–975.
39. Zubr J. Methanogenic fermentation of fresh and ensiled plant materials. Biomass. 1986;11:159–71.
40. Braun R. Biogas‑Methangärung organischer Abfallstoffe. Wien: Springer; 1982.
41. Mähnert P, Linke B. Kinetic study of biogas production from energy crops and animal waste slurry: effect of organic loading rate and reactor size. Environ Technol. 2009;30:93–9.
42. Orris EA. Ammonia nitrogen and the anaerobic environment on JSTOR. Water Pollut Control Fed. 1961;33:978–95.
43. Melbinger NR, Donnellon J, Zablatzky HR. Toxic effects of ammonia nitro‑ gen in high‑rate digestion. Water Pollut Control Fed. 1971;43:1658–70. 44. Jegede Abiodun. Anaerobic digestion of cyanobacteria and chlorella to
produce methane for biofuel. Int J Agric Biol Eng. 2012;5:68–74. 45. Samson R, LeDuy A. Detailed study of anaerobic digestion of Spirulina
maxima algal biomass. Biotechnol Bioeng. 1986;28:1014–23. 46. VDI 4630. Fermentation of Organic Compounds. Düsseldorf: Verein
Deutscher Ingenieure, VDI Handbook; 2006. p. 1–93.
47. Nolla‑Ardèvol V, Strous M, Tegetmeyer HE. Anaerobic digestion of the microalga Spirulina at extreme alkaline conditions: biogas production, metagenome, and metatranscriptome. Front Microbiol. 2015;6:597. 48. Wise DL, Augenstein DC, Ryther JH. Methane fermentation of aquatic
biomass. Resour Recover Conserv. 1979;4:217–37.
49. Sun MT, Fan XL, Zhao XX, Fu SF, He S, Manasa MRK, et al. Effects of organic loading rate on biogas production from macroalgae: Performance and microbial community structure. Bioresour Technol. 2017; 235: 292–300. http://linkinghub.elsevier.com/retrieve/pii/S0960852417303474. 50. Vergara‑Fernández A, Vargas G, Alarcón N, Velasco A. Evaluation of marine
algae as a source of biogas in a two‑stage anaerobic reactor system. Biomass Bioenerg. 2008;32:338–44.
51. Wang Q, Garrity GM, Tiedje JM, Cole JR. Naive Bayesian classifier for rapid assignment of rRNA sequences into the new bacterial taxonomy. Appl Environ Microbiol. 2007;73:5261–7.
52. Carballa M, Smits M, Etchebehere C, Boon N, Verstraete W. Correlations between molecular and operational parameters in continuous lab‑scale anaerobic reactors. Appl Microbiol Biotechnol. 2011;89:303–14. 53. Liu FH, Wang SB, Zhang JS, Zhang J, Yan X, Zhou HK, et al. The structure
of the bacterial and archaeal community in a biogas digester as revealed by denaturing gradient gel electrophoresis and 16S rDNA sequencing analysis. J Appl Microbiol. 2009;106:952–66.
54. Regueiro L, Veiga P, Figueroa M, Alonso‑Gutierrez J, Stams AJM, Lema JM, et al. Relationship between microbial activity and microbial com‑ munity structure in six full‑scale anaerobic digesters. Microbiol Res. 2012;167:581–9.
55. Sundberg C, Al‑Soud WA, Larsson M, Alm E, Yekta SS, Svensson BH, et al. 454 pyrosequencing analyses of bacterial and archaeal richness in 21 full‑scale biogas digesters. FEMS Microbiol Ecol. 2013;85:612–26. 56. Rosenberg E, De Long EF, Lory S, Stackebrandt E, Thompson F, editors.
The prokaryotes. 4th ed. Berlin Heidelberg: Springer; 2014. 57. Vos P, Garrity G, Jones D, Krieg N, Ludwig W, Rainey FA, et al., editors.
Bergey’s manual of systematic bacteriology, vol. 3. 2nd ed. New York: Springer; 2009.
58. Krieg NR, Ludwig W, Whitman WB, Hedlund BP, Paster BJ, Staley JT, et al., editors. Bergey’s manual of systematic bacteriology, vol. 4. 2nd ed. New York: Springer; 2010.
59. Theuerl S, Kohrs F, Benndorf D, Maus I, Wibberg D, Schlueter A, et al. Com‑ munity shifts in a well‑operating agricultural biogas plant: how process variations are handled by the microbiome. Appl Microbiol Biotechnol. 2015;99:7791–803.
60. Blume F, Bergmann I, Nettmann E, Schelle H, Rehde G, Mundt K, et al. Methanogenic population dynamics during semi‑continuous biogas fermentation and acidification by overloading. J Appl Microbiol. 2010;109:441–50.
61. Carballa M, Regueiro L, Lema JM. Microbial management of anaerobic digestion: Exploiting the microbiome‑functionality nexus. Curr. Opin. Biotechnol. 2015;33:103–11.
62. Maus I, Cibis KG, Wibberg D, Winkler A, Stolze Y, König H, et al. Complete genome sequence of the strain Defluviitoga tunisiensis L3, isolated from a thermophilic, production‑scale biogas plant. J Biotechnol. 2015;203:17–8.
63. Hernandez‑Eugenio G, Fardeau ML, Cayol JL, Patel BKC, Thomas P, Macarie H, et al. Sporanaerobacter acetigenes gen. nov., sp. nov., a novel ace‑ togenic, facultatively sulfur‑reducing bacterium. Int J Syst Evol Microbiol. 2002;52:1217–23.
64. Conners SB, Mongodin EF, Johnson MR, Montero CI, Nelson KE, Kelly RM. Microbial biochemistry, physiology, and biotechnology of hyperthermo‑ philic Thermotoga species. FEMS Microbiol Rev. 2006;30:872–905. 65. Muralidharan V, Rinker KD, Hirsh IS, Bouwer EJ, Kelly RM. Hydrogen trans‑
fer between methanogens and fermentative heterotrophs in hyperther‑ mophilic cocultures. Biotechnol Bioeng. 1997;56:268–78.
66. Gujer W, Zehnder AJ. Conversion processes in anaerobic digestion. Water Sci Technol. 1983;15:127–67.
67. Pavlostathis SG, Giraldo‑Gomez E. Kinetics of anaerobic treatment—a critical review. CRC Crit Rev Environ Control. 1991;21:411–90. 68. Karakashev D, Batstone DJ, Trably E, Angelidaki I. Acetate oxidation is
the dominant methanogenic pathway from acetate in the absence of Methanosaetaceae. Appl Environ Microbiol. 2006;72:5138–41. 69. Goux X, Calusinska M, Lemaigre S, Marynowska M, Klocke M, Udelhoven
T, et al. Microbial community dynamics in replicate anaerobic digesters exposed sequentially to increasing organic loading rate, acidosis, and process recovery. Biotechnol Biofuels. 2015;8:122.
70. Provasoli L, McLaughlin JJ, Droop MR. The development of artificial media for marine algae. Arch Mikrobiol. 1957;25:392–428.
71. Platner C, Piñol J, Sanders D, Espadaler X. Trophic diversity in a Mediter‑ ranean food web‑Stable isotope analysis of an ant community of an organic citrus grove. Basic Appl Ecol. 2012;13:587–96.
72. Folch J, Lees M, Stanley GHS. A simple method for the isolation and purifi‑ cation of total lipids from animal tissues. J Biol Chem. 1957;226:497–509. 73. DuBois M, Giles KA, Hamilton JK, Rebers PA, Smith F. Colorimetric
method for determination of sugars and related substances. Anal Chem. 1956;28:350–6.
74. Astals S, Nolla‑Ardèvol V, Mata‑Alvarez J. Anaerobic co‑digestion of pig manure and crude glycerol at mesophilic conditions: biogas and diges‑ tate. Bioresour Technol. 2012;110:63–70.
75. Clescerl LS, Greenberg AE, Eaton AD. Organic and volatile acids. In: Clescerl LS, Greenberg AE, Eaton AD, editors. Stand. Methods Exam. Water Wastewater. 20th ed. Baltimore: American Public Health Association, American Water Works Association, Water Environment Federation; 1999. p. 1325.
76. Zhou J, Bruns MA, Tiedje JM. DNA recovery from soils of diverse composi‑ tion. Appl Environ Microbiol. 1996;62:316–22.
77. Klindworth A, Pruesse E, Schweer T, Peplies J, Quast C, Horn M, et al. Evaluation of general 16S ribosomal RNA gene PCR primers for classical and next‑generation sequencing‑based diversity studies. Nucleic Acids Res. 2013;41:e1.
78. Liebe S, Wibberg D, Winkler A, Puehler A, Schlueter A, Varrelmann M. Taxo‑ nomic analysis of the microbial community in stored sugar beets using high‑throughput sequencing of different marker genes. FEMS Microbiol Ecol. 2016;92:1–12.
79. Magoč T, Salzberg SL. FLASH: fast length adjustment of short reads to improve genome assemblies. Bioinformatics. 2011;27:2957–63. 80. Edgar RC. UPARSE: highly accurate OTU sequences from microbial ampli‑
con reads. Nat Methods. 2013;10:996–8.