© 2014 Carmen Silvia Kira et al. This is an open access article distributed under the terms of the Creative Commons Attribution License -NonCommercial-ShareAlikeUnported License (http://creativecommons.org/licenses/by-nc-sa/3.0/).
Journal of Applied Pharmaceutical Science Vol. 4 (05), pp. 039-045, May, 2014 Available online at http://www.japsonline.com
DOI: 10.7324/JAPS.2014.40507 ISSN 2231-3354
Fast and simple multi-element determination of essential and toxic
metals in whole blood with quadrupole ICP-MS
Carmen Silvia Kira
1*, Alice Momoyo Sakuma
2, Nelson da Cruz Gouveia
31
Food Center, Instituto Adolfo Lutz – Av. Dr. Arnaldo, 355, CEP 01246-902, São Paulo, SP, Brazil, 2 Reference Materials Center, Instituto Adolfo Lutz – Av. Dr. Arnaldo, 355, CEP 01246-902, São Paulo, SP, Brazil, 3 Departament of Preventive Medicine, Faculty of Medicine, University of São Paulo - Av. Dr. Arnaldo, 455, CEP 01246-903, São Paulo, SP, Brazil.
ARTICLE INFO ABSTRACT
Article history:
Received on: 02/04/2014 Revised on: 23/04/2014 Accepted on: 14/05/2014 Available online: 27/05/2014
The development of reliable and sensitive methods for elements quantification in low-level concentration is a necessary requirement to detect increases or deficiencies considered unusual in human body. In this sense the sensitivity and selectivity of mass spectrometric methods are particularly appropriate to deal with this issue since many elements in biological material are at extremely low concentration levels and necessity to be monitored. Simultaneous determination of Be, Bi, Ba, Pb, Pd, Pt, Rh, Ni, V, Cr, Mn, As, Cd, Mo, Co, Hg, Tl, Sr, Sb, Se, Cu and Zn in whole blood by ICP-MS is described. Sample preparation consisted of a simple dilution (twenty-fold) with 0.05% Triton X-100 in 0.2% HNO3. The method proved to be accurate (accuracy ranged from 88.9% to 108%), precise (CV was below 5% for all elements) and sensitive (LOQ were below 1 µg L-1 for most of the studied elements). Use of DRC was only necessary for chromium and vanadium determination in blood. The proposed method uses low quantities of blood and this feature is essential when analyzes involve human biological samples. The obtained results show the applicability of the developed methodology for the rapid, sensitive and simultaneous determination of inorganic constituents in whole blood.
Key words:
Inductively coupled plasma mass spectrometry; ICP-MS; Whole blood; Metals; Validation method.
INTRODUCTION
Technological development has been reflected in the increase of xenobiotics in the environment. Therefore differences between occupational and environmental exposure are becoming
significantly smaller (Paoliello et al., 1997). This fact contributes
and accentuates the necessity to monitore that aim to identify exposure sources and assess the exposure distribution in the
general population (Kuno et al., 2010; Heitland and Kӧster, 2004).
Biomonitoring then becomes an important tool to estimate human exposure to contaminants and their concentrations in the blood is
generally used as a biomarker (Barbosa Jr, 2005; Needham et al.,
2007; Palmer et al., 2006; Apostoli, 2002). This implies in an
increasing necessity of more sensitive and especially faster
methods with minimal sample handling. In the past many determinations were correlated to monoelemental analyzes such as lead or cadmium in whole blood, but currently multielement methods in biological material became more common due to
.
.
* Corresponding Author Dr. Carmen Silvia Kira, Email:carmenkira@gmail.com
technological advances. In this sense inductively coupled plasma mass spectrometry (ICP-MS) a multi-element technique
with appropriate sensitivity is progressively replacing
conventional techniques as atomic absorption or electrochemical
methods (Fong et al., 2007; D’Ilio et al., 2008; Goullé et al., 2005;
Zhou et al., 2002). Although these techniques may achieve the
required sensitivity to determine elements at trace levels, they are lacking in speed and ease to use. ICP-MS could be very useful for a wide range of clinical applications because the great sensitivity acquired in this technique with low detection limits enabling toxicologists to sufficiently estimate the toxic levels and environmental metal exposure (Parsons and Barbosa Jr, 2007;
Ammann, 2007; D’Ilio et al., 2006; Bárany et al., 1997; Rivero
Martino et al., 2000; Sariego Muñiz et al., 1999). Furthermore, this
method offers new possibilities in several fields such as clinical chemistry, clinical toxicology, forensic toxicology as well as workplace testing or environmental exposure and also applicable in
epidemiological studies (Bortoli et al., 1992).The development of
In this sense the sensitivity and selectivity of mass spectrometric methods are particularly appropriate to deal with this issue since many elements in biological material are at extremely low
concentration levels and necessityto be monitored.
Some of the elements addressed in this study exhibit an essential role in the biological system, while others may have toxic effects when present in high concentrations or even have no known biological function, but they might be related to some
diseases or illness (Apostoli, 2002; Bazzi et al., 2008).
In the case of Pt, Pd and Rh their occurrence in the environment is increasing, primarily due to its use in catalytic
converters for motor vehicles (Ek et al., 2004). Thus, the
assessment of health risks posed by human exposure to these elements has gained interest.
The suggested method has few steps of preparation, is fast, sensitive and allows the simultaneous determination of several elements in whole blood. Existing methods in the literature usually use Rh and Bi as internal standards. Thus we propose a method with other internal standards since these elements were targets to be determined.
The aim of this study is to propose a method for the simultaneous determination of nutrient and toxic elements in whole blood by ICP-MS.
MATERIAL AND METHODS
Material
The measurements were carried out using a Perkin Elmer DRC II mass spectrometer (Norwalk, CT, USA). The ICP mass spectrometer was equipped with an AS-93 plus auto sampler besides a quartz cyclonic spray chamber, quartz bore injector and a Meinhard concentric nebulizer for sample introduction. The main operating conditions are listed in Table 1.
Table. 1: ICP-MS operating conditions.
Plasma power (W) 1400
Nebulizer gas flow rate (L. min-1) 0.98 Auxiliary gas flow rate (L. min-1) 1.05
Plasma gas flow rate (L. min-1) 15
Integration 16 sweeps, 3 replicates
Scan mode Peak hopping
Read delay (s) 15
Sample time (min) Standard mode
DRC mode
Reaction gas
RPq Cell gas A
2.37
9
Be, 55Mn, 59Co, 60Ni, 65Cu, 66Zn,
68
Zn, 75As, 77Se, 78Se, 82Se, 88Sr,
98
Mo, 103Rh, 105Pd, 106Pd, 108Pd,
111
Cd, 112Cd, 114Cd, 121Sb, 123Sb,
194
Pt, 195Pt, 196Pt, 202Hg, 203Tl,
206
Pb, 207Pb, 208Pb, 209Bi, 138Ba,
135
Ba, 137Ba, 52Cr, 51V
51
V, 52Cr Ammnonia (NH3)
0.7 0.8
Daily performance was assessed (Mg intensity > 6000 counts s-1,
In intensity > 30000 counts s-1, and U intensity > 20000 counts s-1
for 1 µg L-1 concentration, with the CeO+/Ce+ and Ba2+/Ba+ ratios
< 3%). A mixed solution of internal standards (5 µg L-1 Ge, Re, In,
Sc in 0.2% v/v nitric acid) and a solution of 200 µg L-1 of gold (in
0.2% v/v nitric acid) were aspirated separately by a second channel of peristaltic pump allowing on-line addition to standard and sample solutions. Sample or standards and internal standards flows were joined and mixed together before the nebulizer using a
connector. Six milliliters Vacuette® tubes with royal blue cap to
trace elements were used for blood collection (NH Trace Elements Sodium Heparin).
Calibration standards from multi-element stock solution and sample dilutions were prepared in an ISO class 7 clean room equipped with laminar flow ISO class 5 (ISO, 1999). In order to
minimize contamination risks, polymethylpentene (PMP)
volumetric flasks, polyethylene tubes and beakers were soaked overnight in 20% (v/v) nitric acid followed by rinsing with demineralized water and dried.
Reagents
Water used (specific resistance 18.2 MΩ cm-1) was
supplied by a Milli- Q Academic purification system (Millipore,
USA). Suprapur® nitric acid 65%, triton X-100 and stock standard
solutions of Be, Mn, Ni, As, Se, Cd, Tl, Pb, Bi, Ba, Cr, Se and Au
(1000 µg.mL-1) were from Merck (Darmstadt, Germany). Stock
standard solutions of Re, Cu, Zn, Sr, Mo, Rh, Pd, Sb, Pt, Hg and V
(1000 µg.mL-1) were obtained from Spex CertiPrep. Stock
standard solutions of Ge and In (10 µg.mL-1) were from Spex
CertiPrep. Stock standard solution of Sc (1000 µg.mL-1) was from
Sigma Aldrich.
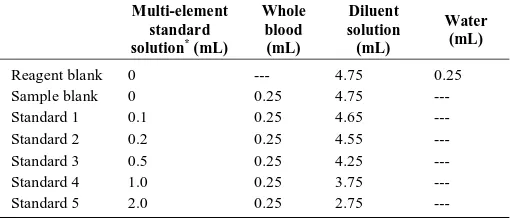
A pool of human whole blood was used as base blood for matrix-matching calibration. Blood samples, were collected into tubes (Vacuette) containing sodium heparinate, to prevent coagulation, then transferred into a 50 mL polyethylene tube to make a pool and kept at 4 ºC. The calibration curve preparation is illustrated in Table 2.
Table. 2: Calibration curve preparation. Multi-element
standard solution* (mL)
Whole blood (mL)
Diluent solution (mL)
Water (mL)
Reagent blank 0 --- 4.75 0.25
Sample blank 0 0.25 4.75 ---
Standard 1 0.1 0.25 4.65 ---
Standard 2 0.2 0.25 4.55 ---
Standard 3 0.5 0.25 4.25 ---
Standard 4 1.0 0.25 3.75 ---
Standard 5 2.0 0.25 2.75 ---
*Multi-element standard solution containing: Be, Mn, Co, Ni, Cu, Zn, As, Se, Sr, Mo, Rh, Pd, Cd, Sb, Pt, Hg, Tl, Pb, Bi, Ba, Cr and V
Calibration standards were matrix-matched and were prepared in a
diluent solution (0.05% (v/v) Triton X 100 in 0.2% (v/v) HNO3)
Table. 3: Concentrations of the elements in calibration curve (in ug L-1).
Elements Std 1
(ug L-1)
Std 2
(ug L-1)
Std 3
(ug L-1)
Std 4
(ug L-1)
Std 5
(ug L-1)
Be, Sr, Rh, Pd, Sb, Pt, Tl, Pb, Bi, Ba
1 2 5 10 20
Ni, V, Cr 2 4 10 20 40
Mn, Co, As, Mo,
Cd 0.5 1 2.5 5 10
Se, Cu 10 20 50 100 200
Hg 0.2 0.4 1 2 4
Zn 50 100 250 500 1000
Sample preparation
Blood samples was left at room temperature and mixed well for a few minutes to homogenize with a vortex mixer. After homogenization, 0.25 mL of whole blood was accurately transferred into a 15 mL polyethylene tube with 4.55 mL of diluent
solution (0.05% (v/v) Triton X-100 + 0.2% (v/v) HNO3, mixed on
a vortex mixer) following addition of 0.2 mL multi-element standard solution that corresponds to the second point of calibration curve. Samples were then thoroughly mixed.
RESULTS AND DISCUSSION
Selection of the internal standard
In ICP-MS the internal standard element should not be present in the samples and should be added to all blanks, standards and samples in equal concentrations. The behavior of the internal standard elements in the plasma is dependent on atomic mass and ionization efficiency. Internal standards are used to correct variations in signal intensity due to instrument instability and non-spectral interferences (suppression or enhancement of the signal
caused by the matrix) (Vanhaecke et al., 1992; Paquette et al.,
2010). Exisiting methods in literature for the determination of trace elements in biological materials have used rhodium or bismuth as internal standards. Selection of different internal standards was proposed in this study since Rh and Bi were one of the target elements to be analyzed. Internal standards were selected
based ontheir performance regarding to precision and accuracy for
elements determination in whole blood samples unspiked and spiked in concentrations equivalent to the first and second point of the calibration curve. Ge, Re, In and Sc were selected as internal
standard. Concentrations of 5 µg L-1 and 40 µg L-1 of internal
standards were tested and best results were obtained with
concentration of 5 µg L-1, which was chosen. Althoug 45Sc has no
mass number close to beryllium it worked as well as internal
standard. In addition, 45Sc has been used as internal standard
element for the low-mass regions (mass range: 6-70) (De Boer et
al., 2004).
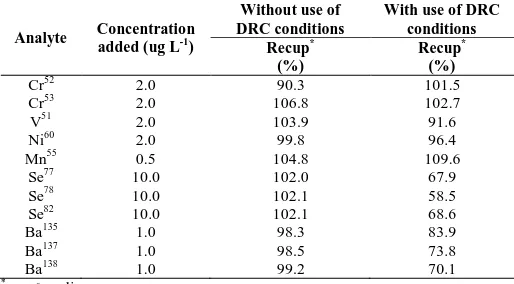
Optimization of Dinamic Reaction Cell (DRC) operating conditions
Use of Dinamic Reaction Cell (DRC) was preliminary tested for chromium, vanadium, nickel, manganese, selenium, barium, copper and zinc. DRC operating conditions (optimization
of NH3 flow rate and Rejection Parameter q (RPq parameter) were
determined by scanning the ion signal for various rejection
parameter q (RPq) settings and cell gas in blood sample unspiked
and blood sample spiked with 2 µg L-1 of chromium, vanadium
and nickel, 0.5 µg L-1 of manganese, 10 µg L-1 of selenium, 1 µg
L-1 of barium, 10 µg L-1 of copper and 50 µg L-1 of zinc. NH3 flow
rate was varied in the range of 0.1 – 1 mL min-1 in steps of 0.1 mL
min-1, and RPq was varied in the range of 0.45 - 0.8 in steps of
0.05. For Cu65, Zn66 and Zn68 background equivalent
concentrations (BEC) were higher than 5 µg L-1 and sensitivities
were very low (intensity signal of 200 cps) in various RPq settings and ammonia flow rates as described above. Thus, the bandpass settings were not optimized for these isotopes. The lower background equivalent concentrations (BEC) were achieved for
NH3 flow rate of 0.8 mL min
-1
for V, Cr and Ni and 0.6 mL min-1
for Mn, Se and Ba. The maximum ratio of the intensity of signal
per background could be obtained with RPq values of 0.7 for V51,
Cr52, Ba135 and Ba138, 0.6 for Cr53, 0.75 for Ni60, Se78 and Se82, 0.45
for Mn55, 0.55 for Se77 and 0.65 for Ba137. To evaluate the DRC
performance for determination of V, Cr, Ba, Ni, Se and Mn, blood
samples were fortified with 2 µg L-1 of chromium, vanadium and
nickel, 0.5 µg L-1 of manganese, 10 µg L-1 of selenium and 1 µg L
-1
of barium. In Table 4 the influence of DRC on the recoveries in the fortified blood samples is reported. Best recoveries for Ni, Mn, Se and Ba were achieved without the use of DRC-ICP-MS. On the other hand, the use of DRC improved the recoveries in blood
samples for Cr and V using an RPq value of 0.7 and a NH3 flow
rate of 0.8 mL min-1.
Table. 4: Recoveries obtained in blood samples with and without use of DRC conditions.
Analyte Concentration added (ug L-1)
Without use of DRC conditions
With use of DRC conditions Recup*
(%)
Recup* (%)
Cr52 2.0 90.3 101.5
Cr53 2.0 106.8 102.7
V51 2.0 103.9 91.6
Ni60 2.0 99.8 96.4
Mn55 0.5 104.8 109.6
Se77 10.0 102.0 67.9
Se78 10.0 102.1 58.5
Se82 10.0 102.1 68.6
Ba135 1.0 98.3 83.9
Ba137 1.0 98.5 73.8
Ba138 1.0 99.2 70.1
* n = 6 replicates
Validation
working range (0,1,2,5,10 and 20 ug L-1 for Be, Sr, Rh, Pd, Sb, Pt,
Tl, Pb, Bi and Ba; 0,2,4,10,20 and 40 ug L-1 for Ni , V and Cr;
0,0.5,1,2.5,5 and 10 ug L-1 for Mn, Co, As, Mo and Cd;
0,10,20,50,100 and 200 ug L-1 for Se and Cu; 0,0.2,0.4,1,2 and 4
ug L-1 for Hg; 0,50,100,250,500 and 1000 ug L-1 for Zn). Three
independent replicates at each concentration level of the calibration curve were used to test the linearity. The verification of the outliers’ absence was made by Grubbs test while data homocedasticity was checked by Cochran test. Results are presented in Table 5. As variances for all elements were considered equal along the tested curve it could be possible to apply the linear regression by the method of least squares. The linearity of the method was then verified by the linear regression equation determined and the residuals graph was plotted in order to verify experimental points deviation from the fitted line (not shown). It was observed an acceptable fit with a random pattern. Each element showed linearity from de first point of the calibration curve to the last point of the curve with correlation coefficient above 0.99 for all elements (Table 7). The results showed goodness of fit evidence and linearity was considered satisfactory. Calibration curve was matrix-matched with human whole blood.
Table. 5: Comparison of variances by Cochran test applied to three independent replicates of each point of the calibration curve.
Cochran test
Analyte C critical (I=5, n=3) C calculated Conclusion*
9Be 0.6838 0.6326 +
55
Mn 0.6838 0.5872 +
59Co 0.6838 0.6543 +
60Ni 0.6838 0.6741 +
65Cu 0.6838 0.3698 +
66
Zn 0.6838 0.5003 +
68
Zn 0.6838 0.5069 +
75
As 0.6838 0.6752 +
77Se 0.6838 0.4993 +
78Se 0.6838 0.4644 +
82Se 0.6838 0.2129 +
88
Sr 0.6838 0.3167 +
98
Mo 0.6838 0.3854 +
103Rh 0.6838 0.6293 +
105Pd 0.6838 0.5338 +
106Pd 0.6838 0.5471 +
108
Pd 0.6838 0.5659 +
111Cd 0.6838 0.4933 +
112Cd 0.6838 0.5617 +
114Cd 0.6838 0.4830 +
121
Sb 0.6838 0.5769 +
123
Sb 0.6838 0.5951 +
194
Pt 0.6838 0.5948 +
195Pt 0.6838 0.2098 +
196Pt 0.6838 0.5901 +
202Hg 0.6838 0.6051 +
203
Tl 0.6838 0.6640 +
206
Pb 0.6838 0.4221 +
207Pb 0.6838 0.4028 +
208Pb 0.6838 0.6313 +
209Bi 0.6838 0.6206 +
138
Ba 0.6838 0.4826 +
135Ba 0.6838 0.6450 +
137Ba 0.6838 0.4885 +
52Cr 0.6838 0.6245 +
51
V 0.6838 0.4450 +
*If C calculated < Ccritical : homocedastic (equal variances) +: homocedastic I:number of points of the calibration curve n: number of replicates.
For each standard curve an unweighted least-squares linear regression of the response (counts/s) as a function of the nominal concentrations was applied (formula: y = b + ax, where x =
concentration in µg L-1, y = counts/s, a = slope and b = intercept).
Typical calibration parameters (slope and intercept) were given in Table 7. Selectivity refers to the extent of the method to determine a certain analyte in the presence of other sample components (Codex, 2009). In ICP-MS technique spectral overlaps may be
caused by polyatomic and isobaric interferences (D’Ilio et al.,
2011). These interferences can lead to overestimation of analyte concentration and the ways to overcome this problem would be choose an alternative isotope, use correction equations or use the
dynamic reaction cell (DRC) technology. For Cr52 and V51
potential interferences were overcome by the use of DRC (see “optimization of DRC operating conditions”). To check the specificity of the method recoveries of fortified samples were measured. Observed concentrations and actual concentrations for all isotopes were quite consistent. Furthermore for the elements that have more than one isotope (Zn, Se, Pd, Cd, Sb, Pt, Pb and Ba) results obtained for these spiked samples were quite similar among the analyte different mass (see Table 6). As a consequence, the specificity of the method was considered acceptable. Accuracy was investigated by means of average recoveries for six replicates of pool blood sample fortified with elements in concentrations equivalent to the first point of the calibration curve. Obtained results were ranged from 88.9% to 108.0% for within-day accuracy while the range for between-day was 96.7% to 109.1% (Table 6). According to AOAC guidelines acceptable recovery ranged from 75% to 120% at the 1 ug/kg concentration (AOAC, 2002). Average recoveries for selenium and barium around 90% were lower than obtained recoveries for the other elements, but the results were in compliance with the specifications of AOAC criterion. The method precision was determined from replicate determinations of six independent preparations in whole blood fortified with concentrations of the elements equivalent to the first point of the calibration curve and assessed by coefficient of variation. Inter-assay accuracy and precision was estimated by carrying out twelve replicate assays on a sample of whole blood fortified for two weeks. The within (assays performed at the same day) and between-day accuracy and precision of the assay are summarized in Table 6. The observed values were within the acceptance criteria (AOAC, 2002). Detection limit (LD) was calculated as three deviation standard and quantification limit (LQ) was calculated as ten deviation standard from six independent replicates of pool human blood sample diluted twenty times and fortified with elements corresponding to the first point of the calibration curve. Quantification limits for copper and zinc were the highest compared to the others elements. The explanation for this is that Cu and Zn are major elements present in high concentration in blood. The results were showed in Table 7. Analysis of blood samples after twenty-fold dilution for the determination of 22 elements showed no deterioration in the quantification limits of the
Table. 6: Summary of within and between-day accuracy and precision results for elements in fortified whole blood sample. Parameters
Within-day* Between-day**
Analyte Actual conc. (ug L-1) Observed conc. (ug L-1) Recup (%) CV (%) Observed conc.(ug L-1) Recup (%) CV (%)
9
Be 1.0 1.04 104.0 4.0 1.06 107.8 4.7
55
Mn 0.5 0.51 102.7 1.6 0.53 105.2 4.2
59
Co 0.5 0.52 104.0 1.2 0.54 107.4 2.6
60Ni 2.0 1.96 98.1 1.7 1.99 102.6 3.8
65Cu 10.0 9.82 98.2 1.8 9.96 105.7 7.9
66Zn 50.0 48.78 97.6 3.0 50.86 99.6 11.0
68
Zn 50.0 49.59 99.2 2.7 51.19 99.7 9.6
75
As 0.5 0.50 100.4 3.2 0.50 101.4 4.1
77Se 10.0 9.86 98.6 2.0 9.87 100.1 2.7
78Se 10.0 9.39 93.9 3.8 9.67 96.7 2.6
82Se 10.0 9.79 97.9 2.1 9.98 102.6 3.9
88
Sr 1.0 0.95 94.6 3.2 0.97 101.7 6.6
98Mo 0.5 0.48 95.3 2.4 0.48 98.4 3.1
103Rh 1.0 1.02 101.8 0.9 1.05 104.4 2.8
105Pd 1.0 1.01 101.5 2.1 1.03 104.6 3.4
106
Pd 1.0 1.02 101.6 3.1 1.02 104.7 5.4
108
Pd 1.0 1.01 101.3 1.4 1.04 104.1 3.8
111
Cd 0.5 0.51 102.3 1.7 0.51 102.6 1.8
112Cd 0.5 0.50 100.8 2.0 0.52 102.9 4.9
114Cd 0.5 0.51 102.9 2.0 0.53 104.0 5.4
121Sb 1.0 1.00 100.0 1.1 1.01 101.1 3.5
123
Sb 1.0 0.99 99.2 0.7 1.01 100.7 3.5
194
Pt 1.0 1.01 100.6 1.5 1.01 103.2 1.5
195Pt 1.0 1.01 100.9 1.0 1.03 103.6 2.9
196Pt 1.0 1.01 100.6 2.2 1.02 102.8 1.9
202Hg 0.2 0.20 101.0 1.4 0.2 107.0 4.4
203
Tl 1.0 1.03 102.7 1.5 1.05 104.9 2.3
206Pb 1.0 1.08 107.5 1.8 1.09 108.7 2.8
207Pb 1.0 1.07 107.4 2.5 1.08 107.6 3.1
208Pb 1.0 1.08 108.0 1.9 1.09 109.1 3.0
209Bi 1.0 1.00 99.6 1.4 1.00 100.4 2.2
138Ba 1.0 0.93 92.7 2.6 0.96 99.8 4.3
135Ba 1.0 0.93 92.6 3.7 0.96 99.9 5.1
137Ba 1.0 0.89 88.9 2.7 0.94 100.0 6.4
52Cr 2.0 1.97 98.7 2.8 2.04 106.0 3.8
51V 2.0 2.07 103.5 4.4 2.22 107.1 8.8
* mean (n = 6) ** mean (n=12)
Table 7: Detection limits and Quantification limits of the method (µg L-1), slope, intercept and correlation coefficient of the calibration curve (r2).
Analyte LD (µg L-1)* LQ (µg L-1)* Slope** (µg L-1) Intercept** (µg L-1) Correlation coefficient (r2)
9Be 0.08 0.26 1.0119 0.0842 0.9992
55Mn 0.06 0.21 1.0205 -0.0133 0.9994
59Co 0.02 0.07 1.0198 -0.0097 0.9997
60Ni 0.11 0.37 1.0314 0.1324 0.9998
65Cu 2.83 9.43 1.0013 0.1751 0.9993
66Zn 19.9 66.3 1.0540 291.7248 0.9996
68Zn 18.2 60.7 1.0564 297.9272 0.9994
75As 0.07 0.25 1.0013 0.0427 0.9994
77Se 0.92 3.08 1.0104 0.0025 0.9998
78Se 1.43 4.75 1.0201 -0.6422 0.9999
82Se 0.96 3.20 1.0276 -0.6797 0.9996
88Sr 0.18 0.60 1.0313 -0.0402 0.9991
98Mo 0.04 0.12 1.0274 0.0286 0.9998
103Rh 0.03 0.09 1.0028 -0.0013 0.9998
105Pd 0.06 0.21 0.9927 0.0385 0.9996
106Pd 0.10 0.32 1.0021 0.0312 0.9998
108Pd 0.04 0.15 0.9991 0.0205 0.9997
111Cd 0.03 0.09 1.0023 0.0224 0.9997
112Cd 0.03 0.10 1.0163 0.0031 0.9995
114Cd 0.03 0.11 1.0083 0.0340 0.9996
121Sb 0.04 0.12 0.9941 0.1189 0.9998
123Sb 0.02 0.08 0.9806 0.1562 0.9996
194Pt 0.04 0.15 0.9969 0.0714 0.9994
195Pt 0.03 0.10 0.9994 0.0540 0.9997
196Pt 0.07 0.22 0.9918 0.0897 0.9993
202Hg 0.01 0.04 1.0091 0.1070 0.9986
203Tl 0.05 0.15 1.0022 0.0209 0.9997
206Pb 0.27 0.91 1.0050 0.0999 0.9997
207Pb 0.29 0.96 1.0056 0.0950 0.9996
Sample preparation
In the literature sample preparation procedures for analysis of blood by ICP-MS commonly involve digestion and dilution of the sample. The high organic matter content in whole blood can cause carbon deposition in the ICP-MS introduction system. This results in analytical signal suppression (Lemos and Carvalho, 2010). Furthermore direct analysis of samples with high organic matrix contents causes the plasma to be extinguished. Thus, it is important to apply one of the pretreatment of sample above mentioned. The digestion procedure consists in the destruction of organic matter of the sample using different acids or
mixture of acids and hydrogen peroxide (Bolann et al., 2007). This
approach can reduce spectral and non-spectral interference problems, but has the risk of introducing contamination. Nowadays sample digestion using microwave is an interesting
method (Kadar et al., 2011; Pick et al., 2010). Dilution is a way to
reduce matrix effect of the sample and many studies report the use of different diluents applied to whole blood samples. Some of
them include the use of diluted acid with Triton X-100 (Palmer et
al., 2006; Batista et al., 2009), a non-ionic surfactant, which
promotes the solubilization of proteins present in this matrix thereby preventing clogging on the nebulizer, sampler and
skimmer cone (Mesko et al., 2011; McShane et al., 2008). On the
other hand aqueous dilution of whole blood provokes precipitation of red cells (Subramanian, 1996). Methods in literature also report the use of phosphate and EDTA solutions (Bonefoy et al., 2002& 2005; Krachler et al., 2009) to improve the stability of the diluted blood solution preventing precipitation (Subramanian, 1996), but EDTA is hard to obtain in a pure form (Lemos and Carvalho, 2010). Direct dilution of whole blood can also be carried out with tetramethyl ammnonium hydroxide (TMAH) which also aid in protein solubility and stability of the sample solution
(Subramanian, 1996; McShane et al., 2008). However, the TMAH
solubilization has the disadvantage of presenting limited time-stability of the sample solution (Subramanian, 1996). Another
approach is the use of butanol (Bonnefoy et al., 2002; 2005),
ethanol or propanol to increase the analytical signal and reduce
carbon buildup on the cones (Subramanian, 1996; McShane et al.,
2008). First we tried to digest the sample blood by dry ashing but the time spent was too long. Furthermore, it was difficult to solubilize the digested sample with low acid concentration. Thus, we chose to use the procedure for diluting the blood sample with Triton in acid medium and subsequent reading of the sample directly on ICP-MS. The use of Triton X-100 improved the washout of the sample after the analysis and no blockages were observed during the analysis. After measuring 250 to 375 blood samples, that took five
days of measuring, the sample introduction system and torch were
cleaned with diluted acid solution (10% (v/v) HNO3) followed by
rinsing with Milli-Q water. At the same time cones were cleaned
with diluted acid solution (1% (v/v) HNO3) and lenses were
cleaned with Milli-Q water. Mercury memory effect is the major problem in mercury analysis by ICP-MS. Mercury adheres to the spray chamber wall (known as carryover problems or memory effects) and remains as vapor in the spray chamber and could be
released during subsequent analyses (Fong et al., 2007). In order
to overcoming this problem gold, considered one of the most effective washout agents, was added to diluent to improve the washout for Hg. Use of gold prevents mercury volatilization and adsorption losses. When gold was removed from the diluent poorer precision was achieved. The suggested method involved simple dilution of the sample and proved to be fast since it enabled the simultaneous determination of 22 elements in just 4:22 minutes.
CONCLUSION
The proposed method uses low quantities of blood and this feature is essential when analyzes involve human biological samples. In conclusion, the proposed method for determining inorganic elements in human blood samples proved to be accurate, precise, sensitive, and for most elements limits of quantification
were below 1 µg L-1. The between-day percentage recovery ranged
from 96.7% to 109.1%. The between-day precision did not exceed 11% for all analytes. Dynamic reaction cell (DRC) is an important tool in ICP-MS analysis for reduction or elimination of spectral interferences and its use was only necessary for chromium and vanadium determination in blood matrix. The proposed method requires minimal sample preparation involving a simple dilution. This fact contributes for its application in routine laboratory analysis for environmental and occupational monitoring studies.
The simultaneous inorganic elements determination in blood may be relevant since it may be useful as a quick and reliable research tool in public health and other areas.
ACKNOWLEDGEMENTS
The authors are grateful to Fundação de Amparo à Pesquisa do Estado de São Paulo (FAPESP) for financial support.
REFERENCES
Ammann AA. Inductively coupled plasma mass spectrometry (ICP-MS): a versatile tool. J Mass Spectrom, 2007; 42: 419-27.
AOAC. 2002. Guidelines for single laboratory validation of chemical methods for dietary supplements and botanicals.
Apostoli P. Elements in environmental and occupational medicine. J Chromatogr B, 2002; 778: 63-97.
209Bi 0.04 0.14 1.0006 0.0353 0.9998
138Ba 0.08 0.25 0.9997 0.0524 0.9997
135Ba 0.10 0.35 0.9952 0.0648 0.9998
137Ba 0.08 0.26 0.9972 0.0601 0.9999
52Cr 0.16 0.54 1.0056 0.0960 0.9998
51V 0.16 0.52 1.0085 0.0019 0.9999
Bárany E, Bergdahl IA, Schütz A, Skafaving S, Oskarsson A. Inductively coupled plasma mass spectrometry for direct multi-element analysis of diluted human blood and serum. J Anal Atom Spectrom, 1997;12: 1005-9.
Barbosa Jr F, Santos JET, Gerlach RF, Parsons PJ. A critical review of biomarkers used for monitoring human exposure to lead: advantages, limitations, and future needs. Environ Health Perspect, 2005; 113(12): 1669-74.
Batista BL, Rodrigues JL, Nunes JA, Souza VCO, Barbosa Jr F. Exploiting dynamics reaction cell inductively coupled plasma mass spectrometry (DRC-ICP-MS) for sequential determination of trace elements in blood using a dilute-and-shoot procedure. Anal Chim Acta, 2009; 639: 13-8.
Bazzi A, Nriagu JO, Linder AM. Determination of toxic and essential elements in children’s blood with inductively coupled plasma-mass spectrometry. J Environ Monit, 2008; 10: 1226-32.
Bolann BJ, Rahil-Khazen R, Henriksen H, Isrenn R, Ulvik RJ. Evaluation of methods for trace element determination with emphasis on their usability in the clinical routine laboratory. Scand J Clin Lab Invest, 2007; 67: 353-66.
Bonnefoy C, Menudier A, Moesch C, Lachâtre G, Mermet J-M. Determination of chromium in whole blood by DRC-ICP-MS: spectral and non-spectral interferences. Anal Bioanal Chem, 2005; 383: 167-73.
Bonnefoy C, Menudier A, Moesch C, Lachâtre G, Mermet J-M. Validation of the determination of lead in whole blood by ICP-MS. J Anal At Spectrom, 2002; 17: 1161-5.
Bortoli A, Gerotto M, Marchiori M, Palonta R, Troncon A. Applications of inductively coupled plasma mass spectrometry to the early detection of potentially toxic elements. Microchem J, 1992; 46: 167-73.
Codex Committee on Methods of Analysis and Sampling (CCMAS). GUIDELINES ON ANALYTICAL TERMINOLOGY. (CAC/GL 72-2009). 2009. Available at:
www.codexalimentarius.org/input/download/standards/.../cxg_072e.pdf
Commission of the European Communities. 2002/657/EC: Commission Decision of 12 August 2002 implementing Council Directive 96/23/EC concerning the performance of analytical methods and the interpretation of results. Official Journal of the European Communities. Document number C(2002) 3044. 29 p. Available at: old.eur-lex.europa.eu/LexUriServ/LexUriServ.do?uri=OJ:L:2002:221:0008:0036: EN:PDF
D’Ilio S, Petrucci F, D’Amato M, DiGregorio M, Senofonte O, Violante N. Method validation for determination of arsenic, cadmium, chromium and lead in milk by means dynamic reaction cell inductively coupled plasma mass spectrometry. Anal Chim Acta, 2008;624: 59-67.
D’Ilio S, Violante N, Di Gregório M, Senofonte O, Petrucci F. Simultaneous quantification of 17 trace elements in blood by dynamic reaction cell inductively coupled plasma mass spectrometry (DRC-ICP-MS) equipped with a high-efficiency sample introduction system. Anal Chim Acta, 2006; 579: 202-8.
D’Ilio S, Violante N, Majorani C, Petrucci F. Dynamic reaction cell ICP-MS for determination of total As, Cr, Se and V in complex matrices: Still a challenge? A review. Anal Chim Acta, 2011; 698: 6-13.
De Boer JLM, Ritsema R, van Staden SP, Van den Beld W. Practical and quality-control aspects of multi-element analysis with quadrupole ICP-MS with special attention to urine and whole blood. Anal Bioanal Chem, 2004; 379: 872-80.
Ek KH, Morrison GM, Rauch S. Environmental routes for platinum group elements to biological materials – a review. Sci Total Environ, 2004; 334-5:21-38.
Fong BM, Lee TS, Tam S. Determination of mercury in whole blood and urine by inductively coupled plasma mass spectrometry. J Anal Toxicol, 2007; 31 (5): 281-7.
Goullé JP, Mahieu L, Castermant J, Nevew N, Bonneau L, Lainé G, et al. Metal and metalloid multi-elementary ICP-MS validation in whole blood, plasma, urine and hair. Reference values. Forensic Sci Int, 2005; 153(1): 39-43.
Heitland P, Köster HD. Fast, simple and reliable routine determination of 23 elements in urine by ICP-MS. J Anal At Spectrom, 2004; 19: 1552-8.
International Organization for Standardization-ISO (US). Clean room an associated controlled environments – Part 1: Classification of air cleanliness 14644-1: 1999. Geneve.
Kadar A, Noël L, Chekri R, Vastel C, Millour S, Guérin T. Optimization of ICP-MS collision/reaction cell conditions for the determination of elements likely to be interfered (V, Cr, Fe, Co, Ni, As and Se) in foodstuffs. Talanta, 2011; 85: 2605-13.
Krachler M, Heisel C, Kretzer P. Validation of ultratrace analysis of Co, Cr, Mo and Ni in whole blood, serum and urine using ICP-SMS. J Anal At Spectrom, 2009; 24: 605-10.
Kuno R, Roquetti MH, Gouveia N. Conceitos e derivação de valores de referência para biomonitorização humana de contaminantes ambientais. Rev Panam Salud Publica, 2010; 27(1): 74-9.
Lemos VA, de Carvalho AL. Determination of cádmium and lead in human biological samples by spectrometric techniques: a review. Environ Monit Assess, 2010; 171: 255-65.
McShane WJ, Pappas RS, Wilson-McElprang V, Paschal D. A rugged and transferable method for determining blood cadmium, mercury, and lead with inductively coupled plasma-mass spectrometry. Spectrochim Acta Part B At Spectrosc, 2008; 63: 638-44.
Mesko MF, Hartwig CA, Bizzi CA, Pereira JSF, Mello PA, Flores EMM. Sample preparation strategies for bioinorganic analysis by inductively coupled plasma mass spectrometry. Int J Mass Spectrom, 2011; 307: 123-36.
Needham LL, Calafat AM, Barr DB. Uses and issues of biomonitoring. Int J Hyg Environ Health, 2007; 210: 229-38.
Palmer CD, Lewis Jr ME, Geraghty CM, Barbosa Jr F, Parsons PJ. Determination of lead, cadmium and mercury in blood for assessment of environmental exposure: A comparison between inductively coupled plasma-mass spectrometry and atomic absorption spectrometry. Spectrochim Acta Part B At Spectrosc, 2006; 61: 980-90.
Paolielo MMB, Gutierrez PR, Turini CA, Matsuo T, Mezzaroba L, Barbosa DS, Alvarenga ALP, et al. Valores de referência para plumbemia em população urbana. Rev Saude Publica, 1997; 31(2): 144-8.
Paquette V, Larivière P, Cornier D, Truchon G, Zayed J, Tra HV. Development and validation of analytical methods for ultra-trace beryllium in biological matrices. J Anal Toxicol, 2010; 34: 562-70.
Parsons PJ, Barbosa Jr F. Atomic spectrometry and trends in clinical laboratory medicine. Spectrochim Acta Part B At Spectrosc, 2007; 62: 992-1003.
Pick D, Leiterer M, Einax, JW. Reduction of polyatomic interferences in biological material using dynamic reaction cell ICP-MS. Microchem J, 2010; 95: 315-9.
Rivero Martino FA, Fernández Sánchez ML, Sanz-Medel A. Total determination of essential and toxic elements in milk whey by double focusing ICP-MS. J Anal Atom Spectrom, 2000; 15: 163-8.
Sariego Muñiz C, Marcharte-Gayón JM, Garcia Alonso JI, Sanz-Medel A. Multi-elemental trace analysis of human serum by double-focusing ICP-MS. J Anal Atom Spectrom, 1999; 14: 193-8.
Subramanian KS. Determination of metals in biofluids and tissues: sample preparation methods for atomic spectroscopic techniques. Spectrochim Acta Part B At Spectrosc, 1996; 51: 291-319.
Vanhaecke F, Vanhoe H, Dams R. The use of internal standards in ICP-MS. Talanta, 1992; 39(7): 737-42.
Zhou Y, Zanão RA, Barbosa Jr F, Parsons PJ, Krug FJ. Investigations of a W-Rh permanent modifier for the determination of Pb in blood by electrothermal atomic absorption spectrometry. Spectrochim Acta Part B At Spectrosc, 2002; 57: 1291-1300.
How to cite this article: