* Corresponding author. Tel.: +085-442434 E-mail address: [email protected] Manuscript History:
Received 19 June, 2018, Revised 18 September, 2018, Accepted 26 September, 2018, Published 30 September, 2018
Optimization of Ostrich Eggshell Catalyst in Transesterification Using
Waste Cooking Oil via Response Surface Methodology
Yie Hua Tan
1, a *, Mohammad Omar Abdullah
b, Jibrail Kansedo
a, Agus Saptoro
aand Cirilo
Nolasco Hipolito
ca
Department of Chemical Engineering, Curtin University Malaysia, CDT 250, 98009 Miri,
Sarawak, Malaysia.
b
Department of Chemical Engineering and Energy Sustainability, Faculty of Engineering,
Universiti Malaysia Sarawak, 94300 Kota Samarahan, Malaysia.
c
Instituto of Biotechnology. Universidad del Papaloapan. Circuito Central #200, Col. Parque
Industrial, CP. 68301. Tuxtepec, Oaxaca. Mexico.
Abstract
In this research work, waste cooking oil biodiesel production was optimized using a design of experiment (DOE) approach: response surface methodology (RSM), based on a five level, three variables central composite design (CCD) to investigate the interaction effects of the different combination of transesterification reaction variables such as catalyst concentration, reaction temperature and time, using ostrich eggshell CaO base catalyst. A quadratic polynomial equation of the response, biodiesel yield was attained via multiple regression analysis to predict the relation between yield and the chosen variables. The results showed that the temperature and time are the most important process parameters on the biodiesel production. The optimal operating conditions for the transesterification reaction have been found to be: reaction temperature of 67 °C, alcohol/oil molar ratio of 10:1 (fixed parameter), catalyst concentration of 1.97 % w/w and reaction time of 1.77 h. The predicted biodiesel yield was about 99.67% under the optimal conditions through the ANOVA numerical method.
Keywords: Biodiesel production, Heterogeneous catalyst, Ostrich eggshell, Optimization, RSM.
1. Introduction
renewable biological resources such as vegetable oils or animal fats via a transesterification reaction [3]. Biodiesel has low toxicity, biodegradability, high-lubricity, high Cetane number, higher flash point, high oxygen content which result in good combustion efficiency and does not contain sulphur and aromatic compounds [4]. The transesterification process involves the alcoholysis reaction between the oil feedstock and alcohol with the presence of catalyst, to obtain methyl esters (biodiesel) and glycerin (soap, side product) [5].
The transesterification process is influenced by a several operating parameters, such as the type of the oil feedstock and alcohol, catalyst loading, alcohol to oil molar ratio, reaction temperature, reaction time and agitation speed are the main variables which will be affecting the biodiesel yield. Thus, optimization of biodiesel production is of utmost importance as process exploration and optimization are often laborious and time-consuming. These are requiring patience and commitment especially in the repeated experiments.
Therefore, current paper will be discussing the findings of the experiments carried out to optimize the biodiesel production process via heterogeneous base catalyzed transesterification. This paper is focusing on the three important operating parameters which is reaction time, reaction temperature and catalyst loading that will influence the conversion of FFAs (free fatty acid) from waste cooking oil in a two steps transesterification reaction with methanol using ostrich eggshell-derived CaO base catalyst. The main objectives were to develop a method that explain the relationships or interaction effects between the variables (reaction time, reaction temperature and concentration of catalyst) and the response (biodiesel yield); and to optimize the operating process conditions for biodiesel production using central composite design (CCD) via response surface methodology (RSM).
Response surface methodology (RSM) is a combination of statistical and mathematical techniques especially for empirical modelling, problem analysis development, modification and optimization of various processes to obtain an optimal response [6].
2. Procedure
2.1. Materials
Waste cooking oil was given by a local restaurant in Kuching, Sarawak which contained 0.60 wt% of water with an acid value of 1.24 mg KOH/g and a saponification value of 214 mg KOH/g. Its density at room temperature is 0.98 g/cm3. The waste cooking oil was first filtered and heated inside
the conventional oven up to 100 oC to eliminate the dirt and moisture before used as the oil feedstock
for one to two hours by incubated orbital shaker. Thereafter, an appropriate amount of oil was added into the mixture and transesterification reaction was carried out. Fixed methanol/oil molar ratios, i.e. 10:1 and different catalyst loading (wt% based on the oil weight), reaction temperature and time were selectively chosen to manipulate the transesterification reaction. Upon the completion of transesterification reaction, the mixture of the product was centrifuged at 3000 rpm for 20 mins. The lower layer of glycerin and CaO catalyst were carefully removed and weighed while the upper methyl ester layer was washed several times with hot deionized water. This procedure was repeated until the pH value in the upper aqueous phase reached 7.0. The obtained biodiesel was heated over 100 °C in oven to remove the excessive water and methanol. The biodiesel yield was calculated using the following formula:
Biodiesel yield = [W(biodiesel) ÷ W(waste cooking oil)] × 100% (1)
whereas, W(biodiesel) and W(waste cooking oil) are the weight of biodiesel and weight of waste cooking oil, respectively.
2.3. Optimization
A five-level-three-factor central composite design (CCD) was employed to optimize the operating variables (reaction temperature, catalyst loading and reaction time) to achieve high value of biodiesel yield. Assume the CCD design is a sphere around the factorial cube, 20 experimental runs (2k + 2*k + nc), have k factors, then 2k factorial points = 8, 2*k axial points = 6 and ncreplicated center points = 6 were performed in a randomized order. Here, k is the number of independent variables and k = 3 shall provide sufficient information to allow a full second-order polynomial model [7]. The fourth root of the number of points in the factorial part of the design, gives us a rotatable design, whereas the axial point is defined as α = 1.68, through α=[2k]1/4, whereas, k = 3 in this
research. The range and levels of individual variables of 3k design were given in Table 1. The
experiment design was given in Table 2. The value of biodiesel yield is the response.
The obtained experimental data was further analyzed by the response surface regression method using the following second-order polynomial formula:
(2)
Where response variable of interest is Y (biodiesel yield), βi and βij are coefficients coded from
the results of regression, a set of predictor variables x1, x2, x3... on the response. While, n is the
Table 1. Codes, ranges and levels of different independent variables in RSM design
Independent variables Units -1 1 - α + α
Catalyst loading %w/v 1 2 0.66 2.34
Temperature oC 50 80 39.77 90.23
Time hr 1 2 0.66 2.34
Table 2. Experimental data for the yield of biodiesel obtained from the a five-level-three-factor CCD for RSM
Factor 1 Factor 2 Factor 3 Response 1
Run Space Type A:Catalyst loading B:T C:Time Biodiesel yield
%w/v oC hr %
1 Center 1.5 65.0 1.5 95.6
2 Factorial 2.0 80.0 2.0 90.8
3 Factorial 1.0 80.0 2.0 88.3
4 Axial 1.5 65.0 2.3 89.3
5 Factorial 1.0 50.0 2.0 82.0
6 Factorial 1.0 50.0 1.0 65.8
7 Factorial 2.0 50.0 1.0 75.6
8 Axial 1.5 65.0 0.7 64.8
9 Axial 2.3 65.0 1.5 93.9
10 Factorial 2.0 50.0 2.0 89.3
11 Center 1.5 65.0 1.5 96.5
12 Axial 1.5 39.8 1.5 50.8
13 Center 1.5 65.0 1.5 97.3
14 Axial 0.7 65.0 1.5 76.7
15 Center 1.5 65.0 1.5 96.7
16 Center 1.5 65.0 1.5 97.5
17 Axial 1.5 90.2 1.5 82.1
18 Center 1.5 65.0 1.5 95.6
3. Results and Discussion
3.1. RSM Analysis
The gotten experimental biodiesel yields were used to obtain a regression model. The predicted values of biodiesel yield were calculated using the regression model in Design-Expert software developed a 23 factorial CCD resulting in 20 runs with six axial points and six replicates. Based on the obtained coded parameters, the predicted quadratic regression model with defined coefficients was given by the following equation:
Biodiesel yield =96.33+3.71*A+5.77*B+6.62*C-1.57*AB-0.24*AC-1.30*BC-2.62*A2-9.28*B2
-5.54*C2 (3)
where A, B and C are the coded forms of catalyst loading, reaction temperature and time, respectively. While, AB, AC, and BC are the interaction terms among the variables whereas A2, B2
and C2 are the squared terms of the variables. Table 3 shows the results of Analysis of variance
(ANOVA) for the predicted values fit well with the experimental values. The R-square value of the coefficient of multiple determination (R2=0.9106) revealed that the model best fits the experimental
data. The linear, quadratic and combined effects of the independent parameters were included to define their effects on the biodiesel yield. The significance level of each parameter which was evaluated by the probability value (value) as per listed in Table 3. At 95% confidence level, the p-values less than 0.05 indicated the significant effects of those parameters. As shown in Table 3, it can be found that the most significant variable on the biodiesel yield were arranged in ascending order, i.e. the quadratic terms of reaction temperature, B2 (p <0.0001), time, C2 (p = 0.0026) and catalyst loading, A2 (p = 0.0894) and followed by linear term of time, C (p = 0.0009), temperature, B (p =
0.0024) and catalyst loading, A (p = 0.027). While the p-value for the rest interactive effects are larger
Table 3. ANOVA for biodiesel model
Sum of Mean F p-value
Source Squares df Square Value Prob > F
Model 2851.96 9 316.88 11.31 0.0004
A-Catalyst loading 187.88 1 187.88 6.71 0.027
B-Temperature 454.22 1 454.22 16.21 0.0024
C-Time 598.85 1 598.85 21.38 0.0009
AB 19.69 1 19.69 0.7 0.4215
AC 0.47 1 0.47 0.017 0.9
BC 13.49 1 13.49 0.48 0.5035
A2 99.14 1 99.14 3.54 0.0894
B2 1242.1 1 1242.1 44.33 < 0.0001
C2 443.1 1 443.1 15.82 0.0026
Residual 280.16 10 28.02
Lack of Fit 276.84 5 103.37 33.23 < 0.0001
Pure Error 3.33 5 0.67
Cor Total 3132.12 19
R2 0.9106; adjusted R2 0.83.
3.2. Response Surface Analysis
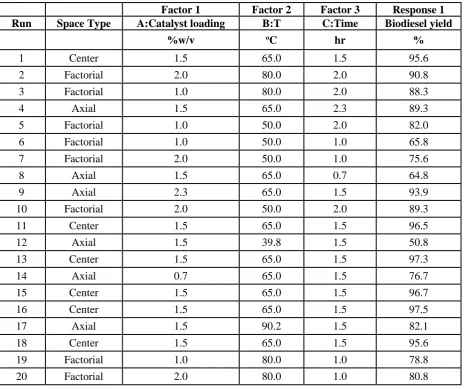
The full three-dimensional (3D) reciprocal space map (RSM) graphs are the graphical measurement technique which can articulate the optimal values of each variable [9]. Three different 3D RSM surface contour plots, Figure 1(a)-(c) are illustrated to show the interaction effect of catalyst loading, reaction time and temperature on biodiesel yield.
Factor Coding: Actual Biodiesel yield (%)
Design points above predicted value
Design points below predicted value 97.54
50.8
X1 = A: Catalyst concentration X2 = B: Temperature Actual Factor C: Time = 1.5
50 56 62 68 74 80 1 1.2 1.4 1.6 1.8 2 50 60 70 80 90 100 B io d ie s e l y ie ld ( % )
A: Catalyst concentration (%w/v) B: Temperature (oC)
Design points above predicted value Design points below predicted value
97.54
50.8
X1 = B: Temperature X2 = C: Time
Actual Factor
A: Catalyst concentration = 1.5
1 1.2 1.4 1.6 1.8 2 50 56 62 68 74 80 50 60 70 80 90 100 B io d ie s e l y ie ld ( % )
B: Temperature (oC) C: Time (hr)
Design-Expert® Software Factor Coding: Actual Biodiesel yield (%)
Design points above predicted value
Design points below predicted value 97.54
50.8
X1 = A: Catalyst concentration X2 = C: Time
Actual Factor B: Temperature = 65
1 1.2 1.4 1.6 1.8 2 1 1.2 1.4 1.6 1.8 2 50 60 70 80 90 100 B io d ie s e l y ie ld ( % )
A: Catalyst concentration (%w/v) C: Time (hr)
Figure 1.3D plot of the combined effects of (a), catalyst concentration and temperature (b) time and
temperature (c) time and catalyst concentration on the biodiesel yield.
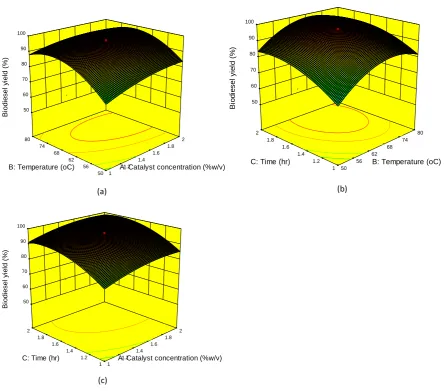
3.3. Optimization of Transesterification
The numerical method of the regression model was employed using Design-Expert 10.0 software to optimize the operating condition for the transesterification. The result was shown as in Figure 2. Experimental validation demonstrated a biodiesel yield of 94%. The small discrepancy of ± 5% between predicted and validated yield suggests that RSM was a suitable tool in optimizing the proposed operating conditions for biodiesel production.
(a) (b)
A:Catalyst concentration = 1.96841
1 2
B:Temperature = 67.2093
50 80
C:Time = 1.7708
1 2
Biodiesel yield = 99.6656
50.8 97.54
Desirability = 1.000
Figure 2. Optimization operating conditions for biodiesel production.
8. Conclusion
Response surface methodology was successfully applied to study the relationship of catalyst loading, temperature and time variables on the transesterification process from waste cooking oil. RSM proved to be a powerful tool for the optimization of biodiesel production at a fixed methanol to oil molar ratio. A second-order model was developed to describe the interaction effects between biodiesel yield and the main parameters, i.e. catalyst loading, reaction temperature and time. The ANOVA’s result implied that temperature was the most significant factor affecting the biodiesel yield among the selected variables. In order to minimize the biodiesel production cost, optimization of the independent parameters was performed. Numerical function in RSM gave the optimum operating conditions of 1.97 %w/v catalyst loading, 1.77 hours and 67 °C. Maximum yield of biodiesel, 99.67% was achieved at the optimum operating conditions.
Acknowledgements
The authors gratefully acknowledge the support from Curtin University Malaysia and University Malaysia Sarawak. This research was supported by the FRGS Grant Scheme, Contract No: FRGS/1/2016/TK07/UNIMAS/01/2 and Code No. F02/FRGS/1490/2016 granted financial resource from Ministry of Education, Malaysia. We thank our colleagues who provided insight and expertise that greatly assisted the research.
References
[1] Leung, D.Y.C., Wu, X. and Leung, M.K.H. (2011). A Review on Biodiesel Production Using Catalyzed Transesterification, Appl. Energy, Vol. 87, No. 4, 1083-1095.
[2] Uzun, B.B., Kılıc, M., Özbay, N., Pütün, A.E. and Pütün, E. (2012). Biodiesel Production from Waste
A:Catalyst concentration = 1.96841
1 2
B:Temperature = 67.2093
50 80
C:Time = 1.7708
1 2
Biodiesel yield = 99.6656
50.8 97.54
[7] Lesbani, A., Susi, Y., Verawaty, M. and Mohadi, R. (2015). Calcium Oxide Decomposed from Chicken’s and Goat’s Bones as Catalyst for Converting Discarded Cooking Oil to be Biodiesel, Aceh Int. J. Sci. Technol., Vol. 4, 7 – 13.
[8] Roschat, W., Siritanon, T., Yoosuk, B., Promarak, V. (2016). Biodiesel Production from Palm Oil Using Hydrated Lime-Derived CaO as a Low-Cost Basic Heterogeneous Catalyst, Energy Convers Manage, Vol. 108, 459-467.
[9] Yoosuk, B., Udomsap, P., Puttasawat, B., Krasae, P. (2010). Improving transesterification activity of CaO with hydration technique, Bioresour Technol, Vol. 101,3784-3786.
[10]Tan, Y.H., Abdullah, M.O., Nolasco-Hipolito, C. and Zauzi, N.S.A. (2017). Application of RSM and Taguchi Methods for Optimizing the Transesterification of Waste Cooking Oil Catalyzed by Solid Ostrich and Chicken-Eggshell Derived CaO, Renew. Energy, Vol. 114, No. B,437-447.