This is an open access journal, and articles are distributed under the terms of the Creative Commons Attribution-Non Commercial-ShareAlike 4.0 License, which allows others to remix, tweak, and build upon the work non-commercially, as long as appropriate credit is given and the new creations are licensed under the identical terms.
© 2019 Journal of Advanced Pharmacy Education & Research | Published by SPER Publication 128
The study of problems and prospects of the pharmacy network
development in Ukraine in the context of changing approaches
to the state regulation in the retail segment of the national
pharmaceutical market
Hanna Panfilova
1*, Liliia Hala
2, Liusine Simonian
1, Oksana Tsurikova
3, Oleg Gerush
4, Natalia
Bogdan
41 Department of Organization and Economics of Pharmacy, Faculty of Pharmacy, National University of Pharmacy, Kharkiv, Ukraine. 2Department of Organization and
Economics of Pharmacy, Faculty of Pharmacy, Bogomolets National Medical University, Kyiv, Ukraine. 3Department of Pharmaceutical Marketing and Management,
Faculty of Pharmacy, National University of Pharmacy, Kharkiv, Ukraine. 4Department of Pharmacy, Faculty of Pharmacy, Bukovinian State Medical University, Chernivtsi,
Ukraine.
Correspondence:Hanna Panfilova, Department of Organization and Economics of Pharmacy, 4, Valentinovska str., Kharkiv, 61168. E-mail: [email protected].
ABSTRACT
Objective: Analysis of problems and prospects of the pharmacy network development (pharmacies, branch pharmacies and pharmacy kiosks) in Ukraine. Methods: The historical, comparative, logical, structural, economic and mathematical methods, as well as methods of marketing analysis of the pharmaceutical market were used. Results: It was found that the retail segment of the pharmaceutical market during 2009-2018 had a complex development character. For example, in the period from 2009 to 2014, there was a gradual decrease in the number of pharmacies. In 2014, their number decreased sharply by 20.1% compared to the data of 2009, while in 2015, their number increased slightly by 4.3%. In 2018, the above figure did not return to the data of 2009. The liquidation of pharmacy kiosks led to an increase in the number of pharmacies by 6.69% and branch pharmacies by 8.31% in 2013. Already from 2009 to 2012, there was a sharp decrease in the number of pharmacy kiosks, from 5600 to 2168, i.e. in 2.6 times. The most important positive characteristic of the pharmacy network development was a systematic increase of the share (%) of pharmacies in its structure. Thus, this figure in 2009 amounted to 51.0%, and in 2017-2018 it was already 79.0%. The average number of residents per one pharmacy in Ukraine is 2,145. This indicator is comparable with the similar data obtained in Poland, Belgium, Montenegro, Macedonia, etc. Conclusion: The Ukrainian segment of the pharmaceutical market has demonstrated, on the one hand, a significant dependence on external factors of influence, and, on the other hand, has shown the ability to respond quickly and flexibly to changing conditions of regulation of its activities by the state.
Keywords: pharmacy, pharmacy kiosk, branch pharmacy, retail segment of the pharmaceutical market, Ukrainian pharmaceutical market
Introduction
Pharmacy institutions occupy key positions in organization of the effective pharmaceutical care, which meets the main objectives of the National drug policy recommended by the WHO. [1-3] The
system of pharmaceutical provision as an integral structure of the macroeconomic complex of the country operates in a dense legislative and legal framework, from the standpoint of the number of regulation documents and their scope of application. [3-5]
Regulation of pharmaceutical activities, especially in the retail Access this article online
Website: www.japer.in E-ISSN: 2249-3379
How to cite this article: Hanna Panfilova, Liliia Hala, Liusine Simonian, Oksana Tsurikova, Oleg Gerush, Natalia Bogdan. The study of problems and prospects of the pharmacy network development in Ukraine in the context of changing approaches to the state regulation in the retail segment of the national pharmaceutical market. J Adv Pharm Edu Res 2019;9(3):128-135.
segment of the pharmaceutical market is carried out in different countries through a range of methods of direct and indirect impact.
[6,7] According to experts, recently there has been a steady trend to
strengthen the role of the state and public organizations that protect the interests of patients in the regulation of the quality and socio-economic availability of drugs sold at the national pharmaceutical markets. [8-11] In addition, effective regulation of pharmacy activities
can significantly expand the range of their impact on the process of providing effective services to the population in practical healthcare. [8,10] Active participation of pharmacies in social projects
implemented by the state or international humanitarian organizations significantly increases the public authority of pharmacists and the pharmacy service in general. [4,12-16] Thus,
experts note that in some countries with low incomes and state guarantees for provision of affordable medical and pharmaceutical care pharmacies are the only healthcare institution that is accessible to the poor. [15-21] In many countries, pharmacies are actively
involved in implementation of social projects for the prevention of particularly dangerous infectious diseases (HIV, AIDS, tuberculosis, viral hepatitis, etc.), vaccination of children, health education of the population, implementation of environmental programs for the safe disposal of pharmaceutical waste, etc. [7,15,22-27] Against the
background of the global trend of the population ageing pharmacies in rural areas play an increasingly important role, especially in those countries where there are significant disparities in the incomes of the urban and rural population. [7,13,16,17,28,29] The organization of
permanent consultative assistance to chronic patients, especially the elderly with cognitive impairment, is becoming increasingly important. [30-34] Thus, it can be concluded that every year the social
burden imposed by the state and society as a whole on pharmacy institutions increases. [5,7,24,31,35,36] As a result, the level of
responsibility of pharmacy institutions for the quality of services provided to the population also significantly increases. [5,7,21,31,37-41]
Hence, any changes that are implemented in the regulatory framework governing pharmaceutical activities can have serious consequences not only for the development of the pharmacy network in the country, but also for the social stability in the society as a whole. [4,5,7,31] Therefore, the study aims to analyze the main
problems and prospects of development of the pharmacy network in the context of changing approaches to the state regulation in
the retail activities of pharmacies at the national pharmaceutical market is of great socio-economic importance.
Materials and Methods
In our research, the data of the State Service of Ukrainе on Medicines and Drug Control (http://dls.gov.ua/en/), as well as the data of the domestic analytical system of the
pharmaceutical market research called
“PharmXplorer”/”Pharmstandard” of the company “Proxima Research” were used. When forming a statistical database in the
“PharmXplorer”/”Pharmstandard” system, a unified methodological approach is used, therefore, we believe that the statistical selection and analysis of indicators presented in this database in the dynamics of years is scientifically reasonable. For the analysis, the following data were selected: the total number of pharmacy institutions and their structural units (pharmacies, branch pharmacies and pharmacy kiosks); the demographic burden per one pharmacy (the number of people per one pharmacy). The study of dynamics of change of these indicators in total allows forming the scientifically proven assessment of degree of physical and socio-economic availability of providing pharmaceutical care to the population in Ukraine. Based on our research, the main directions for improving the efficiency of the pharmacy network in Ukraine can be further formulated. In our research both general theoretical methods of research (logical, historical, comparative, structural, graphic, synthesis and analysis, grouping, etc.) and economic and mathematical methods applied in modern economic analysis were used. In the analysis of dynamics of changes of indicators of the pharmacy network development in Ukraine, the traditional mathematical tool applied in organizational and economic studies in pharmacy was used. [42,43] Thus, the chain values of the growth and
growth/decline rates (%) were calculated. [42,44] To calculate the
demographic burden per a pharmacy, the data of the number of residents of Ukraine presented on the official website State Statistics Service of Ukrainе, section “Population of Ukraine”
(http://database.ukrcensus.gov.ua/PXWEB2007/ukr/publ_n ew1/2016/naselen_2015.pdf) were used (Table 1).
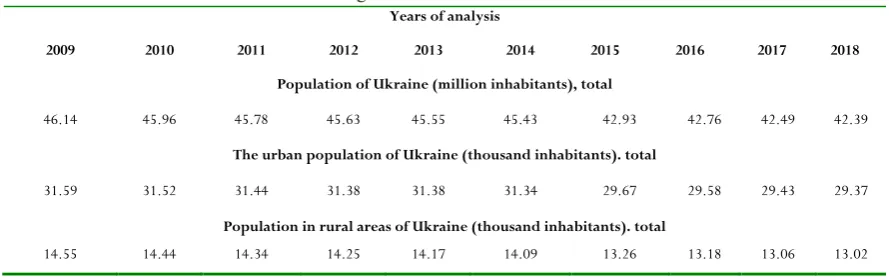
Table 1: Initial indicators for the calculation of the demographic burden per one pharmacy in Ukraine during 2009-2018 according to the State Statistics Service of Ukraine.
Years of analysis
2009 2010 2011 2012 2013 2014 2015 2016 2017 2018
Population of Ukraine (million inhabitants), total
46.14 45.96 45.78 45.63 45.55 45.43 42.93 42.76 42.49 42.39
The urban population of Ukraine (thousand inhabitants). total
31.59 31.52 31.44 31.38 31.38 31.34 29.67 29.58 29.43 29.37
Population in rural areas of Ukraine (thousand inhabitants). total
14.55 14.44 14.34 14.25 14.17 14.09 13.26 13.18 13.06 13.02
The statistical data processing was carried out using the statistical package StatSoft. Inc. (2014), STATISTICA version
12.0, and Excel spreadsheet. [42,44] After the preliminary
Statistica 6.0 standard program for the applied statistical analysis. The p-value <0.05 was considered to be statistically significant.
Results and Discussion
Over the past few years, the pharmaceutical sector of the Ukrainian economy has undergone profound and systemic changes that have affected almost all activities at the stage of promotion of drugs and pharmaceutical products from a manufacturer to a consumer. Table 2 presents the results of the analysis of the dynamics of the pharmacy network development in Ukraine for the period from 2009 to 2018. In the research conducted, the following results have been achieved. The maximum number of pharmacies in Ukraine was observed in 2009, and the minimum one in 2014. In 2018, the total number of pharmacies compared to the data of 2009 decreased by 2771 or 11.9%. In general, the dynamics of changes in the total number of pharmacies in Ukraine can be divided into two periods. Thus, from 2009 to 2014 there was a negative trend in reducing this indicator. In 2014, the number of pharmacies decreased by 20.1% compared to the data of 2009. Without exaggeration, it should be noted that 2014 was the most difficult year for Ukraine since its independence in 1991. In 2014, there were serious changes in the territorial borders of the state (annexation of the Republic of Crimea), as well as combat activity in the Donetsk and Luhansk regions, which led to the loss of part of these territories, began. It should be noted that the Luhansk and especially the Donetsk region have always been considered to be the largest regional pharmaceutical markets in Ukraine. Their share (%) in different years was from 12.0% to 26.7% of pharmacy sales of medicines and pharmaceutical products at the national pharmaceutical market. Therefore, the decrease in number of pharmacy institutions in 2014 compared to the data of 2009 by 4684 (-20.1%) and 1213 institutions (-6.11%) compared to the data of 2013 is primarily due to the abovementioned political factors. Despite the systemic crisis in Ukraine in the following 2015 there was a tendency to increase the number of pharmacies at the pharmaceutical market. From this period, the second period of the pharmacy network development, which is of a complex nature, starts. At the same time, it should be noted that until 2017 the number of pharmacies increased at a slight rate (from 3.0% to 4.0% in 2016 and 2017, respectively). In 2018, the number of pharmacies again decreased insignificantly (<0.1%) compared to the previous year, and amounted to 210561 institutions. The positive fact is that the total number of pharmacies in Ukraine amounted to 20620 as of 01.01.2009, and it was 100.2% of the indicators of the last year.
It should be noted that despite the signs of financial recovery in the country and the decrease in the pressure of political risks on various spheres of the economic activity observed in the last 2-3 years, the
retail segment of the pharmaceutical market by the indicator of “the
number of pharmacies” in 2019 could not return to the data of
2009. In contrast to the general trend of reducing the number of pharmacy institutions during 2009-2014, the number of pharmacies in the same period increased steadily from 11,899 pharmacies in 2009 to 14,737 pharmacies in 2013. Thus, the growth rate in the
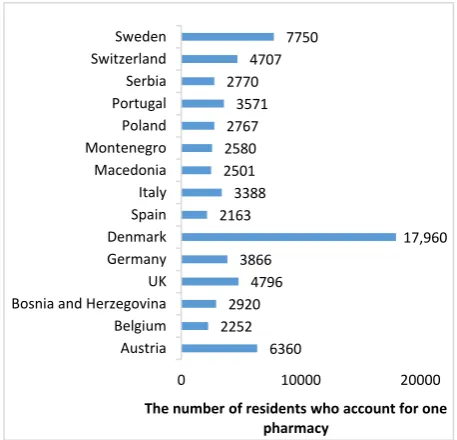
number of pharmacies in 2013 compared to the data of 2009 was 23.85% (2838 pharmacies). Due to the previously mentioned political causes the number of pharmacies sharply decreased in 2014 by 639 institutions or by 4.34% compared to the previous year. Since 2015, a systematic increase in pharmacies began until 2017. Thus, their number increased compared to the data of the crisis in 2014 by 15.54% or 2191 pharmacy. In 2018, the number of pharmacies insignificantly increased only by 33 pharmacies. In general, it should be noted that the number of pharmacies in 2018 compared to the data of 2009 increased by 36.62% or 4357 pharmacies. It is an important positive characteristic of the pharmacy network development in Ukraine. It should be noted that in the European Union (EU) the number of pharmacies in different countries varies in a fairly wide range of values (Fig.1). It depends on a range of factors, among them demographic factors should be distinguished, such as the number of inhabitants in the country, socio-economic, market factors, etc. (Fig. 2). [6,14] Undoubtedly,
the dominant role in the regulation of the number and order of placement of the pharmacy network in the EU belongs to the state. Branch pharmacies are the most important structural units within the structure of pharmacy institutions. Based on the current legislation in Ukraine, a branch pharmacy is defined as a structural unit of the pharmacy, which operates in hospitals, clinics and other institutions according to the license received by the pharmacy for the right to retail sale of drugs and pharmaceutical products.1 According to the analysis, the number
of pharmacies in Ukraine since 2009 decreased until 2012. Thus, in 2009 there were 5,833 of them, and in 2012 their number decreased by 18.9% compared to the data of the first year in the analysis. Already in 2013, the number of pharmacies increased by 8.31% up to 5124 institutions. This was due to the introduction of significant changes in the current legislation. According to this change in Ukraine, the sale of medicines and pharmaceutical products in pharmacy kiosks was prohibited since 2013, i.e. pharmacy kiosks ceased to function as a structural unit in pharmacy institutions from 01.01.2013.2 In the order of the Ministry of
Health of Ukraine, it is specified that the liquidation of pharmacy kiosks is caused by action of a number of factors, first of all, impossibility to render effective providing the population with pharmaceutical care. For example, pharmacy kiosks were not provided with the hall for visitors, there was no sanitary area for the pharmacy staff. The established standards of areas for kiosks were insufficient for organization of the effective work of pharmaceutical workers. In addition, due to the shortage of premises in the kiosks the rules for storing and dispensing medicines were often not observed. These changes in the legislation of Ukraine regulating the pharmaceutical activity in the retail segment of the market led to significant structural changes described above.
1 “On approval of Licensing conditions for conducting business activities for the production of medicinal products, wholesale and retail trade in medicinal products, import of medicinal products (except for active pharmaceutical ingredients)” Resolution of the Cabinet of Ministers of Ukraine No.929 dated November 30, 2016. [document on the Internet], [cited 2016 Nov 30]; Available from: https://zakon.rada.gov.ua/laws/show/929-2016-п.
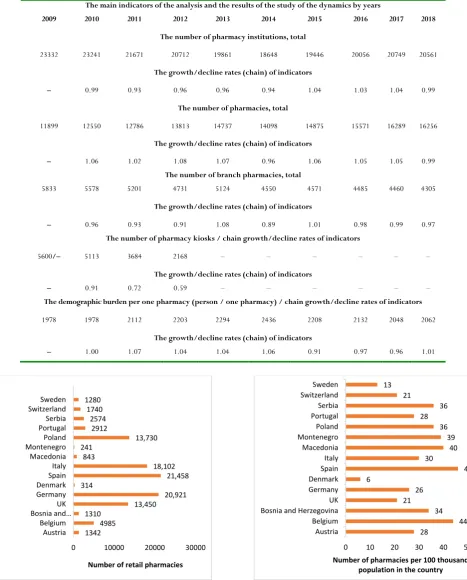
Table 2: Dynamics of changes in the actual number of residents of Ukraine during 2009-2018 according to the data of the State Statistics Service of Ukraine.
The main indicators of the analysis and the results of the study of the dynamics by years
2009 2010 2011 2012 2013 2014 2015 2016 2017 2018
The number of pharmacy institutions, total
23332 23241 21671 20712 19861 18648 19446 20056 20749 20561
The growth/decline rates (chain) of indicators
– 0.99 0.93 0.96 0.96 0.94 1.04 1.03 1.04 0.99
The number of pharmacies, total
11899 12550 12786 13813 14737 14098 14875 15571 16289 16256
The growth/decline rates (chain) of indicators
– 1.06 1.02 1.08 1.07 0.96 1.06 1.05 1.05 0.99
The number of branch pharmacies, total
5833 5578 5201 4731 5124 4550 4571 4485 4460 4305
The growth/decline rates (chain) of indicators
– 0.96 0.93 0.91 1.08 0.89 1.01 0.98 0.99 0.97
The number of pharmacy kiosks / chain growth/decline rates of indicators
5600/– 5113 3684 2168 – – – – – –
The growth/decline rates (chain) of indicators
– 0.91 0.72 0.59 – – – – – –
Thedemographic burdenper one pharmacy(person / one pharmacy) / chain growth/decline rates of indicators
1978 1978 2112 2203 2294 2436 2208 2132 2048 2062
The growth/decline rates (chain) of indicators
– 1.00 1.07 1.04 1.04 1.06 0.91 0.97 0.96 1.01
Figure 1: The number of pharmacies in different EU countries
(in 2017). Figure 2: Statistical indicators of development of pharmacy institutions in EU countries (in 2017).
The pharmaceutical market as a highly self-organized and economically flexible macrostructure quickly reacted to these regulatory changes in the legislation. Since 2009, the number of pharmacy kiosks in Ukraine steadily decreased. In 2012, their number (2,168 kiosks) decreased by 2.6 times compared to the
1342 4985 1310
13,450 20,921 314
21,458 18,102 843
241
13,730 2912
2574 1740 1280
0 10000 20000 30000
Austria Belgium Bosnia and…
UK Germany Denmark Spain Italy Macedonia Montenegro Poland Portugal Serbia Switzerland Sweden
Number of retail pharmacies
28
44 34 21
26 6
46 30
40 39 36 28
36 21
13
0 10 20 30 40 50
Austria Belgium Bosnia and Herzegovina UK Germany Denmark Spain Italy Macedonia Montenegro Poland Portugal Serbia Switzerland Sweden
data of 2009 (5,600 kiosks). The average rate (%) of decline in the number of pharmacy kiosks during 2009-2012 was 25.67%. Since 2014, which was a turning year for the development of the Ukrainian pharmacy network and the country as a whole, there was rather sharp (-11.2%) decrease in the number of branch pharmacies to 4,550 institutions. In 2015, their number insignificantly increased by only 21 (0.5%). Subsequently (in 2016, 2017, 2018) their number systematically decreased by 1.88%, 5.57%, and 3.48%, respectively, against the background of an increase in the number of pharmacies. Therefore, it can be argued that since 2015 in the retail segment of the Ukrainian pharmaceutical market there is a gradual reformatting of the structure of the pharmacy network in the direction of increasing the number of pharmacies. Next, the structural analysis of pharmacy institutions was conducted, and the following data were found. In 2009, the share of pharmacies was 51.0%, branch pharmacies –
25.0%, and pharmacy kiosks – 24.0%, respectively. In the 2010, there was a structural shift, and the share (%) of pharmacies increased up to 54.0% due to a decrease in the same indicator for branch pharmacies (24.0% vs. 25.0%) and kiosks (22.0% vs. 24.0%). Before the liquidation of pharmacy kiosks in 2013, the trend of a systematic increase in the share (%) of pharmacies continued against the background of a rapid decrease in the share of kiosks (in 2011 – 17.0%, in 2012 – 11.0%). Since 2013 there was a systematic increase in the share (%) of pharmacies in the structure of pharmacy institutions. Already in 2013, this figure was 74.0%, in 2014-2015 – 76.0%, in 2016 – 78.0%, and within 2017-2018 –
79.0%. If one is guided by the statement that rendering pharmaceutical care to the population in the conditions of a pharmacy is carried out at more qualified level than in the conditions of a branch pharmacy, the above tendency of increasing the specific weight of pharmacies (%) in the retail segment of the market should be noted as positive.
Finally, the demographic burden per one pharmacy in Ukraine was analyzed. As you can see from Table 2, in Ukraine this figure ranged from 1978 (in 2009 and 2010) to 2436 (in 2014) residents per a pharmacy institution. Thus, the variation of this indicator was 23.16%. If we compare these figures with the similar data in the EU, the following conclusion can be made. In most EU countries, the state applies the mechanisms of administrative regulation of the pharmacy chain. The most known mechanisms include the number of residents per one pharmacy institution (demographic burden) and the geographical ones (the minimum distance to the nearest pharmacy). [5,6,14] With the exception of Denmark, which has about
300 pharmacies per 5.3 million inhabitants, the demographic burden per one pharmacy ranged from 2,163 (Spain) to 7,750 (Sweden) (Fig. 3).
Figure 3: The indicators of the demographic burden per one pharmacy in the EU countries (in 2017).
In Ukraine, at present the state does not regulate the order of placement of the pharmacy network with the help of demographic and geographical parameters, i.e. pharmacies are placed exclusively in accordance with the requirements of the market. As you can see from Fig. 3, the indicators of the demographic burden per one pharmacy in the EU countries varied over a wide range of values. In Ukraine, the average value of this indicator calculated according to the data during 2009-2018 was 2145 inhabitants. This indicator is comparable with the similar data obtained in Poland, Belgium, Montenegro, Macedonia, etc., (Fig. 3). Taking into account the European integration intentions of Ukraine to join the EU this characteristic of the pharmacy network development looks positive and gives some prospects on the eve of serious legal changes that are planned to be introduced by the Ukrainian government in 2019. In the near future, the retail segment of the pharmaceutical market in Ukraine expects significant changes associated with the introduction of new regulation. Thus, in 2018, the draft law №.
8591 “On amendments to the Law of Ukraine “On medicines” to
provide the economic competition and protect the rights of patients
in retail sale of medicines” was submitted for the first consideration to the Supreme Council of Ukraine. This draft law establishes new conditions for the retail sale of medicines and pharmaceutical products for the Ukrainian pharmaceutical business. First, it is expected to introduce a geographical parameter when placing the pharmacy network, as a minimum distance (500 meters) between two pharmacies. In addition, the number of pharmacy institutions in pharmacy chains is limited depending on the form of ownership and the range of drugs that are sold in them. Individuals, as business entities, as well as medical and obstetric stations in villages can have one pharmacy, while legal persons –
maximum 4 companies in the pharmacy network. Pharmacies that are engaged in the manufacture of drugs by prescriptions of doctors, as well as those engaged in the sale of narcotic, psychotropic drugs and precursors can have the maximum 8 pharmacy institutions in the network. In addition, the state initiated the introduction of norms, according to which the
6360 2252
2920 4796 3866
17,960 2163
3388 2501 2580 2767 3571 2770
4707 7750
0 10000 20000
Austria Belgium Bosnia and Herzegovina UK Germany Denmark Spain Italy Macedonia Montenegro Poland Portugal Serbia Switzerland Sweden
owner of the pharmacy must have the following: pharmaceutical education not lower than the second (Master)
level in the specialty “Pharmacy”; a certificate of a pharmacist -specialist, which is issued by the institution of postgraduate education and confirmed the appropriate level of qualification. As you can see, this draft law contains provisions that have been in force for many years in most EU countries. It should be noted that similar regulations in the retail segment of the pharmaceutical market were introduced in Poland. [6, 14]
According to experts, the introduction of mechanisms of the state regulation of the pharmacy network placement had serious consequences in Poland, first of all, for formation of the availability of pharmaceutical care provided to the population.
Conclusion
As a result of the study conducted, it can be argued that within 2009-2018 the Ukrainian segment of the retail pharmaceutical market has demonstrated, on the one hand, a significant dependence on external factors of influence (political, financial and economic risks, social crisis, the beginning of hostilities in the South-East of the country, the annexation of the Republics of Crimea). On the other hand, this segment of the national pharmaceutical market has shown the ability to respond quickly and flexibly to changing conditions in the introduction of activities in the retail pharmaceutical market. Therefore, the results of our research are important when forming a scientifically based assessment of efficiency of implementation of the above innovations in the regulation of retail sales of drugs and pharmaceutical products, which are planned to be introduced by the government this year, at the Ukrainian pharmaceutical market.
Conflict of Interest
The authors declare no conflict of interests
.
References
1. World Health Organization. WHO guideline on
country pharmaceutical pricing policies. World Health
Organization; 2015. [document on the Internet], [cited
2015 Mar 2]; Available from:
http://apps.who.int/medicinedocs/documents/s2101 6en/s21016en.pdf
2. National Drug Policy. First revision 2003. [document on the Internet], [cited 2003 Jun 2]; Available from: http://apps.who.int/medicinedocs/documents/s1645 0e/s16450e.pdf
3. Alla N., Ivan T., Maryna P., Yuliya K., Yuliya Z. Legal and оrganizational еconomic аspects of the functioning of the main models of health-сare systems. Asian Journal of Pharmaceutics. 2018; 12 (3):937-45.
4. Cross J, MacGregor HN. Knowledge, legitimacy and
economic practice in informal markets for medicine: a critical review of research. Social Science & Medicine. 2010 Nov 1;71(9):1593-600.
5. Sood N, De Vries H, Gutierrez I, Lakdawalla DN,
Goldman DP. The effect of regulation on
pharmaceutical revenues: experience in nineteen countries. Health Aff (Millwood). [serial on the Internet]. 2009 [cited 2009 Jan 15]; 28(1): Available from:
https://www.ncbi.nlm.nih.gov/pmc/articles/PMC38 29766/
6. Świeczkowski D, Merks P, Cwalina N, Jaguszewski M.
Development of pharmacy practice in European
countries—the Polish perspective. Pharmacy. 2017
Sep;5(3):43. Available from:
https://www.mdpi.com/2226-4787/5/3/43/htm
7. Eades CE, Ferguson JS, O'Carroll RE. Public health in
community pharmacy: a systematic review of pharmacist and consumer views. BMC public health.
2011 Dec;11(1):582. Available from:
https://www.ncbi.nlm.nih.gov/pmc/articles/PMC31 46877/
8. Perehudoff SK, Toebes B, Hogerzeil H. Essential
medicines in national constitutions: Progress since 2008. Health and human rights. 2016 Jun;18(1):141.
9. World Health Organization. How to develop and
implement a national drug policy. World Health
Organization; 2001. [document on the Internet], [cited
2002 Feb 2]; Available from:
http://apps.who.int/iris/bitstream/handle/10665/42 423/924154547X.pdf;jsessionid=30530657787C282C 357A139CC29EA7F1?sequence=1
10. Karanikolos M, Mladovsky P, Cylus J, Thomson S, Basu
S, Stuckler D, Mackenbach JP, McKee M. Financial crisis, austerity, and health in Europe. The Lancet. 2013 Apr 13;381(9874):1323-31.
11. Mahmić-Kaknjo M, Jeličić-Kadić A, Utrobičić A, Chan
K, Bero L, Marušić A. Essential medicines availability is
still suboptimal in many countries: a scoping review. Journal of clinical epidemiology. 2018 Jun 1;98:41-52.
12. Khan TM. Challenges to pharmacy and pharmacy
practice in Pakistan. The Australasian medical journal. 2011;4(4):230.
13. Splawski J, Minger H. Value of the pharmacist in the
medication reconciliation process. Pharmacy and Therapeutics. 2016 Mar;41(3):176.
14. Pogorzelczyk K, Synoweć J, Robakowska M, Ślęzak D,
Holajn P, Robakowski P, Żuratyński P, Nadolny K.
Pharmaceutical markets regulation overview of the selected European Union countries. Wiadomosci lekarskie (Warsaw, Poland: 1960). 2018;71(7):1404-8.
15. Taher A, Stuart EW, Hegazy I. The pharmacist's role in
Journal of Pharmaceutical and Healthcare Marketing.
2012 Jun 22;6(2):140-55.
16. Khan MM, Grübner O, Krämer A. Frequently used
healthcare services in urban slums of Dhaka and adjacent rural areas and their determinants. Journal of Public Health. 2012 Jan 12;34(2):261-71.
17. Miller R, Goodman C. Performance of retail
pharmacies in low-and middle-income Asian settings: a systematic review. Health policy and planning. 2016 Mar 8;31(7):940-53.
18. Chua SS, Lim KP, Lee HG. Utilisation of community
pharmacists by the general public in Malaysia. International Journal of Pharmacy Practice. 2013 Feb;21(1):66-9.
19. Bloom G, Standing H, Lucas H, Bhuiya A, Oladepo O,
Peters DH. Making health markets work better for poor people: the case of informal providers. Health policy
and planning. 2011 Jul 1;26(suppl_1):i45-52.
20. Rayes IK, Hassali MA, Abduelkarem AR. The role of
pharmacists in developing countries: the current scenario in the United Arab Emirates. Saudi Pharmaceutical Journal. 2015 Oct 1;23(5):470-4.
21. Bush PW, Daniels R. Health Care Systems and
Transitions of Care Implication on Interdisciplinary Pharmacy Services. North Carolina medical journal. 2017 May 1;78(3):177-80.
22. Aditya S, Rattan A. Minimizing pharmaceutical waste:
the role of the pharmacist. Journal of Young Pharmacists. 2014 Jul 1;6(3):14.
23. Cantrell L, Suchard JR, Wu A, Gerona RR. Stability of
active ingredients in long-expired prescription medications. Archives of internal medicine. 2012 Nov 26;172(21):1685-7.
24. Nkansah N, Mostovetsky O, Yu C, Chheng T, Beney J,
Bond CM, Bero L. Effect of outpatient pharmacists'
non‐dispensing roles on patient outcomes and
prescribing patterns. Cochrane database of systematic
reviews. 2010(7). Available from:
https://www.cochranelibrary.com/cdsr/doi/10.1002 /14651858.CD000336.pub2/full
25. Urick B, Brown P, Easter JC. Achieving better quality
and lower costs in Medicaid through enhanced pharmacy services. North Carolina medical journal. 2017 May 1;78(3):188-9.
26. Sadek MM, Elnour AA, Al Kalbani NM, Bhagavathula
AS, Baraka MA, Aziz AM, Shehab A. Community pharmacy and the extended community pharmacist practice roles: The UAE experiences. Saudi Pharmaceutical Journal. 2016 Sep 1;24(5):563-70.
27. Larsson M, Binh NT, Tomson G, Chuc NT, Falkenberg
T. Private pharmacy staff in Hanoi dispensing steroids-theory and practice. Pharmacy practice. 2006 Apr;4(2):60.
28. Dnyanesh Limaye, Vaidehi Limaye, Gerhard Fortwengel, Gerard Krause. Self-medication practices
in urban and rural areas of western India: a cross sectional study Int. J. Community. Med. Public Health. 2018 ;5(7):2672-85.
29. Keshari SS, Kesarwani P, Mishra M. Prevalence and
pattern of self-medication practices in rural area of Barabanki. Indian J Clin Pract. 2014 Dec;25(7):636-9.
30. Rubio-Valera M, Chen T, O'Reilly C. New roles for
pharmacists in community mental health care: a narrative review. International journal of environmental research and public health. 2014 Oct;11(10):10967-90.
31. de Barra M, Scott CL, Scott NW, Johnston M, de Bruin
M, Nkansah N, Bond CM, Matheson CI, Rackow P,
Williams AJ, Watson MC. Pharmacist services for non‐
hospitalised patients. Cochrane Database of Systematic
Reviews. 2018(9). Available from:
https://www.cochranelibrary.com/cdsr/doi/10.1002 /14651858.CD013102/epdf/full
32. Patwardhan PD, Amin ME, Chewning BA. Intervention
research to enhance community pharmacists' cognitive services: a systematic review. Research in Social and Administrative Pharmacy. 2014 May 1;10(3):475-93.
33. Latif A, Waring J, Watmough D, Barber N, Chuter A,
Davies J, Salema NE, Boyd MJ, Elliott RA. Examination of England's New Medicine Service (NMS) of complex health care interventions in community pharmacy. Research in Social and Administrative Pharmacy. 2016 Nov 1;12(6):966-89.
34. Kafle KK, Karkee SB, Shrestha N, Prasad RR, Bhuju
GB, Das PL, Shrestha AD, Ross-Degnan D. Improving private drug sellers' practices for managing common health problems in Nepal. Journal of Nepal Health Research Council. 2013 May;11(24):198-204.
35. Hussain A, Ibrahim MI. Medication counselling and
dispensing practices at community pharmacies: a comparative cross sectional study from Pakistan. International journal of clinical pharmacy. 2011 Oct 1;33(5):859.
36. Bang S, Sontakke S, Thawani V. Pre and
post-interventional pattern of self medication in three common illnesses in staff of a tertiary hospital. Indian journal of pharmacology. 2011 May;43(3):275.
37. Mohiuddin AK. Pharmacists in Critical Care.
INNOVATIONS in pharmacy. 2019 Feb 7;10(1):8-.
38. Awad AI, Eltayeb IB, Capps PA. Self-medication
practices in Khartoum state, Sudan. European journal of clinical pharmacology. 2006 Apr 1;62(4):317.
39. Hemsley S. Developing the role of the critical care pharmacist. The Pharmaceutical Journal 15 January, 2018
40. Al-Faham Z, Habboub G, Takriti F. The sale of
antibiotics without prescription in pharmacies in Damascus, Syria. The Journal of Infection in Developing Countries. 2011 Mar 4;5(05):396-9.
41. Basak SC, Sathyanarayana D. Evaluating medicines
Tamilnadu, India. Southern Med Review. 2010 Oct 1;3(2):27-31.
42. Ermolaev OYu. Mathematical statistics for psychologists. Kiev: Osvita; 2003.
43. Golovach AV, Zakhozay VB, Golovach NA, Shepitko GF. Financial Statistics (Basic theory of statistics). Tteach. manual. Kiev: MAUP; 2002.