https://doi.org/10.5194/gmd-11-2315-2018 © Author(s) 2018. This work is distributed under the Creative Commons Attribution 4.0 License.
The implementation of NEMS GFS Aerosol Component (NGAC)
Version 2.0 for global multispecies forecasting at NOAA/NCEP –
Part 1: Model descriptions
Jun Wang1, Partha S. Bhattacharjee2, Vijay Tallapragada1, Cheng-Hsuan Lu3, Shobha Kondragunta4, Arlindo da Silva5, Xiaoyang Zhang6, Sheng-Po Chen3, Shih-Wei Wei3, Anton S. Darmenov5, Jeff McQueen1, Pius Lee7, Prabhat Koner8, and Andy Harris8
1NOAA/NWS National Centers for Environment Prediction, College Park, MD 20740, USA
2I. M. Systems Group, INC. at NOAA/NWS National Centers for Environment Prediction, College Park, MD 20740, USA 3University at Albany, State University of New York, Albany, NY 12222, USA
4NOAA/NESDIS Satellite Applications and Research Center, College Park, MD 20740, USA 5NASA Goddard Space Flight Center, Greenbelt, MD 20771, USA
6South Dakota State University, Brookings, SD 57007, USA
7NOAA/OAR Air Resource Laboratory, College Park, MD 20740, USA
8University of Maryland, Earth System Science Interdisciplinary Center, College Park, MD 20740, USA
Correspondence:Jun Wang ([email protected])
Received: 10 December 2017 – Discussion started: 22 December 2017 Revised: 27 April 2018 – Accepted: 2 May 2018 – Published: 19 June 2018
Abstract.The NEMS GFS Aerosol Component Version 2.0 (NGACv2) for global multispecies aerosol forecast has been developed at the National Centers of Environment Predic-tion (NCEP) in collaboraPredic-tion with the NESDIS Center for Satellite Applications and Research (STAR), the NASA God-dard Space Flight Center (GSFC), and the University at Al-bany, State University of New York (SUNYA). This paper describes the continuous development of the NGAC system at NCEP after the initial global dust-only forecast imple-mentation (NGAC version 1.0, NGACv1). With NGACv2, additional sea salt, sulfate, organic carbon, and black car-bon aerosol species were included. The smoke emissions are from the NESDIS STAR’s Global Biomass Burning Prod-uct (GBBEPx), blended from the global biomass burning emission product from a constellation of geostationary satel-lites (GBBEP-Geo) and GSFC’s Quick Fire Emission Data Version 2 from a polar-orbiting sensor (QFED2). This im-plementation advanced the global aerosol forecast capability and made a step forward toward developing a global aerosol data assimilation system. The aerosol products from this sys-tem have been used by many applications such as for regional air quality model lateral boundary conditions, satellite sea surface temperature (SST) physical retrievals, and the global
solar insolation estimation. Positive impacts have been seen in these applications.
1 Introduction
In addition to the effect on the atmospheric energy bud-get, the composition and size distribution of aerosols im-pact their effectiveness as cloud condensation nuclei (CCN) and result in variations of the distribution of CCN (Mircea et al., 2002). The change in the cloud properties further impacts cloud albedo, cloud lifetime, precipitation, and vertical atmo-spheric heating profile, etc. (Twomey, 1977; Albrecht, 1989; Lohmann and Feichter, 2005; Rosenfeld, 2006; Stevens and Feingold, 2009). To represent the diverse aerosol properties and estimate their effects on physical radiation and cloud pro-cesses, typical aerosol size distributions are adopted. The ef-fect of the physical processes involving aerosols is not lim-ited to climate studies but also affects other earth science sys-tems. Polluted air with an increased amount of aerosols tends to generate bright clouds reducing precipitation efficiently, which then leads to a weak regional hydrological cycle that affects the quality of fresh water over the tropics and the sub-tropics, especially in the Asian region, which has large tropi-cal and subtropitropi-cal aerosol emission sources (Ramanathan et al., 2001). Minerals such as nitrogen, phosphorus, and iron that are deposited on land and oceans due to aerosol landing may stimulate productivity in some land ecosystems (e.g., tropical forecast) and marine ecosystems, enhancing CO2
in-take and the biogeochemical cycles (Jickells et al., 2005; Ma-howald, 2011).
Aerosol impact on weather prediction has been investi-gated extensively in recent years. Many studies show that aerosols may have a significant impact on severe weather events. Rosenfeld et al. (2012) indicated that microphysi-cal and thermodynamic effects from aerosols have a sig-nificant impact on tropical cyclone development. Wang (2014) showed that anthropogenic aerosols from Asian pol-lution increased the precipitation and poleward heat trans-port, thereby intensifying the Pacific storm track. Saide et al. (2015) analyzed historical tornado outbreak data in central America and concluded that an increase in aerosols in this re-gion can induce tornado outbreaks when atmospheric condi-tions are favorable for severe thunderstorm development. Fan et al. (2015) also showed that anthropogenic aerosols con-tributed to catastrophic floods in southwest China in 2013. These studies illustrate the importance of including a more realistic treatment of aerosol–cloud interactions in numerical weather prediction (NWP) models.
Many major NWP operational centers around the world have started to investigate the impact of aerosol on medium-range global weather forecasting. Tompkins et al. (2005) showed that an updated dust climatology leads to a northward shift of the African Easterly Jet (AEJ) in the European Cen-tre for Medium-Range Weather Forecasts (ECMWF) NWP model, which agrees with the observations. Their study con-firmed that a better representation of the seasonal distribution of aerosol (especially dust) improves the model mean state and local surface weather forecast skill. Reale et al. (2011) studied the impact of aerosol on global weather forecast skill using NASA’s Goddard Earth Observing System
ver-sion 5 (GEOS-5) and confirmed that forecasts with inter-active aerosol radiation effects predicted a more realistic thermal structure and AEJ location in the African monsoon region. They suggested designing an event-focused system to activate aerosol radiation interaction in a global forecast model when there is a strong aerosol event. Grell and Bak-lanov (2011) suggested that a fully coupled chemical and weather forecast model should be used for weather forecasts and air quality predictions due to the positive improvement observed in temperature and wind forecasts during wild fire events. Therefore, in order to achieve better forecast perfor-mance, comprehensive representations of aerosol direct and indirect effects and aerosol-aware physics schemes are re-quired in high-resolution weather forecast models. Mulcahy et al. (2014) investigated aerosol complexity in the global NWP configuration of the Met Office Unified Model (Me-tUM). They concluded that aerosol species treated as prog-nostic variables help to predict aerosol events, and when the direct and indirect aerosol effects are represented in the model the radiation bias is reduced and the regional temper-ature and height forecast is improved for the aerosol events. Zhang et al. (2016) investigated the changes in solar radiation forcing from a smoke event and the corresponding changes in surface cooling and model bias. However, they found that the inclusion of realistic smoke aerosol fields in the forecast model itself is not sufficient to get significant improvement in surface temperature forecasts considering the current range for model temperature uncertainty.
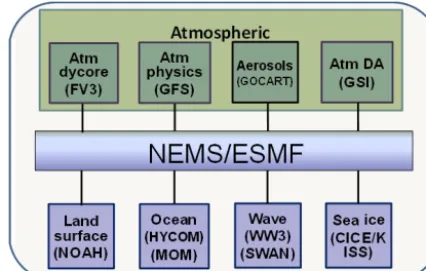
A unified modeling framework for both weather forecast and climate prediction is under development at the National Centers for Environmental Prediction (NCEP). Specifically, NCEP has been developing NOAA Environmental Model-ing System (NEMS) as its next-generation operational sys-tem (Black et al., 2007, 2009) and has collaborated with the NASA/Goddard Space Flight Center (GSFC) to develop the NEMS GFS Aerosol Component (NGAC) for predicting the distribution of atmospheric aerosols (Lu et al., 2010). Im-plemented in 2012, NGAC version 1 provided the first oper-ational global dust aerosol forecasting capability at NCEP (Lu et al., 2016). It used an in-line aerosol module based on the Goddard Chemistry Aerosol Radiation and Trans-port (GOCART) model within GEOS-5. The system was built upon the Earth System Modeling Framework (ESMF), which provided the techniques to implement exchangeable and reusable earth science system components. The atmo-sphere model was equivalent to the 2010 operational GFS but running at a lower resolution (T126, approximately 100 km). The model provided a 5-day dust-only forecast globally at a 1◦×1◦resolution once per day at 00:00 coordinated univer-sal time (UTC).
(UAl-bany). In Sect. 2, we describe the NGACv2 model config-uration. In Sect. 3, we present the operational implemen-tation of NGACv2. In Sect. 4, we present some results of NGACv2 forecasts. In Sect. 5, we demonstrate three exam-ples of NGACv2 downstream applications. Section 6 pro-vides concluding remarks. Detailed NGACv2 verification will be presented in a companion paper (Bhattacharjee et al., 2018).
2 Model descriptions
NGAC is an interactive atmospheric aerosol forecast system with the NEMS global spectral model (NEMS GSM) as the atmosphere model and GOCART as the aerosol model. The system was built upon the ESMF infrastructure to stream-line the subcomponents in the earth system. NEMS GSM has been developed at NCEP to implement the standalone global forecast system (GFS) in the NEMS framework since 2006 (Black et al., 2007, 2009). NGAC shares the same global forecast system with NEMS GSM. Detailed information on the NEMS GSM can be found in NGACv1 (Lu et al., 2016). The major model updates from NGACv1 to NGACv2 are listed below.
2.1 Updates in NEMS GSM
The physics package in NEMS GSM has been updated to the operational GFS physics package for each GFS implemen-tation until NEMS GSM was implemented into operation in 2017. There have been several important physics updates in NEMS GSM since NGACv1 was implemented in 2012. Dur-ing NGACv2 development, the GFS physics package was implemented into operations in January 2015 with slightly improved performance, and this version of the physics pack-age was implemented into NEMS GSM in October 2015. NGACv2 uses the same physics package as the 2015 version of the operational GFS. Major GFS physics updates since 2012 are listed below.
First, the radiation package Rapid Radiative Transfer Model (RRTM) was upgraded to the Monte Carlo Inde-pendent Column Approximation (McICA) radiation package (Pincus et al., 2003). The new radiation package can address sub-grid cloud variability; in particular, it can be applied to the situation with vertically overlapping fractional clouds and when the cloud condensates form inhomogeneously. The planetary boundary layer (PBL) scheme is updated to the hybrid eddy-diffusivity mass-flux (EDMF) scheme (Han et al., 2016).
Besides the updates in the radiation package and PBL scheme, changes are also made in the land surface scheme. The prescribed soil moisture climatology used in the soil moisture nudging scheme is upgraded from NCEP Climate Prediction Center (CPC)’s bucket soil moisture climatology to the climatology derived from the NCEP Climate Forecast
System (CFS) and Global Land Data Assimilation (GLDAS). To enhance the weak land–atmosphere coupling strength in the GFS, the ratio of thermal-to-momentum roughness is modified as a function of vegetation type. A look-up table based on the vegetation type replaced the 1.0◦ momentum roughness length climatology to better describe the rough-ness length. As in NGACv1 (Lu et al., 2016), the NGACv2 uses the relaxed Arakawa–Schubert scheme with enhanced tracer treatment (the RAS scheme; Moorthi and Suarez, 1992, 1999) which provides the convective mass fluxes at each model layer in the cloud for vertical aerosol transport. The NEMS GSM uses the simplified Arakawa–Schubert scheme (the revised SAS scheme; Han and Pan, 2011) where these convective mass fluxes are currently not available.
2.2 Aerosol model
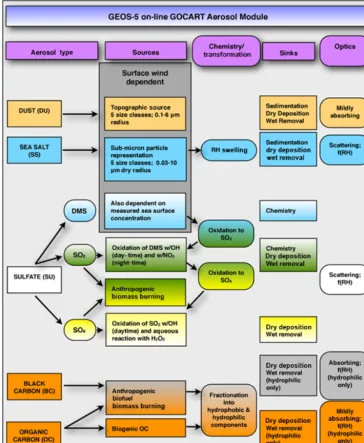
In 2012, NCEP implemented NASA/GSFC’s GOCART aerosol module (Colarco et al., 2010) into NGACv2 and NCEP operations. The GOCART module in NGACv1 can simulate atmospheric aerosols (including sulfate, black car-bon (BC), organic carcar-bon (OC), dust, and sea salt), and sul-fur gases (Chin et al., 2000a, b, 2002, 2003, 2004, 2007, 2009; Ginoux et al., 2001, 2004; Bian et al., 2010; Colarco et al., 2010; Kim et al., 2013), but only the dust module is turned on in NGACv1. In NGACv2 the GOCART module is updated and the suite of aerosol components is turned on to predict a wider range of aerosols. Figure 1 shows the sum-mary of the in-line GOCART aerosol module that is used in GOES-5 and NGACv2. Details of aerosol loss processes for all components including dry deposition, wet removal, and convective scavenging processes are specified in Chin et al. (2002). In NGACv2, a computational error on dust aerosol optical depth (AOD) calculation is fixed, and the removal process has been tuned to improve model performance. Black carbon and organic carbon aerosols are tracked separately in GOCART. The organic carbon is presented as particulate organic matter. The chemical processing of carbonaceous aerosols as a conversion from a hydrophobic to hydrophilic mode follows Cooke et al. (1999) and Chin et al. (2002) with ane-folding timescale of 2.5 days (Maria et al., 2004). Fol-lowing Colarco (2014), five size bins of sea salt aerosol par-ticles with a dry radius range of 0.03–10 mm are considered for an indirect production mechanism from bursting bubbles (Monahan et al., 1986), as modified by Gong (2003). Four sulfate tracers, i.e., dimethyl sulfide (DMS), SO2, SO4, and
methane sulfonic acid (MSA) are tracked. Sulfate chemistry includes the DMS oxidation by OH during the day and by NO3at night to form SO2and SO2oxidation by OH in the
gas phase and by H2O2in the aqueous phase to form sulfate,
Figure 1.Summary of aerosol modules in GEOS5 (Colarco et al., 2010). This aerosol module is adopted NGACv2. (Provided by Peter Colarco, NASA/GSFC, 2014).
2.3 Emissions
With the exception of biomass burning emissions, NGACv2 adopts GEOS-5 GOCART aerosol emissions. Emissions of carbonaceous aerosols and SO2 from biomass burning are
obtained from Global Biomass Burning Emission Product-extended (GBBEPx) described in Zhang et al. (2014). GBBEPx emissions are blended from NESDIS’s Global Biomass Burning Emission Product from a constellation of geostationary satellites (GBBEP; Zhang et al., 2012) and GMAO’s Quick Fire Emissions Data Version 2 from polar-orbiting satellites (QFED2; Darmenov and da Silva, 2015). GBBEPx provides global emissions for CO2, CO, OC, BC,
PM2.5, and SO2 daily. The operational implementation of
GBBEPx product at NESDIS enables NCEP to upgrade NGAC from dust-only to multispecies aerosol forecasts (in-cluding dust, sea salt, sulfate, and carbonaceous aerosols).
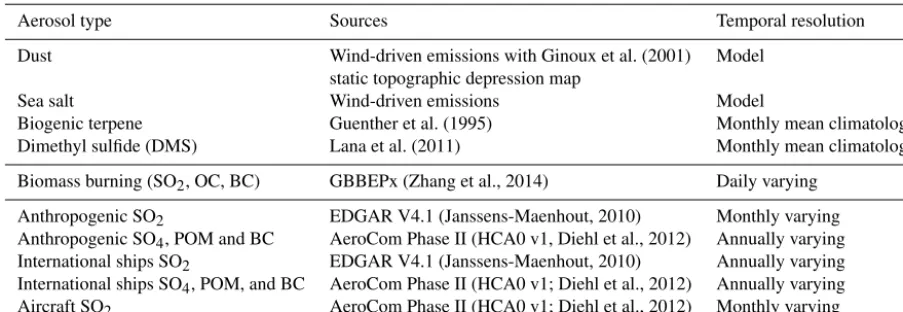
Table 1 summarizes the emissions for different aerosol types used by the GOCART aerosol module in NGACv2. Emissions datasets are re-gridded to the native model grid (i.e., T126 Gaussian grid, about 100 km horizontal resolu-tion). The emission sources/algorithms used for each species are as follows:
– For sulfate aerosols, primary emissions of DMS, SO2,
emis-Table 1.Aerosol and precursor emissions in NGACv2.
Aerosol type Sources Temporal resolution
Dust Wind-driven emissions with Ginoux et al. (2001) Model
static topographic depression map
Sea salt Wind-driven emissions Model
Biogenic terpene Guenther et al. (1995) Monthly mean climatology
Dimethyl sulfide (DMS) Lana et al. (2011) Monthly mean climatology
Biomass burning (SO2, OC, BC) GBBEPx (Zhang et al., 2014) Daily varying
Anthropogenic SO2 EDGAR V4.1 (Janssens-Maenhout, 2010) Monthly varying
Anthropogenic SO4, POM and BC AeroCom Phase II (HCA0 v1, Diehl et al., 2012) Annually varying
International ships SO2 EDGAR V4.1 (Janssens-Maenhout, 2010) Annually varying
International ships SO4, POM, and BC AeroCom Phase II (HCA0 v1; Diehl et al., 2012) Annually varying
Aircraft SO2 AeroCom Phase II (HCA0 v1; Diehl et al., 2012) Monthly varying
sions are taken from NESDIS GBBEPx dataset de-scribed above. Anthropogenic emissions of SO2 are
taken from the Emissions Database for Global At-mospheric Research (EDGAR), version 4.1 (Janssens-Maenhout, 2010). For anthropogenic emissions of pri-mary sulfate, the AeroCom Phase II dataset (HCA0 v1, Diehl et al., 2012) is used. SO2emissions from
ocean-going ships are taken from EDGAR v4.1, and ship SO4
emissions, taken from AeroCom Phase II (HCA0 v1), are derived from gridded emissions dataset of Eyring et al. (2005) using the EDGAR v4.1 SO2 ship
emis-sions. Aircraft emissions of SO2 are derived from the
AeroCom Phase II (HCA0 v1), which in turn is based on NASA’s Atmospheric Effects of Aviation Program (AEAP) inventory. DMS emissions from marine algae are calculated from DMS concentrations and water-to-air transfer velocity (piston velocity). Monthly varying DMS concentrations are taken from Lana et al. (2011). Piston velocity is computed from 2 m temperature and 10 m wind following the empirical formula from Liss and Merlivat (1986).
– The sources for carbonaceous aerosols arise from an-thropogenic and natural sources, including biomass burning, fossil fuel, biofuel, and (in the case of OC) from the oxidation of biogenic emissions. Biomass burning sources are taken from daily GBBEPx dataset described above. For anthropogenic emissions, the Ae-roCom Phase II dataset (HCA0 v1) is used. This dataset is based on a gridded inventory from Bond et al. (2004) and yearly global emission trends compiled from Streets et al. (2008, 2009). Ship emissions are determined in the same way as for SO4 (AeroCom Phase II, HCA0
v1). Emissions of terpene from vegetation are oxidized to produce OC aerosols. Biogenic emissions are treated following Chin et al. (2002) using a monthly varying Global Emissions Inventories Activity (GEIA) inven-tory (Guenther et al., 1995).
– For natural aerosols, the emissions are largely driven by variability in model dynamics (specifically, the sur-face wind). Dust emissions use a map of potential dust source locations based on topographic depressions (Gi-noux et al., 2001). The uplifting of dust aerosols de-pend on the wind speed formulation of Marticorena and Bergametti (1995). The parameterization of sea salt emissions follows the formulation of Gong (2003). Time frequency of emissions differs between different sources. Both dust and sea salt have wind-speed-dependent emissions, updated every time step. Biomass burning emis-sions from GBBEPx are updated daily. For other emisemis-sions, annually and monthly varying emissions are temporally in-terpolated using linear interpolation. For instance, anthro-pogenic carbonaceous and primary sulfate aerosols emis-sions from AeroCom Phase II, HCA0 v1 cover the period 1976–2006. For retrospective NGACv2 experiments, emis-sions are linearly interpolated between the available years. For real-time NGACv2 forecasts, the latest available emis-sions (2006 emisemis-sions) are used.
3 NGAC Version 2 operational implementation
A phased implementation approach is used for the NGAC implementation at NCEP. The first implementation was for dust-only forecasts. The current NGACv2 implementation documented here enabled the capability of multispecies aerosol forecast including carbonaceous aerosols, sea salt and sulfate aerosols. An aerosols data analysis system capa-bility is under development targeted for the third phase of the NGAC upgrade. The phased implementation also includes both science and software upgrades in the global forecast system.
fore-casts, twice per day for the 00:00 and 12:00 UTC cycles. The NGACv2 initial conditions are taken from the 12 h NGACv2 forecast from the previous cycle, while meteorological initial conditions are from the downscaled high-resolution Global Data Assimilation System (GDAS) analysis.
As specified in Sect. 2, the NGACv2 has an atmosphere model updated to the latest GFS, implemented in May 2016. However, NGACv2 uses the same configuration as opera-tional GFS except a different convection scheme. NGACv2 provides products in addition to those from NGACv1 dust-related products. First, total AOD and AOD from each species are produced to support global and regional multi-model ensemble aerosol forecasts. Second, single scattering albedo and asymmetric factor for total aerosols at 340 nm are produced to support a UV index forecast. Third, three-dimensional mixing ratios for each aerosol species at model levels are produced to support NCEP’s operational regional Community Multiscale Air Quality model (CMAQ) and satellite sea surface temperature (SST) retrieval. A complete list of the new output fields is in Appendix A.
4 NGAC Version 2 results
In this section, the results for the emissions and budgets from operational NGACv2 forecasts and a case study are pre-sented. A detailed NGACv2 performance review is presented in a separate companion paper (Bhattacharjee et al., 2018).
4.1 Budgets
A retrospective NGACv2 run was conducted for the June 2015 to February 2017 period. Figure 2 shows the global annual emission, burden, and lifetime (or atmospheric resi-dence time) calculated from NGACv2, relative to other sim-ilar global aerosol models, including GEOS-4 (Colarco et al., 2010), the models participating in the AeroCom model intercomparison studies (Textor et al., 2006) and NGACv1 (for the case of dust).
Large differences are found in emissions, burdens, and lifetimes within the AeroCom models, which are primarily related to the differences in the emission parameterizations, the particle sizes, the meteorological fields and model con-figuration used in the individual models (Textor et al., 2006). The simulated total emissions, annual burden, and lifetime of all the aerosol species in NGACv2 are within the range of the AeroCom models. The dust emissions, annual bur-den and lifetime are shown in the column a in upper three plots in Fig. 2. The first bar is the field from NGACv2 and the fourth bar is same field from NGACv1. Compared to NGACv1, NGACv2 has larger dust emissions due to GFS physics updates (2379 vs. 1980 Tg yr−1). In NGACv2, the dust lifetime is longer than NGACv1 (7.45 vs. 4.3 days) and the annual burden is about 50 % more than NGACv1 (30.6 vs. 21.9 Tg), but closer to in-line GOCART in GEOS-4 (30.7
vs. 31.6 Tg). These results suggest that dust in NGACv2 is closer to GEOS-4 dust when compared to NGACv1. Sea salt emission is lower than in GEOS-4 (8660 vs. 9729 Tg yr−1),
and its burden lifetime is slightly less than that in GEOS-4. In NGACv2, the emissions of black carbon and organic carbon are larger than in GEOS-4 due to the different biomass burn-ing emissions; however, their burden and lifetime are smaller than the GEOS-4 because of the relatively large removal pro-cess. Sulfate emission is slightly smaller than that in GEOS-4 (55.47 vs. 58.73 Tg yr−1); NGACv2 sulfate also has less bur-den and lifetime. It is worth noting that the NGAC emissions, budget, and lifetime presented here are in the context of the AeroCom model suite. Evaluation of aerosol budget, emis-sions, and lifetime using observations is beyond the scope of this study.
4.2 Case study
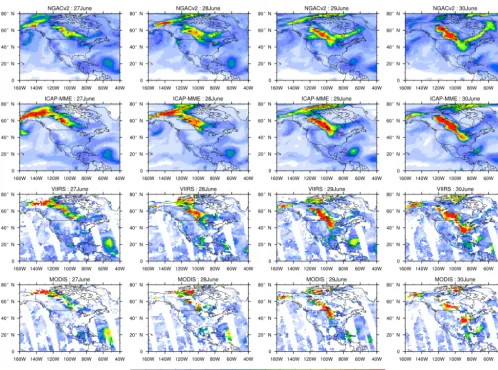
Figure 3 shows the total aerosol optical depth simulated by NGACv2 during a smoke event from Canadian wildfires dur-ing 27 June–6 July 2015. A strong trough and jet stream dom-inated the middle of North America, and the wind transported the smoke plume toward the southeast from Canada to the Dakotas, Nebraska, and several other states and then reached the Great Lakes region. Elevated AOD associated with the smoke plume has been observed by the space-borne Moder-ate Resolution Imaging Spectroradiometer (MODIS) sensor and Visible Infrared Imaging Radiometer Suite (VIIRS). The spatial pattern is also predicted by International Cooperative for Aerosol Prediction Multi-Model Ensemble (ICAP-MME; Sessions et al., 2015). The AOD simulated by NGACv2 are consistent with ICAP-MME as well as the observations from MODIS and VIIRS imagery. However, NGACv2 fails to cap-ture the large AOD over the south of the Great Lakes that is shown in the satellite retrievals and the ICAP-MME.
ensem-Figure 2.Global annual total aerosol emissions and annual average aerosol burdens, lifetimes, and loss frequencies in NGACv2, AeroCom models, GOES4, and NGACv1 (dust-only). For AeroCom models, the red vertical lines show the maximal and minimal values, and the bar
shows the mean value. Column(a)is for dust, column(b)is for sea salt aerosols, column(c)is for black carbon, column(d)is for organic
carbon, and column(e)is for sulfate. Sulfate is for sulfur amount only (Colarco et al., 2010).
Figure 3.Smoke event of 27 June to 6 July 2015 from NGACv2 and ICAP forecasts and VIIRS and MODIS satellite observations.
5 NGAC Version 2 application
The implementation of NGACv2 will provide a full suite of two-dimensional (2-D) and three-dimensional (3-D) aerosol products for various downstream applications. Examples of NGACv2 product applications are given here.
5.1 Dynamic boundary conditions for regional air quality model
One direct application of NGAC is to provide dynamic boundary conditions for regional air quality models such as Community Multiscale Air Quality (CMAQ) modeling system. The utilization of NGAC for CMAQ with zero-flux divergence outflow and prescribed concentrations for inflow chemical lateral boundary conditions for the dust-associated aerosol has been operational since February 2016 under the auspices of the National Air Quality Forecasting Capability (NAQFC) (Lee et al., 2017). CMAQ previously used static climatology boundary conditions as lateral bound-ary conditions, which limited the regional forecast
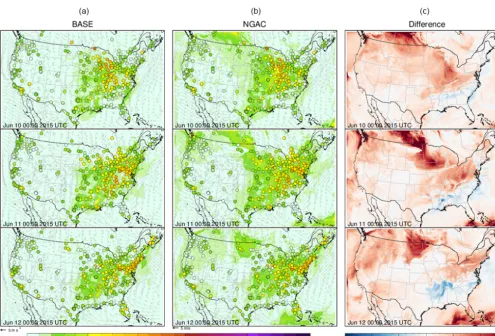
capabil-ity when an aerosol event moved into the regional domain from the CMAQ boundary. Figure 4 shows an event on 10– 12 June 2015 when smoke from Canada was moving into the United States. Column a is the PM2.5forecast on 10, 11,
and 12 June from the CMAQ run using GEOS-Chem model 2006 monthly average values for all the aerosol species at the lateral boundary. Column b is the PM2.5 forecast from
CMAQ during the same period using NGACv2 multispecies aerosols as the lateral boundary condition. PM2.5
Figure 4.PM2.5forecasts from regional air quality model CMAQ during the smoke event on 10–12 June 2015. Base: using GEOS-Chem
model 2006 monthly average as lateral boundary condition; NGAC: using NGACv2 forecast as lateral boundary condition, observations are
the circled colored dots. Differences between the two forecasts are shown in column(c).
Figure 5 shows the surface PM2.5 with frontal passages
in the 9–12 June 2015 Canadian fire. Panel (a) is the aver-aged surface PM2.5from 95 sites in the central United States
from 7 to 15 June. Panel (b) is the averaged surface PM2.5
from 82 sites in the northeast United States during the same time period. The line with circular dots is observations. The black line is the CMAQ forecast with climatology as the lat-eral boundary condition. The blue line is CMAQ using the operational NGAC dust-only forecast as the lateral boundary condition. The red line is the CMAQ forecast using NGACv2 multispecies aerosol forecasts. It is clear that the run with the NGACv2 forecast is closer to observations than the runs from the other experiments even though the peak of PM2.5in this
run is still lower than the observations.
5.2 Satellite SST retrieval
An example presented in Fig. 6 focused on exploring and re-fining the use of aerosol information in physical deterministic retrievals of sea-surface temperature (SST). This experiment has been conducted for nighttime scenarios using matchup
demon-Figure 5. Surface PM2.5 with frontal passages in the 9–12 June
2015 Canadian fire. Panel(a)is the averaged surface PM2.5from
95 sites in the middle of the United States from 7 to 15 June. Panel
(b)is the averaged surface PM2.5from 82 sites in the northeast of
United States. The line with circular dots is observations. The black line is the CMAQ forecast with climatology as a lateral boundary condition. The blue line is the CMAQ using operational NGAC dust-only forecast as a lateral boundary condition. The red line is the CMAQ forecast using an NGACv2 multispecies aerosol fore-cast.
Figure 6. Comparison of retrieval accuracy (blue lines) and al-gorithm sensitivity (degrees of freedom in retrieval; red lines) of MTLS (plus) without aerosol and truncated total least squares (solid circles) using aerosol optical depth in the state vector for
MODIS-Aqua data for January 2015. Evaluation is done againstiQuam buoy
data.
Figure 7. (a)Aerosol impact on DNI from Perez model estimations;
(b)NGACv2 AOD impact on Perez model solar energy estimation
mean bias error (MSE). East – GOES eastern USA satellite; west – GOES western USA; Wvar – variable water vapor (GFS model); Wfix – monthly averaged water vapor (NASA); our – monthly av-eraged AOD used in ASRC (NASA); GM – Gueymard AOD; 550 and 660 – NGACv2 AOD.
strated by the increase in the degree of freedom in retrieval (DFR) values to 0.75 and above. The NGACv2 aerosol prod-ucts make it possible to design the TTLS scheme; further development is required to improve the SST retrieval using aerosol products in real operation.
5.3 Insolation on the earth surface estimation
Hul-Figure 8.Next Generation of Global Prediction System (NGGPS) implementation plan.
strom, 1981) component of the Perez model to factors such as altitude, ozone, moisture, aerosols, and air mass. It can be seen that compared to double ozone, double moisture, or a decrease in elevation, double AOD has a larger impact on available DNI. Figure 7b shows the aerosol impact on the mean bias error (MBE) of global horizontal irradiance (GHI) from the Perez model. The GHI is computed from the Perez model with AOD and water vapor from different sources. Five sets of experiments were conducted to show the GHI MBE. “GHI” is the control experiment with monthly aver-aged AOD from NASA Earth Observations (NEO) and water vapor from NEO or GFS. Validation is performed on two sets of sites: one set is validated against the GOES eastern US satellite (GOES-13), the other against the GOES west-ern US satellite (GOES-15). “GHI_our” experiment uses the monthly averaged AOD from ASRC. “GHI GM” uses Guey-mard AOD (GueyGuey-mard, 2008); GHI with NGACv2 AOD at 550 nm and GHI with NGACv2 AOD at 660 nm are also shown. It is found that GHI MBE is the smallest for the ex-periment using NGAC AOD at 660 nm for the 2016 spring period. The results indicate potential improvement in the op-erational insolation estimate using NGAC AOD at 660 nm.
6 Conclusions
The implementation of NGACv2 provides operational global multispecies aerosol forecasts at NCEP. Total emissions, an-nual burden, and lifetime from all the aerosol species in NGACv2 are within the range of the AeroCom models and comparable to those in GEOS-4. More extensive evaluation of NGACv2 is presented in the companion paper by Bhat-tacharjee et al. (2018). Because the results will be used as a baseline for some future development work described below, a general description of the NGACv2 evaluation is shown here. Dust forecast skill is comparable to that in NGACv1 after the bug fix and removal process tuning. The long-range dust transport of Sahara dust is slightly improved. Sea salt performs normally compared to other models.
Sul-fate, black carbon, and organic carbon are unrepresentative in North America, the sub-Saharan region, and South Amer-ica in smoke season. Generally, fire activity shows up in the right location, but the concentration is too low compared to observations. The upgrade from a dust-only system to a mul-tispecies system enables NCEP to produce a full suite of aerosol products to serve a wide range of stakeholders, such as air quality and health professionals, aviation authorities, policy makers, and climate scientists. CMAQ experiments using the NGAC multispecies aerosol forecast as boundary conditions show positive impacts for a smoke event com-pared to the operational configuration using static boundary conditions. Using NGACv2 AOD 660 nm improves the mean bias errors in the estimation of surface insolation.
The evaluation of NGACv2 forecast results shows that the initial conditions could have a significant impact on model performance. Currently, NGACv2 is using the forecasted aerosol from the previous cycle and downscaled meteorology fields from the NCEP operational high-resolution data as-similation analysis. Without real-time asas-similation the initial aerosol fields may contain errors that propagate to all fore-cast hours. The aerosol data assimilation using VIIRS in GSI is under development and expected to be implemented in the near future. The future direction for NGAC will be focused on: (1) implementing aerosol data assimilation toward im-proving aerosol forecasts and (2) imim-proving the representa-tion of aerosol–radiarepresenta-tion–cloud interacrepresenta-tion in the atmosphere model toward improving weather forecast and climate pre-diction.
Code and data availability. NCEP Operational Products Suite products are distributed in near real time at the NOAA Operational Model Archive and Distribution System (NOMADS). The website is accessible to public users free of charge. NGACv2 products are available at http://www.nomads.ncep.noaa.gov/pub/data/nccf/com/ ngac/prod (last access: 12 June 2018).
The source code, scripts, parameters, and fixed field files can be obtained at http://www.nco.ncep.noaa.gov/pmb/codes/nwprod/ ngac.v2.3.0/ (last access: 12 June 2018).
Web graphics will remain available at http://www.emc.ncep. noaa.gov/gmb/NGAC/html/realtime.ngac.html (last access: 12 June 2018).
NGAC products are encoded in GRIB2. The NCEP grib2 table is updated to include the definition of new aerosol types. Users should download the latest versions of wgrib2 and the other NCEP GRIB utilities to use the NGAC output products.
Appendix A: New NGAC products
Output files and the new fields for NGACv2 (Q2FY2017 Im-plementation)
1. ngac.tCCz.a2dfHHH.grib2, where HHH=00, 03,. . ., 120 and CC=00, 12:
ASYSFK: asymmetry factor at 340 nm from total aerosols (numeric)
SSALBK: single scattering albedo at 340 nm from total aerosols (numeric)
AOTK: aerosol optical thickness at 550 nm from total aerosols (numeric)
AOTK: aerosol optical thickness at 550 nm from sea salt aerosol (numeric)
AOTK: aerosol optical thickness at 550 nm from black carbon dry aerosol (numeric)
AOTK: aerosol optical thickness at 550 nm from partic-ulate organic carbon dry aerosol (numeric)
AOTK: aerosol optical thickness at 550 nm from sulfate dry aerosol (numeric)
DUST_SCAVENGING_FLUX: dust wet deposition by convective precipitation flux fluxes (kg m−2s−1) SEASALT_EMISSION_FLUX: sea salt emission mass flux (kg m−2s−1)
SEASALT_SEDIMENTATION_FLUX: sea salt sedi-mentation mass flux (kg m−2s−1)
SEASALT_DRY_DEPOSITION_FLUX: sea salt dry-deposition mass flux (kg m−2s−1)
SEASALT_WET_DEPOSITION_FLUX: sea salt wet deposition by large-scale precipitation mass flux (kg m−2s−1)
SEASALT_SCAVENGING_FLUX: sea salt wet deposition by convective precipitation mass flux (kg m−2s−1)
BC_EMISSION_FLUX: black carbon emission mass flux (kg m−2s−1)
BC_SEDIMENTATION_FLUX: black carbon sedi-mentation mass flux (kg m−2s−1)
BC_DRY_DEPOSITION_FLUX: black carbon dry-deposition mass flux (kg m−2s−1)
BC_WET_DEPOSITION_FLUX: black carbon wet deposition by large-scale precipitation mass flux (kg m−2s−1)
BC_SCAVENGING_FLUX: black carbon wet deposi-tion by convective precipitadeposi-tion mass flux (kg m−2s−1)
OC_EMISSION_FLUX: particulate organic carbon emission mass flux (kg m−2s−1)
OC_SEDIMENTATION_FLUX: particulate organic carbon sedimentation mass flux (kg m−2s−1)
OC_DRY_DEPOSITION_FLUX: particulate organic carbon dry-deposition mass flux (kg m−2s−1)
OC_WET_DEPOSITION_FLUX: particulate organic carbon wet deposition by large-scale precipitation mass flux (kg m−2s−1)
OC_SCAVENGING_FLUX: particulate organic carbon wet deposition by convective precipitation mass flux (kg m−2s−1)
2. ngac.tCCz.a2dfHHH.grib2, where HHH=00, 03,. . ., 120 and CC=00, 12:
Data fields are instantaneous on 1◦×1◦lat–long grid. SEASALT1: sea salt bin1 (diameter: 0.06–0.2 µm) mix-ing ratio (kg / kg)
SEASALT2: sea salt bin2 (diameter: 0.2–1 µm) mixing ratio (kg / kg)
SEASALT3: sea salt bin3 (diameter: 1–3 µm) mixing ra-tio (kg / kg)
SEASALT4: sea salt bin4 (diameter: 3–10 µm) mixing ratio (kg / kg)
SEASALT5: sea salt bin5 (diameter: 10–20 µm) mixing ratio (kg / kg)
BC1: black carbon hydrophobic dry (median diameter: 0.0236 µm), mixing ratio (kg / kg)
BC2: black carbon hydrophilic dry (median diameter: 0.0236 µm), mixing ratio (kg / kg)
OC1: particulate organic carbon hydrophobic dry (me-dian diameter: 0.0424 µm), mixing ratio (kg / kg) OC2: particulate organic carbon hydrophilic dry (me-dian diameter: 0.0424 µm), mixing ratio (kg / kg) SO4: sulfate dry (median diameter: 0.139 µm), mixing ratio (kg / kg)
Total aerosol optical depth at specified wavelengths (11.1, 1.63, 0.34, 0.44, 0.55, 0.66, and 0.86 µm). Please note: NGACv1 total aerosol optical depth is from dust-only. NGACv2 total aerosol optical depth is from mul-tiple species including dust, sea salt, sulfate, black car-bon, and particulate organic carbon.
New fields:
Competing interests. The authors declare that they have no conflict of interest.
Acknowledgements. The development of GBBEPx smoke
emis-sions is funded by the Joint Center for Satellite Data Assimilation (JCSDA) Science Development and Implementation (JDSI). The NGACv2 tuning and evaluation work conducted by the UAlbany team (Cheng-Hsuan Lu, Sheng-Po Chen, and Shih-Wei Wei) has been partially supported by the NOAA Modeling, Analysis, Prediction, and Projections (MAPP) Climate Test Bed (CTB) (award number NA14OAR4310182) and NOAA Next Generation Global Prediction System (NGGPS) Research-to-Operations Initiative (R2O) (award number NA15NWS4680008). The authors thank Richard Perez and Sergey Kivalov (Univer-sity at Albany, State Univer(Univer-sity of New York) for evaluating the impact of NGACv2 aerosol forecasts on the estimation of surface insolation. We also thank the Space Science and Engineering Center at University of Wisconsin-Madison for providing visible satellite images (http://www.ssec.wisc.edu/) and NASA Earth Observations for providing climatology data
(https://earthobservatory.nasa.gov/GlobalMaps) in the surface
insolation estimation experiment. The authors thank Li Pan and Hyun Kim for evaluating NGACv2 impact on CMAQ forecast. The authors appreciate the multi-model ensemble work done by the NRL for ICAP. The lead author Jun Wang gives special thanks to NCEP EMC management for project support and EMC colleagues for their scientific and technical inputs, including Shrinivas Moorthi, Yu-Tai Hou, Mark Iredell, and Boi Vuong. The lead author is grateful for the operational implementation support she got from NCEP NCO colleagues: Simon Hsiao, Xiaoxue Wang, Steven Earle, and Rebecca Cosgrove. The implementation evaluation by Craig Long, Peng Xian, and Jeff Reid is also greatly appreciated. Lastly, the authors would like to thank the two anonymous reviewers for their valuable suggestions and comments.
Edited by: Rolf Sander
Reviewed by: two anonymous referees
References
Albrecht, B.: Aerosols, Cloud Microphysics, and Fractional Cloudi-ness, Science, 245, 1227–1230, 1989.
Bhattacharjee, P. S., Wang, J., Lu, C.-H., and Tallapragada, V.: The implementation of NEMS GFS Aerosol Component (NGAC) Version 2.0 for global multispecies forecasting at NOAA/NCEP – Part 2: Evaluation of aerosol optical thickness, Geosci. Model Dev., 11, 2333–2351, https://doi.org/10.5194/gmd-11-2333-2018, 2018.
Bian, H., Chin, M., Kawa, S. R., Yu, H., Diehl, T., and Kucsera, T.: Multiscale Carbon Monoxide and aerosol correlations from satellite measurements and the GOCART model: implication for emissions and atmospheric evolution, J. Geophys. Res., 115, D07302, https://doi.org/10.1029/2009JD012781, 2010. Bird, R. E. and Hulstrom, R. L.: A Simplified Clear Sky Model for
Direct and Diffuse Insolation on Horizontal Surfaces, Solar En-ergy Research Institute, Golden, CO, TR-642-761, 33 pp., 1981.
Black, T., Juang, H. M. H., Yang, W. Y., and Iredell, M.: An ESMF framework for NCEP operational models, J3.1, in: 22nd Confer-ence on Weather Analysis and Forecasting/18th ConferConfer-ence on Numerical Weather Prediction, Park City, UT, USA, 25–29 June 2007, American Meteorological Society, 2007.
Black, T., Juang, H. M. H., and Iredell, M.: The NOAA Environ-mental Modeling System at NCEP, 2A.6, Preprints, 23rd Con-ference on Weather Analysis and Forecasting/19th ConCon-ference on Numerical Weather Prediction, Omaga, NE, USA, 1–5 June 2009, American Meteorological Society, 2009.
Bond, T. C., Streets, D. G., Yarber, K. F., Nelson, S. M., Woo, J.-H., and Klimont, Z.: A technology-based global inventory of black and organic carbon emissions from combustion, J. Geophys.
Res., 109, D14203, https://doi.org/10.1029/2003JD003697,
2004.
Chin, M., Rood, R. B., Lin, S.-J., Müller, J.-F., and Thompson, A. M.: Atmospheric sulfur cycle simulated in the global model GOCART: Model description and global properties, J. Geophys. Res., 105, 24671–24687, 2000a.
Chin, M., Savoie, D. L., Huebert, B. J., Bandy, A. R., Thornton, D. C., Bates, T. S., Quinn, P. K., Saltzman, E. S., and De Bruyn, W. J.: Atmospheric sulfur cycle in the global model GOCART: com-parison with field observations and regional budgets, J. Geophys. Res., 105, 24689–24712, 2000b.
Chin, M., Ginoux, P., Kinne, S., Torres, O., Holben, B. N., Duncan, B. N., Martin, R. V., Logan, J. A., Higurashi, A., and Nakajima, T.: Tropospheric aerosol optical thickness from the GOCART model and comparisons with satellite and sunphotometer mea-surements, J. Atmos. Sci., 59, 461–483, 2002.
Chin, M., Ginoux, P., Lucchesi, R., Huebert, B., Weber,
R., Anderson, T., Masonis, S., Blomquist, B., Bandy,
A., and Thornton, D.: A global model forecast for the ACE-Asia field experiment, J. Geophys. Res., 108, 8654, https://doi.org/10.1029/2003JD003642, 2003.
Chin, M., Chu, A., Levy, R., Remer, L., Kaufman, Y., Hol-ben, B., Eck, T., Ginoux, P., and Gao, Q.: Aerosol dis-tributions in the northern hemisphere during ACE-Asia: re-sults from global model, satellite observations and surface sun photometer measurements, J. Geophy. Res., 109, D23S90, https://doi.org/10.1029/2004JD004829, 2004.
Chin, M., Diehl, T., Ginoux, P., and Malm, W.: Interconti-nental transport of pollution and dust aerosols: implications for regional air quality, Atmos. Chem. Phys., 7, 5501–5517, https://doi.org/10.5194/acp-7-5501-2007, 2007.
Chin, M., Diehl, T., Dubovik, O., Eck, T. F., Holben, B. N., Sinyuk, A., and Streets, D. G.: Light absorption by pollution, dust, and biomass burning aerosols: a global model study and evaluation with AERONET measurements, Ann. Geophys., 27, 3439–3464, https://doi.org/10.5194/angeo-27-3439-2009, 2009.
Colarco, P., da Silva, A., Chin, M., and Diehl, T.: Online simulations of global aerosol distributions in the NASA GEOS-4 model and comparisons to satellite and ground-based aerosol optical depth, J. Geophys. Res., 115, D14207, https://doi.org/10.1029/2009JD012820, 2010.
and refractive index, J. Geophys. Res.-Atmos., 119, 753–786, https://doi.org/10.1002/2013JD020046, 2014.
Cooke, W. F., Liousse, C., Cachier, H., and Feichter, J.: Contruction
of a 1◦×1◦fossil fuel emission data set for carbonaceous aerosol
and implementation and radiative impact in the ECHAM4 model, J. Geophys. Res., 104, 22137–22162, 1999.
Darmenov, A. and da Silva, A.: The Quick Fire Emissions Dataset (QFED) – Documentation of versions 2.1, 2.2 and 2.4, NASA Technical Report Series on Global Modeling and Data As-similation, NASA/TM-2015–104606, Vol. 38, 211 pp., avail-able at: http://citeseerx.ist.psu.edu/viewdoc/download?doi=10.1. 1.406.7724&rep=rep1&type=pdf (last access: 4 June 2018), 2015.
Diehl, T., Heil, A., Chin, M., Pan, X., Streets, D., Schultz, M., and Kinne, S.: Anthropogenic, biomass burning, and volcanic
emis-sions of black carbon, organic carbon, and SO2 from 1980 to
2010 for hindcast model experiments, Atmos. Chem. Phys. Dis-cuss., 12, 24895–24954, https://doi.org/10.5194/acpd-12-24895-2012, 2012.
Eyring, V., Kohler, H. W., van Aardenne, J., and Lauer,
A.: Emissions from international shipping, 1. The
last 50 years, J. Geophys., Res., 110, D17305,
https://doi.org/10.1029/2004JD005619, 2005.
Fan, J., Rosenfeld, D., Yang, Y., Zhao, C., Leung, L. R., and Li, Z.: Substantial Contribution of Anthropogenic Air Pollution to Catastrophic Floods in Southwest China, Geophys. Res. Lett., 42, 6066–6075, https://doi.org/10.1002/2015GL064479, 2015. Ginoux, P., Chin, M., Tegen, I., Prospero, J. M., Holben, B.,
Dubovik, O., and Lin, S.-J.: Sources and distributions of dust aerosols simulated with the GOCART model, J. Geophys. Res.,
106, 20255–20273, https://doi.org/10.1029/2000JD000053,
2001.
Ginoux, P., Prospero, J. M., Torres, O., and Chin, M.: Long-term simulation of global dust distribution with the GOCART model: correlation with the North Atlantic Oscilation, Environ. Modell. Softw., 19, 113–128, https://doi.org/10.1016/S1364-8152(03)00114-2, 2004.
Gong, S. L.: A parameterization of sea-salt aerosol source function for sub and super-micron particles, Global Biogeochem. Cy., 17, 1097, https://doi.org/10.1029/2003GB002079, 2003.
Grell, G. and Baklanov, A.: Integrated modeling for forecasting weather and air quality: a call for fully coupled approaches, At-mos. Environ., 45, 6845–6851, 2011.
Guenther, A., Hewitt, C. N., Erickson, D., Fall, R., Geron, C., Graedel, T., Harley, P., Klinger, L., Lerdau, M., McKay, W. A., Pierce, T., Scholes, B., Steinbrecher, R., Tallamraju, R., Taylor, J., and Zimmerman, P.: A global model of natural volatile or-ganic compound emissions, J. Geophys. Res., 100, 8873–8892, https://doi.org/10.1029/94JD02950, 1995.
Gueymard, C.: REST2: High-performance solar radiation model for cloudless-sky irradiance, illuminance, and photosynthetically ac-tive radiation – Validation with benchmark dataset, Sol. Energy, 82, 272–285, 2008.
Han, J. and Pan, H.-L.: Revision of convection and vertical diffusion schemes in the NCEP Global Forecast System, Weather Fore-cast., 26, 520–533, https://doi.org/10.1175/WAF-D-10-05038.1, 2011.
Han, J., Witek, M. L., Teixeira, J., Sun, R., Pan, H., Fletcher, J. K., and Bretherton, C. S.: Implementation in the NCEP
GFS of a hybrid eddy-diffusivity mass-flux (EDMF) bound-ary layer parameterization with dissipative heating and modified stable boundary layer mixing, Weather Forecast., 31, 341–352, https://doi.org/10.1175/WAF-D-15-0053.1, 2016.
Haywood, J. M. and Boucher, O.: Estimate of the direct and indi-rect radiative forcing due to tropospheric aerosols: A review, Rev. Geophys., 38, 513–543, https://doi.org/10.1029/1999RG000078, 2000.
Janssens-Maenhout, G.: EDGARv4.1 Emission Time
Se-ries, European Commission, Joint Research Centre (JRC)
[Dataset] PID, available at: http://data.europa.eu/89h/
jrc-edgar-emissiontimeseriesv41 (last access: 12 June 2018), 2010.
Jickells, T. D., An, Z. S., Andersen, K. K., Baker, A. R., Bergametti, G., Brooks, N., Cao, J. J., Boyd, P. W., Duce, R. A., Hunter, K. A., Kawahata, H., Kubilay, N., laRoche, J., Liss, P. S., Mahowald, N., Prospero, J. M., Ridgwell, A. J., Tegen, I., and Torres, R.: Global Iron Connections between Desert Dust, Ocean Biogeo-chemistry, and Climate, Science 308, 67–71, 2005.
Kim, D. M., Chin, M., Bian, H., Tan, Q., Brown, M. E., Zheng, T., You, R., Diehl, T., Ginoux, P., and Kucsera, T.: The effect of the dynamic surface bareness on dust source function, emis-sion and distribution, J. Geophys. Res.-Atmos., 118, 871–886, https://doi.org/10.1029/2012JD017907, 2013.
Koner, P. K. and Harris, A.: Sea surface temperature retrieval from MODIS radiances using truncated total least squares with multiple channels and parameters, Remote Sens., 8, 725, https://doi.org/10.3390/rs8090725, 2016.
Koner, P. K., Harris, A., and Maturi, E.: A physical deterministic inverse method for operational satellite remote sensing: an ap-plication for sea surface temperature retrievals, IEEE T. Geosci. Remote, 53, 5872–5888, 2015.
Koner, P. K., Harris, A., and Maturi, E.: Hybrid cloud and error masking to improve the quality of deterministic satellite sea sur-face temperature retrieval and data coverage, Remote Sens. Env-iron., 174, 266–278, 2016.
Lana, A., Bell, T. G., Simó, R., Vallina, S. M., Ballabrera-Poy, J., Kettle, A. J., Dachs, J., Bopp, L., Saltzman, E. S., Ste-fels, J., Johnson, J. E., and Liss, P. S.: An updated clima-tology of surface dimethlysulfide concentrations and emission fluxes in the global ocean, Global Biogeochem. Cy. 25, GB1004, https://doi.org/10.1029/2010GB003850, 2011.
Lee, P., McQueen, J., Stajner, I., Huang, J., Pan, L., Tong, D., Kim, H., Tang, Y., Kondragunta, S., Ruminski, M., Lu, S., Rogers, E., Saylor, R., Shafran, P., Huang, H., Gorline, J., Upadhayay, S., and Artz, R.: NAQFC developmental forecast guidance for
fine particulate matter (PM2.5), Weather Forecast., 32, 343–360,
https://doi.org/10.1175/WAF-D-15-0163.1, 2017.
Liss, P. S. and Merlivat, L.: Air–Sea Gas Exchange Rates: Introduc-tion and Synthesis, in: The Role of Air-Sea Exchange in Geo-chemical Cycling, edited by: Buat-Ménard, P., Springer, Dor-drecht, NATO ASI Series (Series C: Mathematical and Physical Sciences), vol. 185, 1986.
Lohmann, U. and Feichter, J.: Global indirect aerosol
ef-fects: a review, Atmos. Chem. Phys., 5, 715–737,
https://doi.org/10.5194/acp-5-715-2005, 2005.
NEMS GFS Aerosol Component (NGAC) Version 1.0 for global dust forecasting at NOAA/NCEP, Geosci. Model Dev., 9, 1905– 1919, https://doi.org/10.5194/gmd-9-1905-2016, 2016.
Lu, S., Huang, H.-C., Hou, Y.-T., Tang, Y., McQueen, J., da Silva, A., Chin, M., Joseph, E., and Stockwell, W.: Development of NCEP Global Aerosol Forecasting System: an overview and its application for improving weather and air quality forecasts, in: NATO Science for Peace and Security Series: Air Pollution Mod-elling and Its Application XX, Springer Publications, Dordrecht, the Netherlands, 451–454, https://doi.org/10.1007/978-90-481-3812-8, 2010.
Lundgren, K. B., Vogel, H., and Kottmeier, C.: Direct radiative ef-fects of sea salt for the Mediterranean region under conditions of low to moderate wind speeds, J. Geophys. Res.-Atmos. 118, 1906–1923, 2013.
Lynch, P., Reid, J. S., Westphal, D. L., Zhang, J., Hogan, T. F., Hyer, E. J., Curtis, C. A., Hegg, D. A., Shi, Y., Campbell, J. R., Rubin, J. I., Sessions, W. R., Turk, F. J., and Walker, A. L.: An 11-year global gridded aerosol optical thickness reanalysis (v1.0) for at-mospheric and climate sciences, Geosci. Model Dev., 9, 1489– 1522, https://doi.org/10.5194/gmd-9-1489-2016, 2016.
Mahowald, N.: Aerosol Indirect Effect on
Biogeochem-ical Cycles and Climate, Science, 334, 794–796,
https://doi.org/10.1126/science.1207374, 2011.
Maria, S. F., Russell, L. M., Giles, M. K., and Myneni, S. C. B.: Or-ganic aerosol growth mechanisms and their climate-forcing im-plications, Science, 306, 1921–1924, 2004.
Marticorena, B. and Bergametti, G.: Modeling the
atmo-spheric dust cycle: 1. Design of a soil-derived dust
emission scheme, J. Geophys. Res., 100, 16415–16430, https://doi.org/10.1029/95JD00690, 1995.
Mircea, M., Facchini, M. C., Decesari, S., Fuzzi, S., and Charlson, R. J.: The influence of the organic aerosol component on CCN supersaturation spectra for different aerosol types, Tellus B, 54, 74–81, 2002.
Monahan, E. C., Spiel, D. E., and Davidson, K. L.: A model of ma-rine aerosol generation via whitecaps and wave disruption, in: Oceanic Whitecaps and their role in air–sea exchange processes, edited by: Mohahan, E. C. and MacNiocaill, G., D. Reidel, Nor-well, Mass., 167–174, 1986.
Moorthi, S. and Suarez, M. J.: Relaxed Arakawa-Schubert: A pa-rameterization of moist convection for general circulation mod-els, Mon. Weather Rev., 120, 978–1002, 1992.
Moorthi, S. and Suarez, M. J.: Documentation of version 2 of Re-laxed Arakawa-Schubert cumulus parameterization with convec-tive downdrafts, NOAA Tech. Report NWS/NCEP 99-01, 44 pp., 1999.
Mulcahy, J. P., Walters, D. N., Bellouin, N., and Milton, S. F.: Impacts of increasing the aerosol complexity in the Met Office global numerical weather prediction model, Atmos. Chem. Phys., 14, 4749–4778, https://doi.org/10.5194/acp-14-4749-2014, 2014.
Perez, P., Ineichen, P., Seals, R., Michalsky, J., and Stewart, R.: Modeling daylight availability and irradiance components from direct and global irradiance, Sol. Energy, 44, 271–289, 1990. Perez, R., Ineichen, P., Moore, K., Kmiecik, M., Chain, C., Georges,
R., and Vignola, F.: A New Operational Satellite-to-Irradiance Model, Sol. Energy, 73, 307–317, 2002.
Perez, R., Schlemmer, J., Hemker, K., Kivalov, S., Kankiewicz, A., and Gueymard, G.: Satellite-to-Irradiance Modeling – A New Version of the SUNY Model, Proceedings of 42nd IEEE PV Spe-cialists Conference, New Orleans, LA, 14–19 June 2015, IEEE, https://doi.org/10.1109/PVSC.2015.7356212, 2015.
Pincus, R., Barker, H. W., and Morcrette, J.-J.: A fast flex-bile, approximate technique for computing radiatibe transfer in inhomogenoues cloud fields, J. Geophys. Res., 108, 4376, https://doi.org/10.1029/2002JD003322, 2003.
Ramanathan, V., Crutzen, P. J., Kiehl, J. T., and Rosenfeld, D.: Aerosols, climate, and the hydrological cycle, Science, 294, 2119–2124, 2001.
Reale, O., Lau, K. M., and da Silva, A.: Impacts of interac-tive aerosol on the African Easterly jet in the NASA GEOS-5 global forecasting system, Weather Forecast., 26, GEOS-504–GEOS-519, https://doi.org/10.1175/WAF-D-10-05025.1, 2011.
Rosenfeld, D.: Aerosol-Cloud Interactions Control of Earth Radia-tion and Latent Heat Release Budgets, Space Sci Rev., 125, 149– 157, https://doi.org/10.1007/s11214-006-9053-6, 2006
Rosenfeld, D., Woodley, W. L., Khain, A., Cotton, W. R., Carrió, G., Ginis, I., and Golden, J. H.: Aerosol effects on microstructure and intensity of the tropical cyclones, B. Am. Meteorol. Soc. 93, 987–1001, 2012.
Rosenfeld, D., Andreae, M. O., Asmi, A., Chin, M., de Leeuw, G., Donovan, D. P., Kahn, R., Kinne, S., Kivekäs, N., Kul-mala, M., Lau, W., Schmidt, K. S., Suni, T., Wagner, T., Wild, M., and Quaas, J.: Global observations of aerosol-cloud-precipitation-climate interactionsm, Rev. Geophys., 52, 750– 808, https://doi.org/10.1002/2013RG000441, 2014.
Saide, P. E., Spak, S. N., Pierce, R. B., Otkin, J. A., Schaack, T. K., Heidinger, A. K., da Silva, A. M., Kacenelenbogen, M., Re-demann, J., and Carmichael, G. R.: Central American biomass burning smoke can increase tornado severity in the U.S., Geo-phy. Res. Lett., 42, 956–965, 2015.
Sessions, W. R., Reid, J. S., Benedetti, A., Colarco, P. R., da Silva, A., Lu, S., Sekiyama, T., Tanaka, T. Y., Baldasano, J. M., Basart, S., Brooks, M. E., Eck, T. F., Iredell, M., Hansen, J. A., Jorba, O. C., Juang, H.-M. H., Lynch, P., Morcrette, J.-J., Moorthi, S., Mulcahy, J., Pradhan, Y., Razinger, M., Sampson, C. B., Wang, J., and Westphal, D. L.: Development towards a global oper-ational aerosol consensus: basic climatological characteristics of the International Cooperative for Aerosol Prediction Multi-Model Ensemble (ICAP-MME), Atmos. Chem. Phys., 15, 335– 362, https://doi.org/10.5194/acp-15-335-2015, 2015
Sokolik, I. N. and Toon, O. B.: Incorporation of mineralogical com-position into models of the radiative properties of mineral aerosol from UV to IR wavelengths, J. Geophys. Res., 104, 9423–9444, https://doi.org/10.1029/1998JD200048, 1999.
Stevens, B. and Feingold, G.: Untangling aerosol effects on clouds and precipitation in a buffered system, Nature, 461, 607–613, 2009.
Streets, D. G., Yu, C., Wu, Y., Chin, M., Zhao, Z., Hayasaka, T., and Shi, G.: Aerosol trends over China, 1980–2000, Atmos. Res., 88, 174–182, https://doi.org/10.1016/j.atmosres.2007.10.016, 2008. Streets, D. G., Yan, F., Chin, M., Diehl, T., Mahowald, N.,
Textor, C., Schulz, M., Guibert, S., Kinne, S., Balkanski, Y., Bauer, S., Berntsen, T., Berglen, T., Boucher, O., Chin, M., Dentener, F., Diehl, T., Easter, R., Feichter, H., Fillmore, D., Ghan, S., Ginoux, P., Gong, S., Grini, A., Hendricks, J., Horowitz, L., Huang, P., Isaksen, I., Iversen, I., Kloster, S., Koch, D., Kirkevåg, A., Krist-jansson, J. E., Krol, M., Lauer, A., Lamarque, J. F., Liu, X., Mon-tanaro, V., Myhre, G., Penner, J., Pitari, G., Reddy, S., Seland, Ø., Stier, P., Takemura, T., and Tie, X.: Analysis and quantification of the diversities of aerosol life cycles within AeroCom, Atmos. Chem. Phys., 6, 1777–1813, https://doi.org/10.5194/acp-6-1777-2006, 2006.
Tompkins, A. M., Cardinali, C., Morcrette, J. J., and Rod-well, M.: Influence of aerosol climatology on forecasts of the African Easterly jet, Geophy. Res. Lett., 32, L10801, https://doi.org/10.1029/2004GL022189, 2015
Twomey, S. A.: The influence of pollution on the shortwave albedo of clouds, J. Atmos. Sci., 34, 1149–1152, 1977.
Wang, Y.: Assessing the effects of anthropogenic aerosols on Pacific storm track using a multiscale climate model, P. Natl. Acad. Sci. USA, 111, 6894–6899, 2014.
Zhang, X., Kondragunta, S., Ram, J., Schmidt, C., and Huang, H.-C.: Near-real-time global biomass burning emissions product from geostationary satellite constellation, J. Geophys. Res., 117, D14201, https://doi.org/10.1029/2012JD017459, 2012. Zhang, X., Kondragunta, S., da Silva, A., Lu, S., Ding,
H., Li, F., and Zhu, Y.: The blended global biomass burning emissions product from MODIS and geostationary satellites (GBBEPx), http://www.ospo.noaa.gov/Products/land/ gbbepx/docs/GBBEPx_ATBD.pdf (last access: 1 June 2018), 2014.