S H O R T R E P O R T
Open Access
Associations between maternal risk factors
of adverse pregnancy and birth outcomes
and the offspring epigenetic clock of
gestational age at birth
Polina Girchenko
1*, Jari Lahti
1,2, Darina Czamara
3, Anna K. Knight
11, Meaghan J. Jones
14, Anna Suarez
1,
Esa Hämäläinen
5, Eero Kajantie
6,7, Hannele Laivuori
8,9, Pia M. Villa
8, Rebecca M. Reynolds
10, Michael S. Kobor
14,
Alicia K. Smith
11,12,13, Elisabeth B. Binder
3,4and Katri Räikkönen
1Abstract
Background:A recent study has shown that it is possible to accurately estimate gestational age (GA) at birth from the DNA methylation (DNAm) of fetal umbilical cord blood/newborn blood spots. This DNAm GA predictor may provide additional information relevant to developmental stage. In 814 mother-neonate pairs, we evaluated the associations between DNAm GA and a number of maternal and offspring characteristics. These characteristics reflect prenatal environmental adversity and are expected to influence newborn developmental stage.
Results:DNAm GA acceleration (GAA; i.e., older DNAm GA than chronological GA) of the offspring at birth was associated with maternal age of over 40 years at delivery, pre-eclampsia and fetal demise in a previous pregnancy, maternal pre-eclampsia and treatment with antenatal betamethasone in the index pregnancy, lower neonatal birth size, lower 1-min Apgar score, and female sex. DNAm GA deceleration (GAD; i.e., younger DNAm GA than
chronological GA) of the offspring at birth was associated with insulin-treated gestational diabetes mellitus (GDM) in a previous pregnancy and Sjögren’s syndrome. These findings were more accentuated when the DNAm GA calculation was based on the raw difference between DNAm GA and GA than on the residual from the linear regression of DNAm GA on GA.
Conclusions:Our findings show that variations in the DNAm GA of the offspring at birth are associated with a number of maternal and offspring characteristics known to reflect exposure to prenatal environmental adversity. Future studies should be aimed at determining if this biological variation is predictive of developmental adversity.
Keywords:Aging, Cord blood methylation, Epigenetic clock, Gestational age, Prenatal programming
Background
Biomarkers of cellular aging have attracted increasing at-tention over the past few years. Such biomarkers hold the potential to identify individuals who are at risk of aging-related diseases so that they may be offered timely, targeted preventive interventions, hopefully decades be-fore the onset of disease. DNA methylation (DNAm) is an epigenetic mechanism characterized by the addition of one methyl group primarily to
cytosine-phosphate-guanine (CpG) sites on DNA. The epigenome is known to undergo age-related changes [1–6], and specific meth-ylated CpG sites have been strongly correlated with chronological age in humans. Hannum et al. identified 71 CpG sites in whole blood [7], and Horvath et al. iden-tified 353 CpG sites from multiple tissues that could predict chronological age with high accuracy (r> 0.91). The median absolute difference between these methyla-tion age biomarkers and chronological age has been shown to vary from between 2.9 and 4.9 years [8]. Epi-genetic age acceleration (AA; higher epiEpi-genetic than chronological age) has been associated with negative * Correspondence:polina.girchenko@helsinki.fi
1Institute of Behavioral Sciences, University of Helsinki, Helsinki 00014, Finland
Full list of author information is available at the end of the article
health outcomes [9–11], and a recent meta-analysis of over 13,000 individuals has confirmed that it can predict all-cause mortality [12].
Epidemiological studies have shown that exposure to adverse environmental events in the prenatal period pre-dicts increased risk of aging-related diseases [13–18]. These studies are consistent with the Developmental Or-igins of Health and Diseases (DOHaD) hypothesis [19], which proposes that prenatal exposures alter develop-mental trajectories [19]. However, it remains unclear whether epigenetic AA could identify individuals at birth who were exposed to environmental adversity in the pre-natal period. A recent study assessed epigenetic AA in peripheral blood from children and adolescents based on the Hannum and the Horvath age predictors. In this study, epigenetic AA, which was higher in boys, was also associated with higher maternal body mass index (BMI) and lower maternal selenium and cholesterol levels dur-ing pregnancy, and higher birth weight of the offsprdur-ing [20]. Furthermore, epigenetic AA at birth measured in DNA isolated from fetal cord blood was higher in the offspring born to mothers who had smoked during preg-nancy and who were delivered by cesarean section [20].
The Hannum and Horvath epigenetic age predictors are not, however, suitable for epigenetic age estimation using fetal cord blood. The Hannum age predictor was based on whole blood taken from 19–101-year-old indi-viduals [7] and the Horvath age predictor was based on multiple tissues taken from 0–100-year-old individuals, which includes fetal cord blood [8]. However, it should be noted that the correlation of both predictors with gestational age (GA) is nearly zero [20]. A recent study generated a novel DNAm GA predictor designed specif-ically for use on fetal umbilical cord blood or newborn blood spots [21]. This predictor identified methylation of 148 CpG sites that showed a strong correlation (overall r= 0.91) with ultrasound-based GA [21]. The average absolute difference between the predicted DNA methyla-tion GA and GA was 1.49 weeks [21]. Using fetal umbil-ical cord blood samples, another recent study identified 96 and 58 CpG sites, which however correlated less strongly with ultrasound-based (r= 0.81) and last men-strual period-based GA (r= 0.71) [22]; Only 23 of the ultrasound- and last menstrual period-based GA pre-dictor CpG sites overlapped [22].
In the present study, we studied the DNAm GA pre-dictor at birth based on fetal umbilical cord blood methylation data as developed by Knight et al. [21]. We tested whether DNAm GA is associated with a number of maternal and offspring characteristics known to re-flect a suboptimal prenatal developmental milieu of the offspring. These characteristics include maternal pre-pregnancy risk factors of pre-eclampsia and intrauterine growth restriction, maternal pregnancy disorders,
maternal treatment with antenatal corticosteroids, parity and mode of delivery, as well as newborn body size at birth, cord blood pH, and Apgar score. For comparison, we also present these associations with the Horvath epi-genetic age, which shares only six overlapping CpG sites with the DNAm GA predictor of Knight et al. [21].
Results
The associations of maternal and neonatal characteris-tics with the raw DNAm GA difference (arithmetic dif-ference between DNAm GA and GA) and with the DNAm GA residual (the residual from a linear regres-sion of DNAm GA on GA) were tested in 814 women and their singleton neonates participating in the
Prediction and Prevention of Pre-eclampsia and
Intrauterine Growth Restriction (PREDO) study
(Additional file 1: Figure S1). The mean GA at birth of this cohort was 39.76 (standard deviation (SD) 1.60; me-dian 39.86; range 31.0–42.71) weeks, and the mean DNAm GA at birth was 38.45 (SD 2.05; median 38.60; range 28.50–47.13) weeks. There was a positive correlation between the DNAm GA and GA (r= 0.51; p< 0.0001; Fig. 1). The average absolute difference (arithmetic difference between DNAm GA absolute values and GA) between DNAm GA and GA was 1.78 (SD 1.41; median 1.51) weeks, and the raw mean difference was −1.32 (SD 1.85; median −1.36; range
−10.64–6.97) weeks. There was a weak negative correl-ation between the raw DNAm GA difference and GA
(r=−0.30;p< 0.0001). DNAm GA residual did not cor-relate with GA (r= 0,p= 1.0).
Pearson correlations between the Horvath DNAm age and our values were as follows: GA 0.03 (p= 0.32), DNAm GA 0.11 (p= 0.002), raw DNAm GA difference 0.09 (p= 0.01), and DNAm GA residual 0.11 (p= 0.01).
Characteristics of the study population are presented in Table 1.
Maternal characteristics during pregnancy and offspring DNAm GA at birth
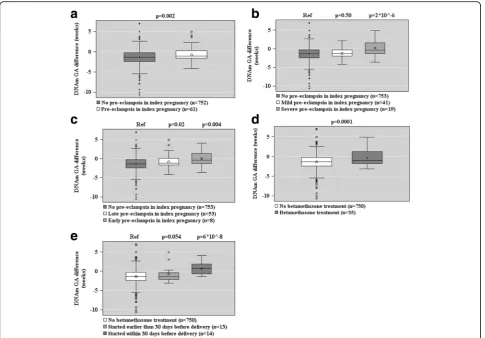
Figures 2, 3, and 4 show the associations between ma-ternal characteristics during pregnancy with the raw DNAm GA difference and the DNAm GA residual of the offspring. The regression models are adjusted for cellular heterogeneity and population stratification. When based on the raw DNAm GA difference, GAA was associated with a maternal age of above 40 years at delivery, pre-eclampsia in a previous pregnancy, fetal demise in a previous pregnancy, and having three or more of the pregnancy risk factors for pre-eclampsia and intrauterine growth restriction (Fig. 2). GAA was also associated with the presence, onset, and severity of maternal pre-eclampsia in the index preg-nancy and maternal treatment with betamethasone in the index pregnancy, particularly if the treatment was started a maximum of 30 days before delivery (Fig. 3). GAD was associated with insulin-treated GDM in a previous pregnancy (Fig. 2).
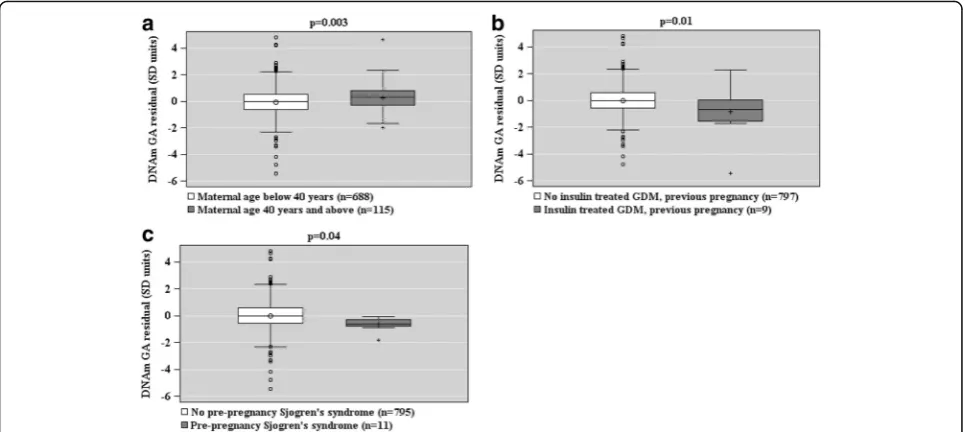
When based on the DNAm GA residual, GAA was as-sociated with a maternal age of above 40 years at deliv-ery, and GAD with insulin-treated GDM in a previous pregnancy and maternal Sjögren’s syndrome (Fig. 4).
Additional file 2: Table S1 shows the unstandardized regression coefficients and 95% confidence intervals for the associations depicted in Figs. 2, 3, and 4 and for the associations between the other tested maternal charac-teristics during pregnancy and offspring DNAm GA at birth. Additional file 2: Table S2 shows that all of the sig-nificant associations remained sigsig-nificant when addition-ally adjusted for the birth weight SD score based on Finnish national growth references [23].
Additional file 2: Table S3 shows the associations be-tween maternal characteristics and the offspring’s Horvath epigenetic age at birth.
Offspring characteristics and DNAm GA at birth
GAA, based on the raw DNAm GA difference, was asso-ciated with lower birth weight, birth length, ponderal index at birth, birth head circumference, placental weight (Fig. 5), being a lower birth weight for GA (con-tinuous and being small-for-gestational-age, <−2 SD), a lower 1-min Apgar score, and female sex (Fig. 6). All models were adjusted for cellular heterogeneity,
population stratification, and additionally for sex in the analyses of the offspring birth anthropometry.
When based on the DNAm GA residual, GAA was as-sociated with a lower 1-min Apgar score and female sex (Fig. 7). Additional file 2: Table S4 shows the unstan-dardized regression coefficients and 95% Confidence In-tervals for the associations depicted in Figs. 5, 6, and 7 and for the associations between the other tested off-spring characteristics and offoff-spring DNAm GA at birth.
Additional file 2: Table S5 shows the associations be-tween offspring characteristics and the offspring Horvath epigenetic age at birth.
Discussion
We show that a number of maternal and offspring char-acteristics known to reflect the offspring’s exposure to environmental adversity during the prenatal period were associated with variations in the offspring’s DNAm GA at birth. These characteristics are expected to influence the newborn developmental stage and fetal organ and tissue maturation. Characteristics associated with DNAm GAA included a number of pre-eclampsia and intrauterine growth restriction pre-pregnancy risk fac-tors: maternal age of over 40 years, pre-eclampsia and fetal demise in a previous pregnancy, and having a higher number of pregnancy risk factors of pre-eclampsia and intrauterine growth restriction that were measured in this study. DNAm GAA was also associated with maternal pre-eclampsia in the index pregnancy and treatment with antenatal betamethasone, which hastens fetal lung maturation and maturation of some other tis-sues [24]. It was also associated with a smaller body size at birth and being born small-for-gestational age, lower 1-min Apgar score, and female sex. Furthermore, our findings show that DNAm GAD was associated with insulin-treated GDM in a previous pregnancy and Sjögren’s syndrome. These findings were more accentu-ated when the DNAm GA calculation was based on the raw difference between DNAm GA and GA (which shared 9% of variance with GA) than on the residual from linear regression of DNAm GA on GA (which re-moved the effect of GA entirely from DNAm GA, and hence, was uncorrelated with GA). Our findings emphasize that neonates exposed to prenatal environ-mental adversity show differences at birth in their DNAm GA and GA, confirmed by early pregnancy ultrasound.
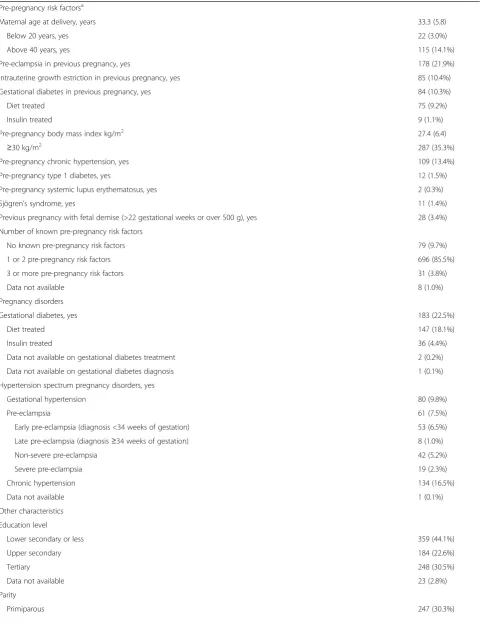
Table 1Characteristics of the study population (N= 814)
Maternal characteristics Mean (SD) orN(%)
Pre-pregnancy risk factorsa
Maternal age at delivery, years 33.3 (5.8)
Below 20 years, yes 22 (3.0%)
Above 40 years, yes 115 (14.1%)
Pre-eclampsia in previous pregnancy, yes 178 (21.9%)
Intrauterine growth estriction in previous pregnancy, yes 85 (10.4%)
Gestational diabetes in previous pregnancy, yes 84 (10.3%)
Diet treated 75 (9.2%)
Insulin treated 9 (1.1%)
Pre-pregnancy body mass index kg/m2 27.4 (6.4)
≥30 kg/m2 287 (35.3%)
Pre-pregnancy chronic hypertension, yes 109 (13.4%)
Pre-pregnancy type 1 diabetes, yes 12 (1.5%)
Pre-pregnancy systemic lupus erythematosus, yes 2 (0.3%)
Sjögren’s syndrome, yes 11 (1.4%)
Previous pregnancy with fetal demise (>22 gestational weeks or over 500 g), yes 28 (3.4%)
Number of known pre-pregnancy risk factors
No known pre-pregnancy risk factors 79 (9.7%)
1 or 2 pre-pregnancy risk factors 696 (85.5%)
3 or more pre-pregnancy risk factors 31 (3.8%)
Data not available 8 (1.0%)
Pregnancy disorders
Gestational diabetes, yes 183 (22.5%)
Diet treated 147 (18.1%)
Insulin treated 36 (4.4%)
Data not available on gestational diabetes treatment 2 (0.2%)
Data not available on gestational diabetes diagnosis 1 (0.1%)
Hypertension spectrum pregnancy disorders, yes
Gestational hypertension 80 (9.8%)
Pre-eclampsia 61 (7.5%)
Early pre-eclampsia (diagnosis <34 weeks of gestation) 53 (6.5%)
Late pre-eclampsia (diagnosis≥34 weeks of gestation) 8 (1.0%)
Non-severe pre-eclampsia 42 (5.2%)
Severe pre-eclampsia 19 (2.3%)
Chronic hypertension 134 (16.5%)
Data not available 1 (0.1%)
Other characteristics
Education level
Lower secondary or less 359 (44.1%)
Upper secondary 184 (22.6%)
Tertiary 248 (30.5%)
Data not available 23 (2.8%)
Parity
Table 1Characteristics of the study population (N= 814)(Continued)
Multiparous 566 (69.5%)
Data not available 1 (0.1%)
Smoking during pregnancy
Non-smoker 780 (95.8%)
Quit during first trimester 26 (3.2%)
Smoked throughout the pregnancy 8 (1.0%)
Data not available 0
Alcohol use during pregnancy
No 588 (72.2%)
Yes 117 (14.4%)
Data not available 109 (13.4%)
Mode of delivery
Vaginal 640 (78.6%)
Cesarean 173 (21.3%)
Data not available 1 (0.1%)
Antenatal betamethasone treatment
No 750 (92.1%)
Yes (n= 1 for 12 mg/24 h,n= 22 for 24 mg/24 h,n= 1 for 48 mg/24 h,
n= 11 for no information on dose)
35 (4.3%)
Timing of antenatal betamethasone treatment, number of days before birth 33.4 (27.1)
30 days or less before delivery 14 (1.7%)
30 days or more before delivery 13 (1.6%)
Data not available 29 (3.6%)
Neonatal characteristics
Sex
Girls 384 (47.2%)
Boys 430 (52.8%)
Data not available 0
Gestational age at birth, weeks 39.76 (1.60)
Data not available 0
DNA methylation gestational age, weeks 38.45 (2.05)
Data not available 0
Raw epigenetic gestational age difference, DNA methylation gestational
age-gestational age −
1.32 (1.85)
Data not available 0
Absolute epigenetic gestational age difference, DNA methylation gestational age-gestational age in absolute values
1.78 (1.41)
Data not available 0
Horvath DNA methylation age at birth, weeks 9.77 (19.51)
Data not available 0
Birth weight, g 3549 (546)
Small for gestational age, yesb 23 (2.8%)
Data not available 1 (0.1%)
Birth length, cm 50 (2)
Small for gestational age, yesb 21 (2.6%)
Table 1Characteristics of the study population (N= 814)(Continued)
Head circumference, cm 35 (2)
Small for gestational age, yesb 14 (1.7%)
Data not available 2 (0.3%)
Ponderal index, kg/m3 27.8 (2.7)
Data not available 1 (0.1%)
Placenta weight, g 615 (134)
Cord blood pH
Arterial 7.26 (0.09)
Venous 7.31 (0.08)
Apgar score
9–10 611 (75.1%)
7–8 145 (17.8%)
≤6 47 (5.8%)
Data not available 11 (1.4%)
a
Pre-pregnancy risk factors served as inclusion criteria for the study as described [39]
b
Small for gestational age indicates birth size for sex and gestational age SD≤ −2 according to Finnish growth references [23]
disadvantage during pregnancy and the offspring’s lower birth weight [21]. Also in contrast to our report, they re-port no sex differences in the median errors between DNAm GA and GA, i.e., boys and girls did not differ in their DNAm GA at birth [21]. Another recent study, which used the DNAm age predictors of Horvath and Hannum on cord blood methylation data, also con-cluded that prenatal adversity is associated with epigen-etic age at birth [20]. Yet, of the 20 different maternal and neonatal characteristics tested in that study, includ-ing maternal age, education, alcohol use durinclud-ing preg-nancy, body mass index (BMI), parity, birth weight, and sex, only maternal smoking during pregnancy and cesarean section were associated with epigenetic AA, in-dependent of GA at birth. However, the Horvath and Hannum epigenetic age did not correlate with the new-born chronological GA [20, 21]. This supports our study, as we found that the Horvath epigenetic age at birth based on cord blood methylation data was uncorrelated with the newborn GA. So, while the overall conclusion from these prior studies is similar to ours, discrepancy
maternal blood, and population genetic structure. These factors were only taken into account in our study. Differences may also relate to sample character-istics: 89.3% of women in our sample had at least 1 of the 10 pre-pregnancy risk factors of pre-eclampsia and intrauterine growth restriction. This resulted in greater variation in many maternal and offspring char-acteristics, including GA and DNAm GA, which are slightly different in this study from the study con-ducted by Knight et al. [21].
Both DNAm GAA and GAD could be conceived as indicators of risk. The increased risk of future adverse outcomes associated with DNAm GAA is congruent with findings in children and adults showing that epi-genetic age acceleration is associated with a number of adverse characteristics including higher BMI [25], lower physical and cognitive fitness [26], and increased mor-tality [9, 10, 12]. Lower developmental maturity, as in-dicated by DNAm GAD, is consistent with the DOHaD hypothesis and findings from previous studies showing an increased risk of aging-related diseases in individuals exposed to prenatal environmental adversity associated with pre-term birth [27–31]. Hence, the associations with DNAm GAA or GAD may serve as summary indi-cators of epigenetic programming and indicate in-creased risk for adverse outcomes later in life. As suggested by Knight et al. [21], an alternative explan-ation for the difference between DNAm GA and GA may be the variable nature of the clinical GA estima-tion. Yet, in our sample, this explanation may be less likely as GA estimation in all women was based on
ultrasound performed between 12 + 0 and 13 + 6
gestational weeks + days.
However, it is important to note that when DNAm GA was based on the residual, which removed the ef-fect of GA on DNAm GA entirely, many of the mater-nal and neonatal characteristics were no longer associated with DNAm GA. Only a maternal age of above 40 years, lower 1-min Apgar score, and female sex were associated with residual GAA and insulin-treated GDM in a previous pregnancy and maternal Sjögren’s syndrome were associated with residual GAD. If DNAm GA reflects developmental maturity, we cannot rule out it being independent of various environmental factors, which may alter the matur-ational process. Associations may become more evident later in childhood as the variation in methyla-tion increases [3, 7, 32–34].
unless population level “DNAm GA standards” become available, analogous to national references for fetal growth [23]. The raw DNAm GA difference may be a more useful and clinically relevant measure for individ-ual level assessments.
Strengths
The main strength of our study is the use of a well-characterized prospective, ethnically homogenous cohort with data on pre-pregnancy risk factors of pre-eclampsia and intrauterine growth restriction, pregnancy disorders Fig. 5Associations between offspring anthropometry (panelsa–d) and placental weight at birth (panele) and raw epigenetic gestational (GA) difference (DNAm GA-GA) of the offspring at birth based on fetal cord blood methylation data. Associations have been adjusted for cell-type composition, population stratification estimated with two multi-dimensional scaling components based on genome-wide data, and neonatal sex.
validated by a clinical jury consisting of two qualified physicians and a nurse, and data on other maternal and neonatal characteristics extracted from both med-ical records and the Finnish Medmed-ical Birth Register (MBR) [35]. Our sample was enriched for women with known risk factors for pre-eclampsia and intrauterine growth restriction. This resulted in greater variation of the pre- and neonatal characteristics, thus increasing the possibility of being able to detect their effects on the DNAm GA predictor. Furthermore, clinical GA es-timation was based on an ultrasound scan conducted in all women between 12 + 0 and 13 + 6 weeks + days of gestation. DNAm GA was estimated from fetal um-bilical cord blood, and we applied novel methods to
account for any contamination of the samples by ma-ternal blood. A number of studies have shown that cel-lular heterogeneity [36], and genetic variation in the population structure [37, 38], can influence epigenetic profiles. Therefore, we removed any potential effects of cell type heterogeneity using bioinformatics methods and corrected for population structure using principal components derived from genome-wide genotypes.
Limitations
Several strengths of this study are also limitations. The ethnic homogeneity of our sample may preclude gener-alizations for other ethnic groups. Our inclusion criteria, which resulted in enrichment of pregnancy disorders in Fig. 6Associations between offspring small for gestational age (GA) weight at birth (panela), sex (panelb), and Apgar score (panelc), and raw DNAm GA difference (DNAm GA-GA) of the offspring at birth based on fetal cord blood methylation data. Associations are adjusted for cell-type composition and population stratification estimated with two multi-dimensional scaling components based on genome-wide data. Data shown are median, interquartiles, and range.pvalues refer to group differences.Refreferent group
the study population and increased statistical power to detect their effects, also limit generalizability of these findings to women without such risk factors. Finally, our findings are limited to one tissue type; therefore, we could not test cross-tissue correlations. It is also import-ant to note that for some prenatal characteristics, e.g., for insulin-treated diabetes in a previous pregnancy, ma-ternal Sjögren’s syndrome, less than ten pairs of women and neonates were present in the risk group. Therefore, although we observed significant associations, they should be interpreted with caution and need to be repli-cated. Finally, while maternal pre-eclampsia in the index pregnancy, maternal treatment with betamethasone, lower birth weight and length, and lower placental weight remained associated with GAA after Bonferroni correction for multiple testing, this correction may be too conservative as the tested associations were not independent.
Conclusions
Our findings show that a number of maternal and off-spring characteristics known to reflect the offoff-spring’s prenatal environment are associated with variations in the offspring’s DNAm GA at birth based on data from cord blood DNA methylation. Whether this variation is predictive of developmental outcomes in later life is the subject of ongoing studies.
Methods
Study population
Data were taken from the PREDO study, which is a longi-tudinal multicenter pregnancy cohort study of Finnish women and their singleton children born alive between 2006 and 2010 [39]. We recruited 1079 pregnant women, of whom 969 had 1 or more, and 110 had none of the known risk factors for pre-eclampsia and intrauterine growth restriction (Table 1). The recruitment took place in arrival order when these women attended the first ultrasound screening at 12 + 0–13 + 6 weeks + days of ges-tation in 1 of the 10 hospital maternity clinics participat-ing in the study. The cohort profile [39] contains details of the study design, inclusion criteria, and all the data that are available. Additional file 1: Figure S1 shows a flowchart of the 814 mother-offspring pairs with data available for the current study.
Offspring DNA methylation, GA, and DNAm GA at birth
Fetal cord blood samples were collected according to standard procedures. DNA was extracted at the National Institute for Health and Welfare, Helsinki, Finland, and the Department of Medical and Clinical Genetics, University of Helsinki, Finland. Methyla-tion analyses were performed at the Max Planck Institute of Psychiatry in Munich, Germany. DNA
was bisulphite-converted using the EZ-96 DNA
Methylation kit (Zymo Research, Irvine, CA).
Genome-wide methylation status of over 485,000 CpG sites was measured using the Infinium Human Methylation 450 BeadChip (Illumina Inc., San Diego, USA) according to the manufacturer’s protocol. The arrays were scanned using the iScan System (Illu-mina Inc., San Diego, USA). The quality control (QC) pipeline was set up using the R-package minfi (http://bioconductor.org/packages/release/bioc/html/ minfi.html). The samples were excluded if they were duplicates, outliers in the median intensities, and be-cause of sex discrepancy. Furthermore, any probes on chromosome X or Y, cross-hybridizing probes as well as probes containing SNPs, and CpGs with a detection P value > 0.01 in at least 50% of the sam-ples, or maternal blood contamination were ex-cluded. Maternal blood contamination was tested using DNAm data at 10 CpGs independently identi-fied as differentially methylated between cord and adult blood and indicative of maternal blood con-tamination (paper under review). The samples with DNAm values above the previously identified thresh-olds at five or more of these CpGs were considered contaminated and removed from all future analyses. The final dataset contained 428,619 CpGs. Additional file 1: Figure S1 shows that of the 876 samples avail-able for these analyses, 51 were excluded. Methylation beta-values were normalized using the funnorm func-tion and incorporating the first ten principal compo-nents from the internal control probes. To check for batch effects, principal components were computed on these beta values. Two batches, i.e., slide and well, were significantly associated to the main principal components and were removed iteratively using the combat package.
DNAm GA was calculated using the method pub-lished by Knight et al. [21] and was based on the methylation profile of 148 selected CpGs.
We calculated a raw DNAm GA difference by sub-tracting the chronological GA assessed at the first ultrasound screening conducted at 12 + 0–13 + 6 weeks + days of gestation from the predicted DNAm GA. DNAm GA residual was extracted from a linear regres-sion of predicted DNAm GA on ultrasound-based GA.
Offspring cord blood cell counts at birth
Offspring genome-wide genotyping and multi-dimensional scaling analysis
Genotyping was performed on Illumina Human Omni Express Exome Arrays containing 964,193 SNPs. Only markers with a call rate of at least 98%, a minor allele frequency of 1%, and a P value for deviation from Hardy-Weinberg-Equilibrium (P> 1.0 e-06) were kept in the analysis. After QC, 587,290 SNPs were available. Any sample pair with IBD estimates >0.125 was checked for relatedness. For most pairs, high IBD estimates could be explained due to partly African origin. As we cor-rected for admixture in our analyses, these samples were kept except for one pair. For this pair, the high IBD esti-mate could not be resolved and the other one of this pair was excluded from further analysis. The samples showing discrepancies between phenotypic and geno-typic sex were removed. We also checked for heterozy-gosity outliers, but found none. In total, we genotyped 996 samples of which 13 were excluded. Of the samples with DNA methylation data, eight were excluded based on the above criteria (Additional file 1: Figure S1).
We performed multi-dimensional scaling (MDS) ana-lysis on the IBS matrix of quality-controlled genotypes. Apart of those samples with African admixture, no out-liers were detected. The first two components depict this admixture and were included as covariates in the regres-sion analysis.
Maternal characteristics during pregnancy
Pre-pregnancy risk factors of pre-eclampsia and intra-uterine growth restriction were derived from medical re-cords screened for by trained study nurses or clinic personnel at maternity clinics of study hospitals at enrol-ment into the study. These pre-pregnancy risk factors are listed in Table 1.
Pregnancy disorders, derived from hospital records and further verified by a clinical jury [39, 41], in-cluded gestational diabetes, which was defined as fasting, 1- or 2-h plasma glucose during a 75-g oral glucose tolerance test ≥5.1, 10.0 or 8.5 mmol/L, re-spectively, that emerged or was first identified during pregnancy, and further categorized according to treatment as diet or insulin treated; gestational hypertension, which was defined as systolic blood pressure ≥140 mmHg and/or diastolic blood pressure
≥90 mmHg on ≥2 occasions at least 4 h apart in a woman who was normotensive before 20 weeks of gestation; pre-eclampsia, which was defined as sys-tolic blood pressure ≥140 mmHg and/or diastolic blood pressure ≥90 mmHg on ≥2 occasions at least
4 h apart with proteinuria ≥300 mg/24 h.
Pre-eclampsia diagnosis was further divided into early (diagnosis before 34 weeks of gestation) and late pre-eclampsia (diagnosis 34 weeks of gestation or
later), and also into severe (blood pressure
≥160 mmHg systolic and/or ≥110 mmHg diastolic and/or proteinuria ≥5 g/24 h) and non-severe pre-eclampsia (blood pressure 140–159.9 mmHg systolic and/or 90–109.9 mmHg diastolic and/or proteinuria 0.3–4.9 g/24 h); chronic hypertension was defined as systolic/diastolic blood pressure ≥140/90 mmHg or antihypertensive medication before 20 weeks of ges-tation (in 24 out of 135 women chronic hypertension was diagnosed during pregnancy). In addition to pre-pregnancy obesity, data on maternal pre-pre-pregnancy BMI calculated from measured weight and height at the first antenatal clinic visit at 8 + 4 (SD 1 + 3) weeks + days were derived from the Finnish Medical Birth Register (MBR) [35] and data on weight change during pregnancy from medical records.
Information on the antenatal corticosteroid (beta-methasone) treatment was derived from hospital records (one woman received half a standard dose, i.e., 12 mg/24 h, 22 women received one standard dose of 24 mg/24 h, and one woman received two standard doses totalling 48 mg/24 h), and timing of exposure was further defined as the number of days before birth (over 30 vs 30 days or less before birth).
Maternal smoking during pregnancy (non-smoker, quit during first trimester, smoked throughout), parity (prim-iparous vs mult(prim-iparous) and mode of delivery (vaginal delivery vs caesarian section) were derived from the MBR, and alcohol use (yes vs no) and education level (lower secondary or less, upper secondary, tertiary) were reported at 12 + 0–13 + 6 gestational weeks + days.
Offspring characteristics at birth
Weight (kg), length (cm), head circumference (cm), fetal cord blood venous and arterial pH, and 1-min Apgar score were measured at birth, and the birth ponderal index (kg/m3) was calculated. We further divided birth weight and length into normal and small (≤ −2SD) for GA using Finnish national growth references [23].
Statistical analysis
2-tailed p values are given in the tables and Bonferroni-corrected p value threshold reaching a level of p< 0.05 in footnotes. All statistical analyses were performed using SAS 9.4 (SAS Institute, Inc., Cary, NC, USA).
Additional file
Additional file 1: Figure S1. Flowchart of the study participants and sample attrition. (PPTX 38 kb)
Additional file 2: Table S1. Associations between maternal characteristics during pregnancy and offspring DNAm GA at birth based on cord blood methylation data. Table S2. Associations between maternal characteristics during pregnancy and offspring DNAm GA at birth based on cord blood methylation data when additionally adjusting for offspring birth weight SD score at birth*. Table S3. Associations between maternal characteristics and the offspring Horvath epigenetic age at birth based on cord blood methylation data*. Table S4. Associations between offspring characteristics and DNAm GA at birth based on cord blood methylation data. Table S5. Associations between offspring characteristics and the offspring Horvath epigenetic age at birth based on cord blood methylation data*. (DOCX 65 kb)
Abbreviations
DNAm GA:DNA methylation gestational age; DOHaD: Developmental Origins of Health and Disease; GA: Gestational age; GAA: Gestational age acceletaion; GAD: Gestational age deceleration; GDM: Gestational diabetes mellitus; PREDO: Prediction and Prevention of Pre-eclampsia and Intrauterine Growth Restriction Study; SD: Standard deviation; SGA: Small for gestational age
Acknowledgements
The PREDO study would not have been possible without the dedicated contribution of the PREDO study group members: Anu-Katriina Pesonen, A Aitokallio-Tallberg, A-M Henry, VK Hiilesmaa, T Karipohja, R Meri, S Sainio, T Saisto, S Suomalainen-Konig, V-M Ulander, T Vaitilo (Department of Obstetrics and Gynaecology, University of Helsinki and Helsinki University Central Hospital, Helsinki, Finland), L Keski-Nisula, Maija-Riitta Orden (Kuopio University Hospital, Kuopio Finland), E Koistinen, T Walle, R Solja (Northern Karelia Central Hospital, Joensuu, Finland), M Kurkinen (Päijät-Häme Central Hospital, Lahti, Finland), P.Taipale. P Staven (Iisalmi Hospital, Iisalmi, Finland), J Uotila (Tampere University Hospital, Tampere, Finland). We also thank the PREDO cohort participants for their enthusiastic participation. We thank the scientific writer, Jessica Keverne, for editing the final version of our manuscript.
Funding
This work was supported by the Academy of Finland, EVO (a special state subsidy for health science research), and University of Helsinki Research Funds.
Availability of data and materials
Any interested researchers can obtain a de-identified dataset after having obtained an approval from the PREDO Study Board. Data requests may be subject to further review by the National Register Authority and Ethical Committees. Any requests for data use should be addressed to the PREDO Study Board (predo.study@helsinki.fi) or individual researchers.
Authors’contributions
PG contributed to the statistical analyses, writing/editing the manuscript, and prepared the tables and figures. JL contributed to acquisition of the data, analysis of the data, and writing/editing the manuscript. DC and EB performed the methylation analyses and contributed to writing/editing the manuscript. EH, EK, HL, RR, and PV contributed to the acquisition of data and editing the manuscript. AK, MJ, MK, and AS contributed to interpretation of the results and editing the manuscript. AF contributed to writing/editing the manuscript. KR contributed to the conception and design of the work, acquisition of data, analysis of the data, and writing/editing the manuscript. All authors read and approved the final manuscript.
Competing interests
The authors declare that they have no competing interests.
Consent for publication Not applicable.
Ethics approval and consent to participate
The study protocol was approved by the Ethical Committees of the Helsinki and Uusimaa Hospital District and by all participating hospitals. A written informed consent was obtained from all mothers involved in the study.
Publisher’s Note
Springer Nature remains neutral with regard to jurisdictional claims in published maps and institutional affiliations.
Author details
1Institute of Behavioral Sciences, University of Helsinki, Helsinki 00014,
Finland.2Helsinki Collegium of Advanced Studies, University of Helsinki,
Helsinki 00014, Finland.3Department of Translational Research in Psychiatry, Department of Psychiatry and Behavioral Sciences, Max-Planck Institute of Psychiatry, Munich 80804, Germany.4Department of Psychiatry and
Behavioral Sciences, School of Medicine, Emory University, Atlanta 30322, GA, USA.5HUSLAB and Department of Clinical Chemistry, Helsinki University Hospital, Helsinki 00029, Finland.6National Institute for Health and Welfare,
Helsinki and Oulu, Helsinki 00271, Finland.7Children’s Hospital, Helsinki
University Central Hospital and University of Helsinki, Helsinki 00029, Finland.
8
Obstetrics and Gynaecology, University of Helsinki and Helsinki University Hospital Helsinki, Helsinki 00029, Finland.9Medical and Clinical Genetics and
Institute for Molecular Medicine Finland, University of Helsinki and Helsinki University Hospital, Helsinki 00014, Finland.10BHF Centre for Cardiovascular
Science, Queen’s Medical Research Institute, University of Edinburgh, Edinburgh EH16 4TJ, UK.11Genetics and Molecular Biology Program, Emory
University, Atlanta 30322, GA, USA.12Department of Gynecology and
Obstetrics, School of Medicine, Emory University, Atlanta 30322, GA, USA.
13
Department of Psychiatry and Behavioral Sciences, School of Medicine, Emory University, Atlanta, GA, USA.14Centre for Molecular Medicine and
Therapeutics, BC Children’s Hospital and University of British Columbia, Vancouver V6T 1Z4, Canada.
Received: 3 April 2017 Accepted: 28 April 2017
References
1. Johnson AA, Akman K, Calimport SR, Wuttke D, Stolzing A, de Magalhaes JP. The role of DNA methylation in aging, rejuvenation, and age-related disease. Rejuvenation Res. 2012;15(5):483–94.
2. Garagnani P, Bacalini MG, Pirazzini C, Gori D, Giuliani C, Mari D, Di Blasio AM, Gentilini D, Vitale G, Collino S, et al. Methylation of ELOVL2 gene as a new epigenetic marker of age. Aging Cell. 2012;11(6):1132–4.
3. Horvath S, Zhang Y, Langfelder P, Kahn RS, Boks MP, van Eijk K, van den Berg LH, Ophoff RA. Aging effects on DNA methylation modules in human brain and blood tissue. Genome Biol. 2012;13(10):R97.
4. Rakyan VK, Down TA, Maslau S, Andrew T, Yang TP, Beyan H, Whittaker P, McCann OT, Finer S, Valdes AM, et al. Human aging-associated DNA hypermethylation occurs preferentially at bivalent chromatin domains. Genome Res. 2010;20(4):434–9.
5. Teschendorff AE, Menon U, Gentry-Maharaj A, Ramus SJ, Weisenberger DJ, Shen H, Campan M, Noushmehr H, Bell CG, Maxwell AP, et al. Age-dependent DNA methylation of genes that are suppressed in stem cells is a hallmark of cancer. Genome Res. 2010;20(4):440–6.
6. Bell JT, Tsai PC, Yang TP, Pidsley R, Nisbet J, Glass D, Mangino M, Zhai G, Zhang F, Valdes A, et al. Epigenome-wide scans identify differentially methylated regions for age and age-related phenotypes in a healthy ageing population. PLoS Genet. 2012;8(4):e1002629.
7. Hannum G, Guinney J, Zhao L, Zhang L, Hughes G, Sadda S, Klotzle B, Bibikova M, Fan JB, Gao Y, et al. Genome-wide methylation profiles reveal quantitative views of human aging rates. Mol Cell. 2013;49(2):359–67. 8. Horvath S. DNA methylation age of human tissues and cell types. Genome
Biol. 2013;14(10):R115.
9. Perna L, Zhang Y, Mons U, Holleczek B, Saum KU, Brenner H. Epigenetic age acceleration predicts cancer, cardiovascular, and all-cause mortality in a German case cohort. Clin Epigenetics. 2016;8:64.
independently associated with chronological age and mortality. Int J Epidemiol. 2016;45(2):424-32.
11. Horvath S, Gurven M, Levine ME, Trumble BC, Kaplan H, Allayee H, Ritz BR, Chen B, Lu AT, Rickabaugh TM, et al. An epigenetic clock analysis of race/ ethnicity, sex, and coronary heart disease. Genome Biol. 2016;17(1):171. 12. Chen BH, Marioni RE, Colicino E, Peters MJ, Ward-Caviness CK, Tsai PC,
Roetker NS, Just AC, Demerath EW, Guan W, et al. DNA methylation-based measures of biological age: meta-analysis predicting time to death. Aging. 2016;8(9):1844–65.
13. Langie SA, Lara J, Mathers JC. Early determinants of the ageing trajectory. Best Pract Res Clin Endocrinol Metab. 2012;26(5):613–26.
14. Sayer AA, Syddall HE, Gilbody HJ, Dennison EM, Cooper C. Does sarcopenia originate in early life? Findings from the hertfordshire cohort study. J Gerontol A Biol Sci Med Sci. 2004;59(9):M930–934.
15. Cameron N, Demerath EW. Critical periods in human growth and their relationship to diseases of aging. Am J Phys Anthropol. 2002;Suppl 35:159–84. 16. Osmond C, Barker DJ. Fetal, infant, and childhood growth are predictors of
coronary heart disease, diabetes, and hypertension in adult men and women. Environ Health Perspect. 2000;108 Suppl 3:545–53.
17. D'Onofrio BM, Class QA, Rickert ME, Larsson H, Langstrom N, Lichtenstein P. Preterm birth and mortality and morbidity: a population-based quasi-experimental study. JAMA Psychiat. 2013;70(11):1231–40.
18. Gluckman PD, Hanson MA, Cooper C, Thornburg KL. Effect of in utero and early-life conditions on adult health and disease. N Engl J Med. 2008;359(1):61–73. 19. Barker DJ. The fetal and infant origins of adult disease. BMJ Clin Res. 1990;
301(6761):1111.
20. Simpkin AJ, Hemani G, Suderman M, Gaunt TR, Lyttleton O, McArdle WL, Ring SM, Sharp GC, Tilling K, Horvath S, et al. Prenatal and early life influences on epigenetic age in children: a study of mother-offspring pairs from two cohort studies. Hum Mol Genet. 2016;25(1):191–201.
21. Knight AK, Craig JM, Theda C, Baekvad-Hansen M, Bybjerg-Grauholm J, Hansen CS, Hollegaard MV, Hougaard DM, Mortensen PB, Weinsheimer SM, et al. An epigenetic clock for gestational age at birth based on blood methylation data. Genome Biol. 2016;17(1):206.
22. Bohlin J, Haberg SE, Magnus P, Reese SE, Gjessing HK, Magnus MC, Parr CL, Page CM, London SJ, Nystad W. Prediction of gestational age based on genome-wide differentially methylated regions. Genome Biol. 2016;17(1):207. 23. Pihkala J, Hakala T, Voutilainen P, Raivio K. Characteristic of recent fetal
growth curves in Finland. Duodecim. 1989;105(18):1540–6.
24. Liggins GC, Howie RN. A controlled trial of antepartum glucocorticoid treatment for prevention of the respiratory distress syndrome in premature infants. Pediatrics. 1972;50(4):515–25.
25. Horvath S, Erhart W, Brosch M, Ammerpohl O, von Schonfels W, Ahrens M, Heits N, Bell JT, Tsai PC, Spector TD, et al. Obesity accelerates epigenetic aging of human liver. Proc Natl Acad Sci U S A. 2014;111(43):15538–43. 26. Marioni RE, Shah S, McRae AF, Ritchie SJ, Muniz-Terrera G, Harris SE, Gibson
J, Redmond P, Cox SR, Pattie A, et al. The epigenetic clock is correlated with physical and cognitive fitness in the lothian birth cohort 1936. Int J Epidemiol. 2015;44(4):1388–96.
27. Osler M, Lund R, Kriegbaum M, Andersen AM. The influence of birth weight and body mass in early adulthood on early coronary heart disease risk among Danish men born in 1953. Eur J Epidemiol. 2009;24(1):57–61. 28. Frankel S, Elwood P, Sweetnam P, Yarnell J, Smith GD. Birthweight,
body-mass index in middle age, and incident coronary heart disease. Lancet. 1996;348(9040):1478–80.
29. Barker DJ, Godfrey KM, Fall C, Osmond C, Winter PD, Shaheen SO. Relation of birth weight and childhood respiratory infection to adult lung function and death from chronic obstructive airways disease. BMJ. 1991;303(6804):671–5. 30. Rich-Edwards JW, Stampfer MJ, Manson JE, Rosner B, Hankinson SE, Colditz GA,
Willett WC, Hennekens CH. Birth weight and risk of cardiovascular disease in a cohort of women followed up since 1976. BMJ. 1997;315(7105):396–400. 31. Visentin S, Grumolato F, Nardelli GB, Di Camillo B, Grisan E, Cosmi E. Early
origins of adult disease: low birth weight and vascular remodeling. Atherosclerosis. 2014;237(2):391–9.
32. Hernandez DG, Nalls MA, Gibbs JR, Arepalli S, van der Brug M, Chong S, Moore M, Longo DL, Cookson MR, Traynor BJ, et al. Distinct DNA methylation changes highly correlated with chronological age in the human brain. Hum Mol Genet. 2011;20(6):1164–72.
33. Massart R, Nemoda Z, Suderman MJ, Sutti S, Ruggiero AM, Dettmer AM, Suomi SJ, Szyf M. Early life adversity alters normal sex-dependent
developmental dynamics of DNA methylation. Dev Psychopathol. 2016; 28(4pt2):1259–72.
34. Steegenga WT, Boekschoten MV, Lute C, Hooiveld GJ, de Groot PJ, Morris TJ, Teschendorff AE, Butcher LM, Beck S, Muller M. Genome-wide age-related changes in DNA methylation and gene expression in human PBMCs. Age (Dordr). 2014;36(3):9648.
35. Gissler M. Finnish health and social welfare registers in epidemiological research. Norsk Epidemiol. 2004;14(1):113–20.
36. Lam LL, Emberly E, Fraser HB, Neumann SM, Chen E, Miller GE, Kobor MS. Factors underlying variable DNA methylation in a human community cohort. Proc Natl Acad Sci U S A. 2012;109 Suppl 2:17253–60.
37. Barfield RT, Almli LM, Kilaru V, Smith AK, Mercer KB, Duncan R, Klengel T, Mehta D, Binder EB, Epstein MP, et al. Accounting for population stratification in DNA methylation studies. Genet Epidemiol. 2014;38(3):231–41.
38. Smith AK, Kilaru V, Kocak M, Almli LM, Mercer KB, Ressler KJ, Tylavsky FA, Conneely KN. Methylation quantitative trait loci (meQTLs) are consistently detected across ancestry, developmental stage, and tissue type. BMC Genomics. 2014;15:145.
39. Girchenko P, Hamalainen E, Kajantie E, Pesonen AK, Villa P, Laivuori H, Raikkonen K. Prediction and Prevention of Preeclampsia and Intrauterine Growth Restriction (PREDO) study. Int J Epidemiol. 2016;1-9.
40. Bakulski KM, Feinberg JI, Andrews SV, Yang J, Brown S, LM S, Witter F, Walston J, Feinberg AP, Fallin MD. DNA methylation of cord blood cell types: applications for mixed cell birth studies. Epigenetics. 2016;11(5):354–62. 41. Villa PM, Kajantie E, Raikkonen K, Pesonen AK, Hamalainen E, Vainio M,
Taipale P, Laivuori H. Aspirin in the prevention of pre-eclampsia in high-risk women: a randomised placebo-controlled PREDO Trial and a meta-analysis of randomised trials. BJOG. 2013;120(1):64–74.
• We accept pre-submission inquiries
• Our selector tool helps you to find the most relevant journal
• We provide round the clock customer support • Convenient online submission
• Thorough peer review
• Inclusion in PubMed and all major indexing services
• Maximum visibility for your research
Submit your manuscript at www.biomedcentral.com/submit