EC2034 TELEVISION AND VIDEO ENGINEERING UNIT I FUNDAMENTALS OF TELEVISION
Aspect ratio-Image continuity-Number of scanning lines-Interlaced scanning-Picture resolution-Camera tubes-Image Orthicon-Vidicon- Plumbicon- Silicon Diode Array Vidicon- Solid-state Image scanners-Monochrome picture tubes- Composite video signal- video signal dimension-horizontal sync. Composition-vertical sync. Details functions of Composition-vertical pulse train- Scanning sequence details. Picture signal transmission positive and negative modulation- VSB transmission- Sound signal transmission- Standard channel bandwidth.
UNIT II MONOCHROME TELEVISION TRANSMITTER AND RECEIVER
TV transmitter-TV signal Propagation- Interference- TV Transmission Antennas-Monochrome TV receiver- RF tuner- UHF, VHF tuner-Digital tuning techniques-AFT- IF subsystems-AGC Noise cancellation-Video and Sound inter-carrier detection-Vision IF subsystem- DC re-insertion-Video amplifier circuits-Sync operation- typical sync processing circuits-Deflection current waveforms, Deflection oscillators- Frame deflection circuits- requirements- Line deflection circuits-EHT generation-Receiver antennas.
UNIT III ESSENTIALS OF COLOUR TELEVISION
Compatibility- Colour perception-Three colour theory- Luminance, Hue and saturation- Colour television cameras-Values of luminance and colour difference signals-Colour television display tubes-Delta-gun Precision-in-line and Trinitron colour picture tubes- Purity and convergence- Purity and static and Dynamic convergence adjustments- Pincushion-correction techniques-Automatic degaussing circuit- Gray scale tracking colour signal transmission- Bandwidth-Modulation of colour difference signals-Weighting factors-Formation of chrominance signal.
UNIT IV COLOUR TELEVISION SYSTEMS
NTSC colour TV systems-SECAM system- PAL colour TV systems- Cancellation of phase errors-PAL-D Colour system-PAL coder-PAL-Decoder receiver-Chromo signal amplifier-separation of U and V signals-colour burst separation-Burst phase Discriminator-ACC amplifier-Reference Oscillator-Ident and signals-colour killer circuits-U and V demodulators- Colour signal matrixing. Sound in TV
UNIT V ADVANCED TELEVISION SYSTEMS
Satellite TV technology-Geo Stationary Satellites-Satellite Electronics-Domestic Broadcast System-Cable TV-Cable Signal Sources-Cable Signal Processing, Distribution & Scrambling- Video Recording-VCR Electronics-Video Home Formats- Video Disc recording and playback-DVD Players-Tele Text Signal coding and broadcast receiver- Digital television-Transmission and reception –Projection television-Flat panel display TV receivers-LCD and Plasma screen receivers-3DTV-EDTV.
TEXTBOOKS:
1. R.R.Gulati, “Monochrome Television Practice, Principles, Technology and servicing.” Third Edition 2006, New Age International (P) Publishers.
2. R.R.Gulati, Monochrome & Color Television, New Age International Publisher, 2003.
REFERENCES:
EC 2034 TELEVISION AND VIDEO ENGINEERING
S.NO CONTENTS PAGE.
NO UNIT I
FUNDAMENTALS OF TELEVISION
1.1 ASPECT RATIO
9
1.2 IMAGE CONTINUITY 9
1.3 NUMBER OF SCANNING LINES
12
1.4 INTERLACED SCANNING
14
1.5 PICTURE RESOLUTION 17
1.6 CAMERA TUBES 18
1.7 IMAGE ORTHICON 23
1.8 VIDICON 28
1.9 PLUMBICON 32
1.10 SILICON DIODE ARRAY VIDICON 34
1.11 SOLID-STATE IMAGE SCANNERS 35
1.12 MONOCHROME PICTURE TUBES 39
1.13 COMPOSITE VIDEO SIGNAL
41
1.14 VIDEO SIGNAL DIMENSION 42
1.15 HORIZONTAL SYNC. COMPOSITION
45
1.16 VERTICAL SYNC. DETAILSFUNCTIONS OF VERTICAL PULSETRAIN 47
1.17 SCANNING SEQUENCE DETAILS. PICTURE SIGNALTRANSMISSIONPOSITIVE AND NEGATIVE MODULATION
55
1.18 VSB TRANSMISSION
1.19 SOUND SIGNAL TRANSMISSION 60
1.20 STANDARD CHANNEL BANDWIDTH 61
UNIT II
MONOCHROME TELEVISION TRANSMITTER AND
2.1 TV TRANSMITTER 62
2.2 TV SIGNAL PROPAGATION 63
2.3 INTERFERENCE 63
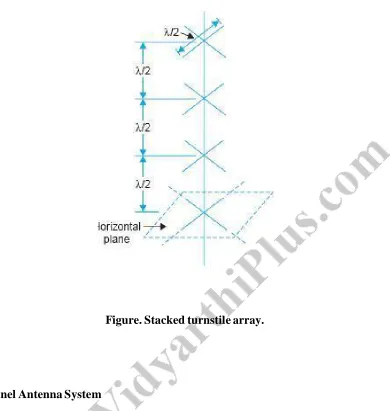
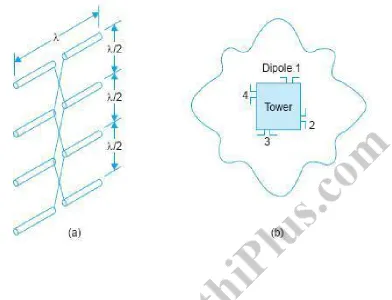
2.4 TV TRANSMISSION ANTENNAS 63
2.5 MONOCHROME TV RECEIVER 67
2.6 RF TUNER UHF, VHF TUNER 70
2.7 DIGITAL TUNING TECHNIQUES 72
2.8 AFT-IF SUBSYSTEMS 74
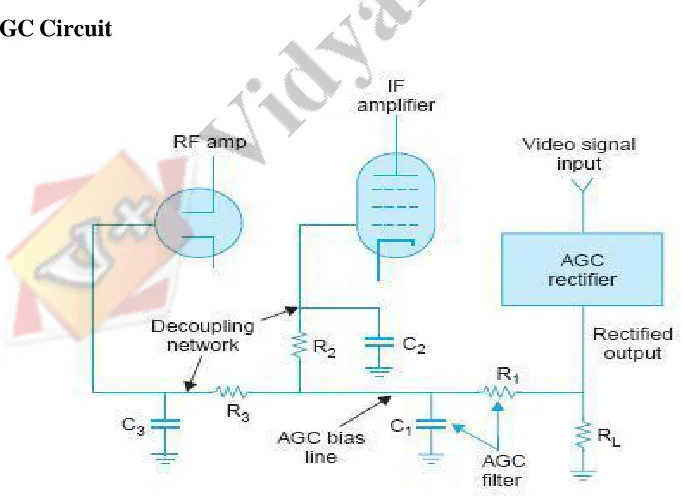
2.9 AGC NOISE CANCELLATION 75
2.10 VIDEO AND SOUND INTER-CARRIER DETECTION 76
2.11 VISION IF SUBSYSTEM 77
2.12 DC RE-INSERTION 77
2.13 VIDEO AMPLIFIER CIRCUITS 79
2.14 SYNC OPERATION 80
2.15 TYPICAL SYNC PROCESSING CIRCUITS 81
2.16 DEFLECTION CURRENT WAVEFORMS, DEFLECTION OSCILLATORS 81
2.17 FRAME DEFLECTION CIRCUITS- REQUIREMENTS 82
2.18 LINE DEFLECTION CIRCUITS 83
2.20 RECEIVER ANTENNAS 86
UNIT III
ESSENTIALS OF COLOUR TELEVISION
3.1 COMPATIBILITY 92
3.2 COLOUR PERCEPTION 92
3.3 THREE COLOUR THEORY 93
3.4 LUMINANCE, HUE AND SATURATION 96
3.5 COLOUR TELEVISION CAMERAS 98
3.6 VALUES OF LUMINANCE AND COLOUR DIFFERENCE SIGNALS 100
3.7 COLOUR TELEVISION DISPLAY TUBES 101
3.8 DELTA-GUN 102
3.9 PRECISION-IN-LINE 103
3.10 TRINITRON COLOUR PICTURE TUBES 104
3.11 PURITY AND STATIC AND DYNAMIC CONVERGENCE ADJUSTMENTS
105
3.12 PINCUSHION-CORRECTION TECHNIQUES 115
3.13 AUTOMATIC DEGAUSSING CIRCUIT 117
3.14 GRAY SCALE TRACKING 117
3.15 COLOUR SIGNAL TRANSMISSION 118
3.16 BANDWIDTH-MODULATION OF COLOUR DIFFERENCE SIGNALS 119
3.17 WEIGHTING FACTORS 124
3.18 FORMATION OF CHROMINANCE SIGNAL 127
UNIT IV
COLOUR TELEVISION SYSTEMS
4.2 SECAM SYSTEM 138
4.3 PAL COLOUR TV SYSTEMS 143
4.4 CANCELLATION OF PHASE ERRORS 145
4.5 PAL-D COLOUR SYSTEM 147
4.6 PAL CODER 149
4.7 PAL-DECODER RECEIVER 151
4.8 CHROMO SIGNAL AMPLIFIER 152
4.9 SEPARATION OF U AND V SIGNALS 153
4.10 COLOUR BURST SEPARATION 153
4.11 BURST PHASE DISCRIMINATOR 153
4.12 ACC AMPLIFIER 154
4.13 REFERENCE OSCILLATOR 154
4.14 IDENT AND COLOUR KILLER CIRCUITS 155
4.15 U AND V DEMODULATORS 157
4.16 COLOUR SIGNAL MATRIXING. SOUND IN TV 158
UNIT V
ADVANCED TELEVISION SYSTEMS
5.1 SATELLITE TV TECHNOLOGY 163
5.2 GEO STATIONARY SATELLITES 163
5.3 SATELLITE ELECTRONICS 164
5.7 CABLE SIGNAL PROCESSING,DISTRIBUTION& SCRAMBLING 171
5.8 VIDEO RECORDING 176
5.9 VCR ELECTRONICS 176
5.10 VIDEO HOME FORMATS 179
5.11 VIDEO DISC RECORDING AND PLAYBACK 178
5.12 DVD PLAYERS 179
5.13 TELE TEXT SIGNAL CODING AND BROADCAST RECEIVER 173
5.14 DIGITAL TELEVISION 174
5.15 TRANSMISSION AND RECEPTION 174
5.16 FLAT PANEL DISPLAY TV RECEIVERS 181
5.17 LCD AND PLASMA SCREEN RECEIVERS 181
5.18 3DTV 175
UNIT I
FUNDAMENTALS OF TELEVISION
1.1.ASPECT RATIO
The frame adopted in all television systems is rectangular with width/height ratio, i.e., aspect ratio = 4/3. There are many reasons for this choice. In human affairs most of the motion occurs in the horizontal plane and so a larger width is desirable.
The eyes can view with more ease and comfort when the width of a picture is more than its height. The usage of rectangular frame in motion pictures with a width/height ratio of 4/3 is another important reason for adopting this shape and aspect ratio.
This enables direct television transmission of film programmes without wastage of any film area.
It is not necessary that the size of the picture produced on the receiver screen be same as that being televised but it is essential that the aspect ratio of the two be same, otherwise the scene details would look too thin or too wide.
This is achieved by setting the magnitudes of the current in the deflection coils to correct values, both at the TV camera and receiving picture tube.
Another important requirement is that the same coordinates should be scanned at any instant both by the camera tube beam and the picture tube beam in the receiver. Synchronizing pulses are transmitted along with the picture information to achieve exact congruence between transmitter and receiver scanning systems.
1.2.IMAGE CONTINUITY
While televising picture elements of the frame by means of the scanning process, it is necessary to present the picture to the eye in such a way that an illusion of continuity is created and any motion in the scene appears on the picture tube screen as a smooth and continuous change.
To achieve this, advantage is taken of ‘persistence of vision’ or storage characteristics of the human eye. This arises from the fact that the sensation produced when nerves of the eye’s retina are stimulated by incident light does not cease immediately after the light is removed but persists for about 1/16th of a second.
Thus if the scanning rate per second is made greater than sixteen, or the number of pictures shown per second is more than sixteen, the eye is able to integrate the changing levels of brightness in the scene. So when the picture elements are scanned rapidly enough, they appear to the eye as a complete picture unit, with none of the individual elements visible separately.
A shutter in the projector rotates in front of the light source and allows the film to be projected on the screen when the film frame is still, but blanks out any light from the screen during the time when the next film frame is being moved into position.
As a result, a rapid succession of still-film frames is seen on the screen. With all light removed during the change from one frame to the next, the eye sees a rapid sequence of still pictures that provides the illusion of continuous motion. Scanning. A similar process is carried out in the television system.
Figure. Path of scanning beam in covering picture area
The scene is scanned rapidly both in the horizontal and vertical directions simultaneously to provide sufficient number of complete pictures or frames per second to give the illusion of continuous motion. Instead of the 24 as in commercial motion picture practice, the frame repetition rate is 25 per second in most television systems.
Horizontal scanning. Fig. (a) shows the trace and retrace of several horizontal lines. The linear rise of current in the horizontal deflection coils (Fig. (b)) deflects the beam across the screen with a continuous, uniform motion for the trace from left to right.
This fast reversal produces the retrace or flyback. The start of the horizontal trace is at the left edge of raster. The finish is at the right edge, where the fl yback produces retrace back to the left edge. Note, that‘up’on the sawtooth wave corresponds to horizontal deflection to the right. The heavy lines in Fig. (a) indicate the useful scanning time and the dashed lines correspond to the retrace time.
Vertical scanning. The sawtooth current in the vertical deflection coils (see Fig.) moves the electron beam from top to bottom of the raster at a uniform speed while the electron beam is being deflected horizontally.
Thus the beam produces complete horizontal lines one below the other while moving from top to bottom. As shown in Fig. (c), the trace part of the sawtooth wave for vertical scanning deflects the beam to the bottom of the raster. Then the rapid vertical retrace returns the beam to the top.
Note that the maximum amplitude of the vertical sweep current brings the beam to the bottom of the raster. As shown in Fig. (b) during vertical retrace the horizontal scanning continues and several lines get scanned during this period. Because of motion in the scene being televised, the information or brightness at the top of the target plate or picture tube screen normally changes by the time the beam returns to the top to recommence the whole process.
This information is picked up during the next scanning cycle and the whole process is repeated 25 times to cause an illusion of continuity. The actual scanning sequence is however a little more complex than that just described and is explained in a later section of this chapter. It must however be noted, that both during horizontal retrace and vertical retrace intervals the scanning beams at the camera tube and picture tube are blanked and no picture information is either picked up or reproduced.
Instead, on a time division basis, these short retrace intervals are utilized for transmitting distinct narrow pulses to keep the sweep oscillators of the picture tube deflection circuits of the receiver in synchronism with those of the camera at the transmitter.
This ensures exact correspondence in scanning at the two ends and results in distortion less reproduction of the picture details.
1.3.NUMBER OF SCANNING LINES
Most scenes have brightness gradations in the vertical direction. The ability of the scanning beam to allow reproduction of electrical signals according to these variations and the capability of the human eye to resolve these distinctly, while viewing the reproduced picture, depends on the total number of lines employed for scanning.
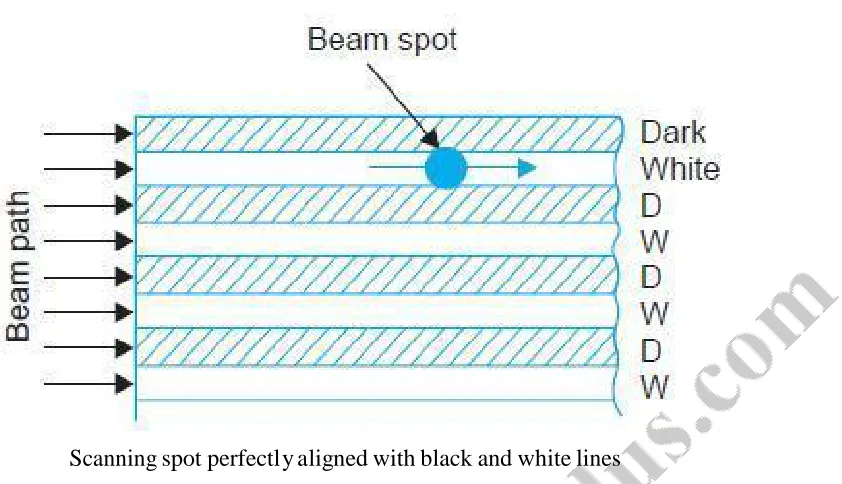
It is possible to arrive at some estimates of the number of lines necessary by considering the bar pattern shown in Fig. (a), where alternate lines are black and white. If the thickness of the scanning beam is equal to the width of each white and black bar, and the number of scanning lines is chosen equal to the number of bars, the electrical information corresponding to the brightness of each bar will be correctly reproduced during the scanning process.
Obviously the greater the number of lines into which the picture is divided in the vertical plane, the better will be the resolution.However, the total number of lines that need be employed is limited by the resolving capability of the human eye at the minimum viewing distance.
The maximum number of alternate light and dark elements (lines) which can be resolved by the eye is given by 1N v = αρ where N v = total number of lines (elements) to be resolved in the vertical direction, α = minimum resolving angle of the eye expressed in radians, andρ= D/H = viewing-distance/picture height.
For the eye this resolution is determined by the structure of the retina, and the brightness level of the picture. it has been determined experimently that with reasonable brightness variations and a minimum viewing distance of four times the picture height (D/H = 4), the angle that any two adjacent elements must subtend at the eye for distinct resolution is approximately one minute (1/60 degree). This is illustrated in Fig (b). Substituting these values ofαandρwe get 1≈860 (π/ 180 × 1 / 60 ) × 4
Thus if the total number of scanning lines is chosen close to 860 and the scanning beam as illustrated in Fig. (a) just passes over each bar (line) separately while scanning all the lines from top to bottom of the picture frame, a distinct pick up of the picture information results and this is the best that can be expected from the system.
This perhaps explains the use of 819 lines in the original French TV system. In practice however, the picture elements are not arranged as equally spaced segments but have random distribution of black, grey and white depending on the nature of the picture details or the scene under consideration.
Statistical analysis and subjective tests carried out to determine the average number of effective lines suggest that about 70 per cent of the total lines or segments get separatel y scanned in the vertical direction and the remaining 30 per cent get merged with other elements due to the beam spot falling equally on two consecutive lines.
Scanning spot perfectly aligned with black and white lines
However, there are other factors which also influence the choice of total number of lines in a TV system.
Tests conducted with many observers have shown that though the eye can detect the effective sharpness provided by about 800 scanning lines, but the improvement is not very significant with line numbers greater than 500 while viewing pictures having motion. Also the channel bandwidth increases with increase in number of lines and this not only adds to the cost of the system but also reduces the number of television channels that can be provided in a given VHF or UHF transmission band.
Thus as a compromise between quality and cost, the total number of lines inclusive of those lost during vertical retrace has been chosen to be 625 in the 625-B monochrome TV system. In the 525 line American system, the total number of lines has been fixed at 525 because of a somewhat higher scanning rate employed in this system.
Figure. Scanning beam focused on the junction of black and white lines.
1.4. INTERLACED SCANNING
Interlaced scanning. In television pictures an effective rate of 50 vertical scans per second is utilized to reduce flicker. This is accomplished by increasing the downward rate of travel of the scanning electron beam, so that every alternate line gets scanned instead of every successive line.
Then, when the beam reaches the bottom of the picture frame, it quickly returns to the top to scan those lines that were missed in the previous scanning. Thus the total number of lines are divided into two groups called ‘fields’. Each field is scanned alternately. This method of scanning is known as interlaced scanning and is illustrated in Fig. It reduces flicker to an acceptable level since the area of the screen is covered at twice the rate. This is like reading alternate lines of a page from top to bottom once and then going back
to read the remaining lines down to the bottom.In the 625 lime monochrome system, for successful interlaced scanning, the 625 lines of each frame or picture are divided into sets of 312.5 lines and each set is scanned alternately to cover the entire picture area.
To achieve this the horizontal sweep oscillator is made to work at a frequency of 15625 Hz (312.5 × 50 = 15625) to scan the same number of lines per frame (15625/25 = 625 lines), but the vertical sweep circuit is run at a frequency of 50 instead of 25 Hz.
Since the first field ends in a half line and the second field commences at middle of the line on the top of the target plate or screen (see Fig), the beam is able to scan the remaining 312.5 alternate lines during its downward journey. In all then, the beam scans 625 lines (312.5 × 2 = 625) per frame at the same rate of 15625 lines (312.5 × 50 = 15625) per second. Therefore, with interlaced scanning the flicker effect is eliminated without increasing the speed of scanning, which in turn does not need any increase in the channel bandwidth. It may be noted that the frame repetition rate of 25 (rather than 24 as used in motion pictures) was chosen to make the field frequency equal to the power line frequency of 50 Hz.
This helps in reducing the undesired effects of hum due to pick up from the mains, because then such effects in the picture stay still, instead of drifting up or down on the screen.
In the American TV system, a field frequency of 60 was adopted because the suppl y frequency is 60 Hz in USA. This brings the total number of lines scanned per second ((525/2) × 60 = 15750) lines to practically the same as in the 625 line system. Scanning periods.
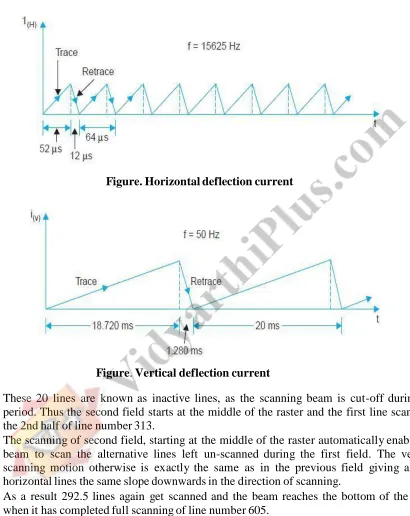
The wave shapes of both horizontal and vertical sweep currents are shown in Fig. As shown there the retrace times involved (both horizontal and vertical) are due to physical limitations of practical scanning systems and are not utilized for transmitting or receiving any video signal.
The nominal duration of the horizontal line as shown in Fig. (a)is 64μs (10 6 /15625 = 64 μs), out of which the active line period is 52 μs and the remaining 12 μs is the line blanking period. The beam returns during this short interval to the extreme left side of the frame to start tracing the next line.
Similarly with the field frequency set at 50 Hz, the nominal duration of the vertical trace (see Fig (b)) is 20 ms (1/50 = 20 ms). Out of this period of 20 ms, 18.720 ms are spent in bringing the beam from top to bottom and the remaining 1.280 ms is taken by the beam to return back to the top to commence the next cycle.
Since the horizontal and vertical sweep oscillators operate continuously to achieve the fast sequence of interlaced scanning, 20 horizontal lines F G 1280 μ s = 20 lines I J get traced during each vertical retrace interval.
Thus 40 scanning H 64 μ s K lines are lost per frame, as blanked lines during the retrace interval of two fields. This leaves the active number of lines, Na , for scanning the picture details equal to 625 – 40 = 585, instead of the 625 lines actually scanned per frame. Scanning sequence.
Figure. Principle of interlaced scanning. Note that the vertical retrace time has been assumed to be zero
The beam starts at A, and sweeps across the frame with uniform velocity to cover all the picture elements in one horizontal line. At the end of this trace the beam then retraces rapidly to the left side of the frame as shown by the dashed line in the illustration to begin the next horizontal line.
Note that the horizontal lines slope downwards in the direction of scanning because the vertical deflecting current simultaneously produces a vertical scanning motion, which is very slow compared with horizontal scanning. The slope of the horizontal trace from left to right is greater than during retrace from right to left.
The reason is that the faster retrace does not allow the beam so much time to be deflected vertically. After line one, the beam is at the left side ready to scan line 3, omitting the second line.
However, as mentioned earlier it is convenient to number the lines as they are scanned and so the next scanned line skipping one line, is numbered two and not three. This process continues till the last line gets scanned half when the vertical motion reaches the bottom of the raster or frame.
Now the retrace starts and takes a period equal to 20 horizontal line periods to reach the top marked C.
Figure. Horizontal deflection current
Figure. Vertical deflection current
These 20 lines are known as inactive lines, as the scanning beam is cut-off during this period. Thus the second field starts at the middle of the raster and the first line scanned is the 2nd half of line number 313.
The scanning of second field, starting at the middle of the raster automatically enables the beam to scan the alternative lines left un-scanned during the first field. The vertical scanning motion otherwise is exactly the same as in the previous field giving all the horizontal lines the same slope downwards in the direction of scanning.
As a result 292.5 lines again get scanned and the beam reaches the bottom of the frame when it has completed full scanning of line number 605.
not only creates an illusion of continuity but also solves the problem of flicker satisfactorily.
Figure. Odd line interlaced scanning procedure.
1.6. TELEVISION CAMERA TUBES
A TV camera tube may be called the eye of a TV system. For such an analogy to be correct the tube must possess characteristic that are similar to its human counterpart. Some of the more important functions must be,
(i) sensitivity to visible light, (ii) wide dynamic range with respect to light intensity, and (iii) ability to resolve details while viewing a multi-element scene.
During the development of television, the limiting factor on the ultimate performance had always been the optical-electrical conversion device, i.e., the pick-up tube.
Most types developed have suffered to a greater or lesser extent from (i) poor sensitivity, (ii) poor resolution, (iii) high noise level, (iv) undesirable spectral response, (v) instability, (vi) poor contrast range and (vii) difficulties of processing. However, development work during the past fifty years or so, has enabled scientists and engineers to develop image pick-up tubes, which not only meet the desired requirements but in fact excel the human eye in certain respects.
BASIC PRINCIPLE
When minute details of a picture are taken into account, any picture appears to be composed of small elementary areas of light or shade, which are known as picture elements. The elements thus contain the visual image of the scene.
The purpose of a TV pick-up tube is to sense each element independently and develop a signal in electrical form proportional to the brightness of each element. As already explained in Chapter 1, light from the scene is focused on a photosensitive surface known as the image plate, and the optical image thus formed with a lens system represents light intensity variations of the scene.
The photoelectric properties of the image plate then convert different light intensities into corresponding electrical variations.
In addition to this photoelectric conversion whereby the optical information is transduced to electrical charge distribution on the photosensitive image plate, it is necessary to pick-up this information as fast as possible. Since simultaneous pick-pick-up is not possible, scanning by an electron beam is resorted to.
The electron beam moves across the image plate line by line, and field by field to provide signal variations in a successive order. This scanning process divides the image into its basic picture elements. Through the entire image plate is photoelectric, its construction isolates the picture elements so that each discrete small area can produce its own signal variations.
Photoelectric Effects
The two photoelectric effects used for converting variations of light intensity into electrical variations are (i) photoemission and (ii) photoconductivity. Certain metals emit electrons when light falls on their surface.
These emitted electrons are called photoelectrons and the emitting surface a photocathode. Light consists of small bundles of energy called photons. When light is made incident on a photocathode, the photons give away their energy to the outer valence electrons to allow them to overcome the potential-energy barrier at the surface.
The number of electrons which can overcome the potential barrier and get emitted, depends on the light intensity. Alkali metals are used as photocathode because they have very low work-function.
Cesium-silver or bismuth-silver-cesium oxides are preferred as photo emissive surfaces because they are sensitive to incandescent light and have spectral response very close to the human eye. The second method of producing an electrical image is by photoconduction, where the conductivity or resistivity of the photosensitive surface varies in proportion to the intensity of light focused on it.
the signal output from the camera for the light on each picture element is produced only at the instant it is scanned.
Most of the illumination is wasted. Since the effect of light on the image plate cannot be stored, any instantaneous pick-up has low sensitivity. Image di-sector and flying-spot camera are examples of non-storage type of tubes. These are no longer in use and will not be discussed.
High camera sensitivity is necessary to televise scenes at low light levels and to achieve this, storage t ype tubes have been developed. In storage type camera tubes the effect of illumination on every picture element is allowed to accumulate between the times it is scanned in successive frames. With light storage tubes the amount of photoelectric signal an be increased 10,000 times approximately compared with the earlier non-storage type.
The Electron Scanning Beam
As in the case of picture tubes an electron gun produces a narrow beam of electrons for scanning. In camera tubes magnetic focusing is normally employed. The electrons must be focused to a very narrow and thin beam because this is what determines the resolving capability of the camera.
The diameter of the beam determines the size of the smallest picture element and hence the finest detail of the scene to which it can be resolved. Any movement of electric charge is a flow of current and thus the electron beam constitutes a very small current which leaves the cathode in the electron gun and scans the target plate.
The scanning is done by deflecting the beam with the help of magnetic fields produced by horizontal and vertical coils in the deflection yoke put around the tubes. The beam scans 312.5 lines per field and 50 such fields are scanned per second.
Video Signal
In tubes employing photo emissive target plates the electron beam deposits some charge on the target plate, which is proportional to the light intensity variations in the scene being televised.
The beam motion is so controlled by electric and magnetic fields, that it is decelerated before it reaches the target and lands on it with almost zero velocity to avoid any secondary emission.
Because of the negative acceleration the beam is made to move back from the target and on its return journey, which is very accurately controlled by the focusing and deflection coils, it strikes an electrode which is located very close to the cathode from where it started. The number of electrons in the returning beam will thus vary in accordance with the charge deposited on the target plate.
The amplitude of this current varies in accordance with the resistance offered by the surface at different points. Since the conductivity of the material varies in accordance with the light falling on it, the magnitude of the current represents the brightness variations of the scene.
This varying current completes its path under the influence of an applied dc voltage through a load resistance connected in series with path of the current. The instantaneous voltage developed across the load resistance is the video signal which, after due amplification and processing is amplitude modulated and transmitted.
Figure (b) shows a simplified illustration of this method of developing video signal.Electron Multiplier When the surface of a metal is bombarded by incident electrons having high velocities, secondary emission takes place.
Aluminium, as an example, can release several secondary electrons for each incident primary electron. Camera tubes often include an electron multiplier structure, making use of the secondary emission effect to amplify the small amount of photoelectric current that is later employed to develop video signal.
The electron multiplier is a series of cold anode- cathode electrodes called dynodes mounted internally, with each at a progressively higher positive potential as illustrated in Fig. The few electrons emitted by the photocathode are accelerated to a more positive dynode.
The primary electrons can then force the ejection of secondary emission electrons when the velocity of the incident electrons is large enough. The secondary emission ratio is normally three or four, depending on the surface and the potential applied.
Figure. Production of video signal by photoemission
Since the signal amplitude is very low any conventional amplifier, if used instead of the electron multiplier, would cause serious S/N ratio problems
Figure. Production of video signal by photoconduction.
1.7. IMAGE ORTHICON
This tube makes use of the high photo emissive sensitivity obtainable from photocathodes, image multiplication at the target caused by secondary emission and an electron multiplier.
A sectional view of an image orthicon is shown in Fig. It has three main sections: image section, scanning section and electron gun-cum-multiplier section. (i) Image Section The inside of the glass face plate at the front is coated with a silver, antimony coating sensitized with cesium, to serve as photocathode.
Light from the scene to be televised is focused on the photocathode surface by a lens system and the optical image thus formed results in the release of electrons from each point on the photocathode in proportion to the incident light intensity. Photocathode surface is semitransparent and the light rays penetrate it to reach its inner surface from where electron emission takes place.
Since the number of electrons emitted at any point in the photocathode has a distribution corresponding to the brightness of the optical image, an electron image of the scene or picture gets formed on the target side of the photo coating and extends towards it. Through the conversion efficiency of the photocathode is quite high, it cannot store charge being a conductor.
For this reason, the electron image produced at the photocathode is made to move towards the target plate located at a short distance from it. The target plate is made of a very thin sheet of glass and can store the charge received by it.
This is maintained at about 400 volts more positive with respect to the photocathode, and the resultant electric field gives the desired acceleration and motion to the emitted electrons towards it. The electrons, while in motion, have a tendency to repel each other and thin can result in distortion of the information now available as charge image. To prevent this divergence effect an axial magnetic field, generated in this region by the ‘longfocus coil’is employed.
This magnetic field imparts helical motion of increasing pitch and focuses the emitted electrons on the target into a well-defined electron image of the original optical image. The image side of the target has a very small deposit of cesium and thus has a high secondary emission ratio.
Because of the high velocity attained by the electrons while in motion from photocathode to the target plate, secondary emission results, as the electrons bombard the target surface.
The wire-mesh screen has about 300 meshes per cm 2 with an open area of 50 to 75 per cent, so that the screen wires do not interfere with the electron image.
The secondary electrons leave behind on the target plate surface, a positive charge distribution, corresponding to the light intensity distribution on the original photocathode. For storage action this charge on the target plate should not spread laterally over its surface, during the storage time, since this would destroy the resolution of the device.
To achieve this the target is made out of extremely thin sheet of glass. The positive charge distribution builds up during the frame storage time (40 ms) and thus enhances the sensitivity of the tube. It should be clearly understood, that the light from the scene being televised continuously falls on the photocathode, and the resultant emitted electrons on reaching the target plate cause continuous secondary emission. This continuous release of electrons results in the building up of positive charge on the target plate.
Because of the high secondary emission ratio, the intensity of the positive charge distribution is four to five times more as compared to the charge liberated by the photo cathode.
This increase in charge density relative to the charge liberated at the photocathode is known as ‘image multiplication’ and contributes to the increased sensitivity of image orthicon. As shown in Fig., the two-sided target has the charge image on one side while an electron beam scans the opposite side.
It is for this reason that the target plate is very thin, with thickness close to 0.004 mm. Thus, whatever charge distribution builds up on one side of the target plate due to the focused image, appears on the other side, which is scanned, and it is from here that the video signal is obtained.
(ii) Scanning Section
The electron gun structure produces a beam of electrons that is accelerated towards the target. As indicated in the figure, positive accelerating potentials of 80 to 330 volts are applied to grid 2, grid 3, and grid 4 which is connected internally to the metalized conductive coating on the inside wall of the tube. The electron beam is focused at the target by magnetic field of the external focus coil and by voltage supplied to grid 4. The alignment coil provides magnetic field that can be varied to adjust the scanning beam’s position, if necessary, for correct location.
Deflection of electron beams to scan the entire target plate is accomplished by magnetic fields of vertical and horizontal deflecting coils mounted on yoke external to the tube. These coils are fed from two oscillators, one working at 15625 Hz, for horizontal deflection, and the other operating at 50 Hz, for vertical deflection. The target plate is close to zero potential and therefore electrons in the scanning beam can be made to stop their forward motion at its surface and then return towards the gun structure.
The grid 4 voltage is adjusted to produce uniform deceleration of electrons for the entire target area. As a result, electrons in the scanning beam are slowed down near the target. This eliminates any possibility of secondary emission from this side of the target plate. If a certain element area on the target plate reaches a potential of, say, 2 volts during the
storage time, then as a result of its thinness the scanning beam ‘sees’the charge deposited on it, part of which gets diffused to the scanned side and deposits an equal number of negative charges on the opposite side.
Thus out of the total electrons in the beam, some get deposited on the target plate, while the remaining stop at its surface and turn back to go towards the first electrode of the electron multiplier. Because of low resistivity across the two sides of the target, the deposited negative charge neutralizes the existing positive charge in less than a frame time.
The target can again become charged as a result of the incident picture information, to be scanned during the successive frames. As the target is scanned element by element, if there are no positive charges at certain points, all the electrons in the beam return towards the electron gun and none gets deposited on the target plate.
The number of electrons, leaving cathode of the gun, is practically constant, and out of this, some get deposited and remaining electrons, which travel backwards provide signal current that varies in amplitude in accordance with the picture information.
Obviously then, the signal current is maximum for black areas on the picture, because absence of light from black areas on the picture does not result in any emission on the photocathode, and there is no secondary emission at the corresponding points on the target, and no electrons are needed from the beam to neutralize them.
areas and minimum for bright areas on the picture. High intensity light causes large charge imbalance on the glass target plate.
The scanning beam is not able to completely neutralize it in one scan. Therefore the earlier impression persists for several scans. Image Resolution. It may be mentioned at this stage that since the beam is of low velocity type, being reduced to near zero velocit y in the region of the target it is subjected to stray electric fields in its vicinity, which can cause defocusing and thus loss of resolution.
Also on contact with the target, the electrons would normally glide along its surface tangentially for a short distance and the point of contact becomes ill defined. The beam must strike the target at right angle at all points of the target, for better resolution. These difficulties are overcome in the image-orthicon by the combined action of electrostatic field because of potential on grid 4, and magnetic field of the long focusing coil.
The interaction of two fields gives rise to cyclical motion to the beam in the vicinity of target, which then hits it at right angle no matter which point is being scanned. This very much improves the resolving capability of the picture tube.
(iii) Electron Multiplier
The returning stream of electrons arrive at the gun close to the aperture from which electron beam emerged. The aperture is a part of a metal disc covering the gun electrode. When the returning electrons strike the disc which is at a positive potential of about 300 volts, with respect to the target, they produce secondary emission.
The disc serves as first stage of the electron multiplier. Successive stages of the electron multiplier are arranged symmetrically around and back of the first stage. Therefore secondary electrons are attracted to the dynodes at progressively higher positive potentials. Five stages of multiplication are used, details of which are shown in Fig. Each multiplier stage provides a gain of approximately 4 and thus a total gain of (4) 5≈1000 is obtained at the electron multiplier. This is known as signal multiplication.
The multiplication so obtained maintains a high signal to noise ratio. The secondary electrons are finally collected by the anode, which is connected to the highest supply voltage of + 1500 volts in series with a load resistance R L . The anode current through R L has the same variations that are present in the return beam from the target and amplified by the electron multiplier.
Therefore voltage across R L is the desired video signal; the amplitude of which varies in accordance with light intensity variations of scene being televised. The output across R L is capacitive coupled to the camera signal amplifier. With R L = 20 K-ohms and typical dark and high light currents of magnitudes 30 μA and 5 μA respectively, the camera output signal will have an amplitude of 500 mV peak-to-peak.
Field Mesh Image Orthicon. The tube described above is a non-field mesh image orthicon. In some designs an additional pancake-shaped magnetic coil is provided in front of the face plate. This is connected in series with the main focusing coil.
Figure. Electron-multiplier section of the Image Orthicon.
Light Transfer Characteristics and Applications
During the evolution of image orthicon tubes, two separate types were developed, one with a very close target-mesh spacing (less than 0.001 cm) and the other with somewhat wider spacing.
The tube, with very close target mesh spacing, has very high signal to noise ratio but this is obtained at the expense of sensitivity and contrast ratio.
This is a worthwhile exchange where lighting conditions can be controlled and picture quality is of primary importance. This is generally used for live shows in the studios.
The other type with wider target-mesh spacing has high sensitivity and contrast ratio with more desirable spectral response.
This tube has wider application for outdoor or other remote pickups where a wide range of lighting conditions have to be accommodated. More recent tubes with improved photocathodes have sensitivities several times those of previous tubes and much improved spectral response.
Overall transfer characteristics of such tubes are drawn in Fig. Tube ‘A’ is intended primarily for outdoor pick-ups where as tube ‘B’ is much suited for studio use and requires strong illumination.
The tube is sometimes operated slightly above the knee, to obtain the black border effect (also known as Halo effect) around the high light areas of the target.
Figure. Light transfer characteristics of two different Image Orthicons.
1.8. VIDICON
The Vidicon came into general use in the early 50’s and gained immediate popularity because of its small size and ease of operation. It functions on the principle of photoconductivity, where the resistance of the target material shows a marked decrease when exposed to light. illustrates the structural configuration of a typical vidicon, and Fig.
Shows the circuit arrangement for developing camera signal output. As shown there, the target consists of a thin photo conductive layer of either selenium or anti-mony compounds.
This is deposited on a transparent conducting film, coated on the inner surface of the face plate. This conductive coating is known as signal electrode or plate. Image side of the photolayer, which is in contact with the signal electrode, is connected to DC supply through the load resistance RL.
The beam that emerges from the electron gun is focused on surface of the photo conductive layer by combined action of uniform magnetic field of an external coil and electrostatic field of grid No 3. Grid No. 4 provides a uniform decelerating field between itself, and the photo conductive layer, so that the electron beam approaches the layer with a low velocity to prevent any secondary emission.
Deflection of the beam, for scanning the target, is obtained by vertical and horizontal deflecting coils, placed around the tube.
Figure. Schematic representation of a Vidicon target area.
Charge Image
The photo layer has a thickness of about 0.0001 cm, and behaves like an insulator with a resistance of approximately 20 MΩ when in dark. With light focused on it, the photon energy enables more electrons to go to the conduction band and this reduces its resistivity.
each point on the gun side of the photo layer assumes a certain potential with respect to the DC supply, depending on its resistance to the signal plate.
For example, with a B + source of 40 V (see Fig), an area with high illumination may attain a potential of about + 39 V on the beam side. Similarly dark areas, on account of high resistance of the photo layer may rise to only about + 35 volts.
Thus, a pattern of positive potentials appears, on the gun side of the photo layer, producing a charge image, that corresponds to the incident optical image.
Storage Action
Though light from the scene falls continuously on the target, each element of the photo coating is scanned at intervals equal to the frame time. This results in storage action and the net change in resistance, at any point or element on the photoconductive layer, depends on the time, which elapses between two successive scanning and the intensity of incident light.
Since storage time for all points on the target plate is same, the net change in resistance of all elementary areas is proportional to light intensity variations in the scene being televised. Signal Current As the beam scans the target plate, it encounters different positive potentials on the side of the photo layer that faces the gun.
Sufficient number of electrons from the beam are then deposited on the photo layer surface to reduce the potential of each element towards the zero cathode potential. The remaining electrons, not deposited on the target, return back and are not utilized in the vidicon.
However, the sudden change in potential on each element while the beam scans, causes a current flow in the signal electrode circuit producing a varying voltage across the load resistance R L. Obviously, the amplitude of current and the consequent output voltage across R L are directly proportional to the light intensity variations on the scene.
Note that, since, a large current would cause a higher voltage drop across R L , the output voltage is most negative for white areas. The video output voltage, that thus develops across the load resistance (50 K-ohms) is adequate and does not need any image or signal multiplication as in an image orthicon.
Figure. Schematic representation of a Vidicon target area.
As seen there, one end of these target elements is connected to the signal electrode and the other end is unterminated facing the beam. In the absence of any light image, the capacitors attain a charge almost equal to the B + (40 V) voltage in due course of time. However, when an image is focused on the target the resistors in parallel with the
capacitors change in value depending on the intensity of light on each unit element.
For a high light element, the resistance across the capacitor drops to a fairly low value, and this permits lot of charge from the capacitor to leak away. At the time of scanning, more electrons are deposited, on the unterminated end of this capacitor to recharge it to the full supply voltage of + 40 V. The consequent flow of current that completes its path through R L develops a signal voltage across it.
Similarly for black areas of the picture, the resistance across the capacitors remains fairly high, and not much charge is allowed to leak from the corresponding capacitors. This in turn needs fewer number of electrons from the beam to recharge the capacitors. The resultant small current that flows, develops a lower voltage across the load resistance. The electron beam thus ‘sees’ the charge on each capacitor, while scanning the target,
and delivers more or less number of electrons to recharge them to the supply voltage. This process is repeated every 40 ms to provide the necessary video signal corresponding to the picture details at the upper end of the load resistor.
The video signal is fed through a blocking capacitor to an amplifier for necessary amplification.
Light Transfer Characteristics
Sensitivity and dark current both increase as the target voltage is increased.
Typical output for the vidicon is 0.4μA for bright light with a dark current of 0.02μA. The photoconductive layer has a time lag, which can cause smear with a trail following fast moving objects.
The photoconductive lag increases at high target voltages, where the vidicon has its highest sensitivity.
Figure. Light transfer characteristics of Vidicon
Applications
Earlier types of vidicons were used only where there was no fast movement, because of inherent lag. These applications included slides, pictures, closed circuit TV etc. The present day improved vidicon finds wide applications in education, medicine, industry, aerospace and oceanography.
It is, perhaps, the most popular tube in the television industry. Vidicon is a short tube with a length of 12 to 20 cm and diameter between 1.5 and 4 cm. Its life is estimated to be between 5000 and 20,000 hours.
1.9. PLUMBICON
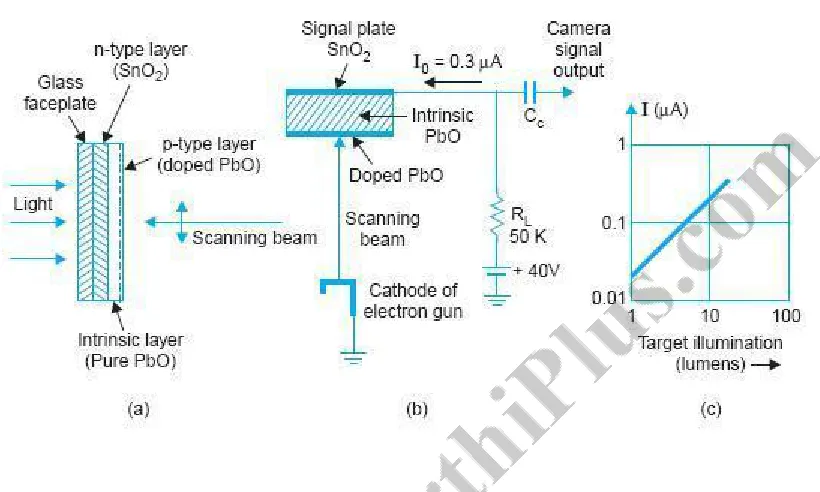
The inner surface of the faceplate is coated with a thin transparent conductive layer of tin oxide (SnO2 ). This forms a strong N type (N + ) layer and serves as the signal plate of the target. On the scanning side of this layer is deposited a photoconductive layer of pure lead monoxide (PbO) which is intrinsic or‘I’t ype. Finally the pure PbO is doped to form a P type semiconductor on which the scanning beam lands.
Figure. Plumbicon camera tube (a) target details (b) output signal current and (c) characteristics.
The photoconductive target of the plumbicon functions similar to the photoconductive target in the vidicon, except for the method of discharging each storage element.
In the standard vidicon, each element acts as a leaky capacitor, with the leakage resistance decreasing with increasing light intensity. In the plumbicon, however, each element serves as a capacitor in series with a reverse biased light controlled diode.
In the signal circuit, the conductive film of tin oxide (SnO 2 ), is connected to the target supply of 40 volts through an external load resistance R L to develop the camera output signal voltage.
Light from the scene being televised is focussed through the transparent layer of tin-oxide on the photoconductive lead monoxide. Without light the target prevents any conduction because of absence of any charge carriers and so there is little or no output current. A typical value of dark current is around 4 nA (4 × 10⁻⁹ Amp).
Light Transfer Characteristics
The current output versus target illumination response of a plumbicon is shown in Fig (c). It is a straight line with a higher slope as compared to the response curve of a vidicon. The higher value of current output, i.e., higher sensitivity, is due to much reduced recombination of photo generated electrons and holes in the intrinsic layer which contains very few discontinuities.
For target voltages higher than about 20 volts, all the generated carriers are swept quickly across the target without much re-combinations and thus the tube operates in a photo saturated mode. The spectral response of the plumbicon is closer to that of the human eye except in the red color region.
1.10. SILICON DIODE ARRAY VIDICON
This is another variation of vidicon where the target is prepared from a thine n-type silicon wafer instead of deposited layers on the glass faceplate. The final result is an array of silicon photodiodes for the target plate. Figure shows constructional details of such a target. As shown there, one side of the substrate (n-type silicon) is oxidized to form a film of silicon dioxide (SiO2) which is an insulator.
Then by photo masking and etching processes, an array of fine openings is made in the oxide layer. These openings are used as a diffusion mask for producing corresponding number of individual photodiodes.
Boron, as a dopant is vaporized through the array of holes, forming islands of p-type silicon on one side of the n-type silicon substrate. Finally a very thin layer of gold is deposited on each p-type opening to form contacts for signal output.
The other side of the substrate is given an antireflection coating. The resulting p-n photodiodes are about 8 μm in diameter. The silicon target plate thus formed is typically 0.003 cm thick, 1.5 cm square having an array of 540 × 540 photodiodes. This target plate is mounted in a vidicon type of camera tube.
Scanning and Operation
The photodiodes are reverse biased by applying +10 V or so to the n + layer on the substrate. This side is illuminated by the light focused on to it from the image. The incidence of light generates electron-hole pairs in the substrate. Under influence of the applied electric field, holes are swept over to the ‘p’ side of the depletion region thus reducing reverse bias on the diodes.
This process continues to produce storage action till the scanning beam of electron gun scans the photodiode side of the substrate. The scanning beam deposits electrons on the p-side thus returning the diodes to their original reverse bias.
The consequent sudden increase in current across each diode caused by the scanning beam represents the video signal. The current flows through a load resistance in the battery circuit and develops a video signal proportional to the intensity of light falling on the array of photodiodes.
excessive high lights. It also has low lag time and high sensitivity to visible light which can be extended to the infrared region.
A particular make of such a vidicon has the trade name of ‘Epicon’. Such camera tub es have wide applications in industrial, educational and CCTV (closed circuit television) services.
Constructional details (enlarged) of a silicon diode array target plate.
1.11. SOLID STATE IMAGE SCANNERS
The operation of solid state image scanners is based on the functioning of charge coupled devices (CCDs) which is a new concept in metal-oxide-semiconductor (MOS) circuitry. The CCD may be thought of to be a shift register formed by a string of very closel y spaced MOS capacitors. It can store and transfer analog charge signals—either electrons or holes—that may be introduced electrically or optically. The constructional details and the manner in which storing and transferring of charge occurs is illustrated in Fig.
those used in miniature integrated circuits an array of metal electrodes, known as gates, are deposited on the insulator film.
This results in the creation of a very large number of tiny MOS capacitors on the entire surface of the chip. The application of small positive potentials to the gate electrodes results in the development of depletion regions just below them.
These are called potential wells. The depth of each well (depletion region) varies with the magnitude of the applied potential. As shown in Fig. (a),
Figure. A three phase n-channel MOS charge coupled device. (a) Construction (b) transfer of electrons between potential wells (c) different phases of clocking voltage waveform.
The gate electrodes operate in groups of three, with every third electrode connected to a common conductor. The spots under them serve as light sensitive elements.
When any image is focused onto the silicon chip, electrons are generated within it, but very close to the surface. The number of electrons depends on the intensity of incident light. Once produced they collect in the nearby potential wells. As a result the pattern of collected charges represents the optical image.
Charge Transfer
The accumulation of charge carries under the first potential wells of two consecutive trios is shown in Fig. (b) Where at instant t 1 a potential φ 1 exists at the corresponding gate electrodes. In practice the charge transfer is effected by multiphase clock voltage pulses (see Fig. 6.12 (c)) which are applied to the gates in a suitable sequence.
The manner in which the transition takes place from potential wells under φ 1 to those underφ 2 is illustrated in Fig. (b). A similar transfer moves charges from φ 2 toφ 3 and then fromφ 3 to φ1 under the influence of continuing clock pulses.
Thus, after one complete clock cycle, the charge pattern moves one stage (three gates) to the right. The clocking sequence continues and the charge finally reaches the end of the array where it is collected to form the signal current.
Scanning of Television Pictures
A large number of CCD arrays are packed together to form the image plate. It does not need an electron gun, scanning beam, high voltage or vacuum envelope of a conventional camera tube.
The potential required to move the charge is only 5 to 10 volt. The spot under each trio serves as the resolution cell. When light image is focused on the chip, electrons are generated in proportion to the intensity of light falling on each cell.
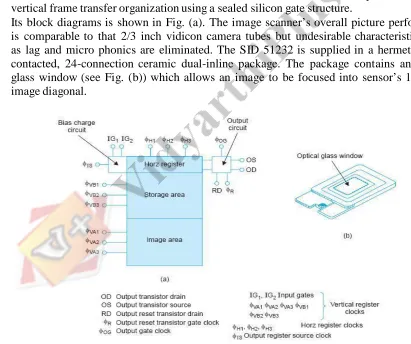
Figure. Basic organization of line addressed charge transfer area imaging devices.
The principle of one-dimensional charge transfer as explained above can be integrated in various ways to render a solid-state area image device. The straightforward approach consists of arranging a set of linear imaging structures so that each one corresponds to a scan line in the display.
shown in Fig To reduce capacitance, the output can be simply a small diffused diode in one corner of the array.
The charge packets emerging from any line are carried to this diode by an additional vertical output register. In such a line addressed structure (Fig.) where the sequence of addressing the lines is determined by the driving circuitry, interlacing can be accomplished in a natural way.
Cameras Employing Solid-State Scanners
CCDs have a bright future in the field of solid state imaging. Full TV line-scan arrays have already been constructed for TV cameras. However, the quality of such sensors is not yet suitable for normal TV studio use.
RCA SID 51232 is one such 24 lead dual-in-line image sensor. It is a self-scanned sensor intended primarily for use in generating standard interlaced 525 line television pictures. The device contains 512 × 320 elements and is constructed with a 3 phase n-channel, vertical frame transfer organization using a sealed silicon gate structure.
Its block diagrams is shown in Fig. (a). The image scanner’s overall picture performance is comparable to that 2/3 inch vidicon camera tubes but undesirable characteristics such as lag and micro phonics are eliminated. The SID 51232 is supplied in a hermetic, edge contacted, 24-connection ceramic dual-inline package. The package contains an optical glass window (see Fig. (b)) which allows an image to be focused into sensor’s12.2 mm image diagonal.
1.12. MONOCHROME PICTURE TUBE
Modern monochrome picture tubes employ electrostatic focusing and electromagnetic deflection. A typical black and white picture tube is shown in Fig. The deflection coils are mounted externally in a specially designed yoke that is fixed close to the neck of the tube.
The coils when fed simultaneously with vertical and horizontal scanning currents deflect the beam at a fast rate to produce the raster. The composite video signal that is injected either at the grid or cathode of the tube, modulates the electron beam to produce brightness variations of the tube, modulates the electron beam to produce brightness variations on the screen.
This results in reconstruction of the picture on the raster, bit by bit, as a function of time. However, the information thus obtained on the screen is perceived by the eye as a complete and continuous scene because of the rapid rate of scanning.
Figure. A rectangular picture tube.
Electron Gun
The various electrodes that constitute the electron gun are shown in Fig. The cathode is indirectly heated and consists of a cylinder of nickel that is coated at its end with thoriated tungsten or barium and strontium oxides.
These emitting materials have low work-function Base within the tube. The control grid (Grid No. 1) is maintained at a negative potential with respect to cathode and controls the flow of electrons from the cathode.
These are maintained at different positive potentials with respect to the cathode that vary between + 200 V to + 600 V.All the elements of the electron gun are connected to the base pins and receive their rated voltages from the tube socket that is wired to the various sections of the receiver.
Figure. Elements of a picture tube employing low voltage electrostatic focusing and magnetic deflection.
Electrostatic Focussing
The electric field due to the positive potential at the accelerating grid (also known as 1st anode) extends through the opening of the control grid right to the cathode surface. The orientation of this field is such that besides accelerating the electrons down the tube, it also brings all the electrons in the stream into a tiny spot called the crossover.
This is known as the first electrostatic lens action. The resultant convergence of the beam is shown in Fig. The second lens system that consists of the screen grid and focus electrode draws electrons from the crossover point and brings them to a focus at the viewing screen.
The focus anode is larger in diameter and is operated at a higher potential than the first anode. The resulting field configuration between the two anodes is such that the electrons leaving the crossover point at various angles are subjected to both convergent and divergent forces as they more along the axis of the tube.
Beam Velocity
In order to give the electron stream sufficient velocity to reach the screen material with proper energy to cause it to fluoresce, a second anode is included within the tube.
This is a conductive coating with colloidal graphite on the inside of the wide bell of the tube. This coating, called aquadag, usually extends from almost half-way into the narrow neck to within 3 cm of the fluorescent screen as shown in Fig.
It is connected through a specially provided pin at the top or side of the glass bell to a very high potential of over 15 kV. The exact voltage depends on the tube size and is about 18 kV for a 48 cm monochrome tube.
The electrons that get accelerated under the influence of the high voltage anode area, attain very high velocities before they hit the screen.
Most of these electrons go straight and are not collected by the positive coating because its circular structure provides a symmetrical accelerating field around all sides of the beam.
The kinetic energy gained by the electrons while in motion is delivered to the atoms of the phosphor coating when the beam hits the screen. This energy is actually gained by the outer valence electrons of the atoms and they move to higher energy levels.
While returning to their original levels they give out energy in the form of electromagnetic radiation, the frequency of which lies in the spectral region and is thus perceived by the eye as spots of light of varying intensity depending on the strength of the electron beam bombarding the screen.
Because of very high velocities of the electrons which hit the screen, secondary emission takes place. If these secondary emitted electrons are not collected, a negative space charge gets formed near the screen which prevents the primary beam from arriving at the screen.
The conductive coating being at a very high positive potential collects the secondary emitted electrons and thus serves the dual purpose of increasing the beam velocity and removing unwanted secondary electrons.
The path of the electron current flow is thus from cathode to screen, to the conductive coating through the secondary emitted electrons and back to the cathode through the high voltage supply.
A typical value of beam current is about 0.6 mA with 20 kV applied at the aquadag coating.
1.13. COMPOSITE VIDEO SIGNAL
Composite video signal consists of a camera signal corresponding to the desired picture information, blanking pulses to make the retrace invisible, and synchronizing pulses to synchronize the transmitter and receiver scanning.
Since sync pulses are needed consecutively and not simultaneously with the picture signal, these are sent on a time division basis and thus form a part of the composite video signal.
1.12. VIDEO SIGNAL DIMENSIONS
Figure shows the composite video signal details of three different lines each corresponding to a different brightness level of the scene. As illustrated there, the video signal is constrained to vary between certain amplitude limits.
The level of the video signal when the picture detail being transmitted corresponds to the maximum whiteness to be handled, is referred to as peak-white level. This is fixed at 10 to 12.5 percent of the maximum value of the signal while the black level corresponds to approximately 72 percent.
The sync pulses are added at 75 percent level called the blanking level. The difference between the black level and blanking level is known as the‘Pedestal’.However, in actual practice, these two levels, being very close, tend to merge with each other as shown in the figure.
Thus the picture information may vary between 10 percent to about 75 percent of the composite video signal depending on the relative brightness of the picture at any instant. The darker the picture the higher will be the voltage within those limits.
Note that the lowest 10 percent of the voltage range (whiter than white range) is not used to minimize noise effects. This also ensures enough margin for excessive bright spots to be accommodated without causing amplitude distortion at the modulator.
At the receiver the picture tube is biased to ensure that a received video voltage corresponding to about 10 percent modulation yields complete whiteness at that particular point on the screen, and an analogous arrangement is made for the black level. Besides this, the television receivers are provided with ‘brightness’ and ‘contrast’ controls to enable the viewer to make final adjustments as he thinks fit.
D.C. component of the video signal.
In addition to continuous amplitude variations for individual picture elements, the video signal has an average value or dc component corresponding to the average brightness of the scene.
In the absence of dc component the receiver cannot follow changes in brightness, as the ac camera signal, say for grey picture elements on a black background will then be the same as a signal for white area on a grey back-ground.
In Fig, dc components of the signal for three lines have been identified, each representing a different level of average brightness in the scene. It may be noted that the break shown in the illustration after each line signal is to emphasize that dc component of the video signal is the average value for complete frames rather than lines since the background information of the picture indicates the brightness of the scene.
Pedestal height.
As noted in Fig the pedestal height is the distance between the pedestal level and the average value (dc level) axis of the video signal. This indicates average brightness since it measures how much the average value differs from the black level.
Even when the signal loses its dc value when passed through a capacitor-coupled circuit the distance between the pedestal and the dc level stays the same and thus it is convenient to use the pedestal level as the reference level to indicate average brightness of the scene. Setting the pedestal level.
The output signal from the TV camera is of very small amplitude and is passed through several stages of ac coupled high gain amplifiers before being coupled to a control amplifier.
Here sync pulses and blanking pulses are added and then clipped at the correct level to form the pedestals. Since the pedestal height determines the average brightness of the scene, any smaller value than the correct one will make the scene darker while a larger Pedestal height will result in higher average brightness.
The video control operator who observes the scene at the studio sets the level for the desired brightness in the reproduced picture which he is viewing on a monitor receiver. This is known as dc insertion because this amounts to adding a dc component to the ac signal.
Once the dc insertion has been accomplished the pedestal Level becomes the black reference and the pedestal height indicates correct relative brightness for the reproduced picture. However, the dc level inserted in the control amplifier is usually Lost in succeeding stages because of capacitive coupling, but still the correct dc component can be reinserted when necessary because the pedestal height remains the same.
The blanking pulses.
The composite video signal contains blanking pulses to make the retrace lines invisible by raising the signal amplitude slightly above the black level (75 percent) during the time the scanning circuits produce retraces.
As illustrated in Fig. the composite video signal contains horizontal and vertical blanking pulses to blank the corresponding retrace intervals. The repetition rate of horizontal blanking pulses is therefore equal to the line scanning frequency of 15625 Hz.
Similarly the frequency of the vertical blanking pulses is equal to the field-scanning frequency of 50 Hz. It may be noted that though the level of the blanking pulses is distinctly above the picture signal information, these are not used as sync pulses.
The reason is that any occasional signal corresponding to any extreme black portion in the picture may rise above the blanking level and might conceivably interfere with the synchronization of the scanning generators.
Figure. Arbitrary picture signal details of three scanning lines with different average brightness levels. Note that picture to sync ratio P/S = 10/4.
Sync pulse and video signal amplitude ratio.
The overall arrangement of combining the picture signal and sync pulses may be thought of as a kind of voltage division multiplexing where about 65 per cent of the carrier amplitude is occupied by the video signal and the upper 25 per cent by the sync pulses. Thus, as shown in Fig. 3.1, the final radiated signal has a picture to sync signal ratio (P/S)
equal to 10/4.
This ratio has been found most satisfactory because if the picture signal amplitude is increased at the expense of sync pulses, then when the signal to noise ratio of the received signal falls, a point is reached when the sync pulse amplitude becomes insufficient to keep the picture locked even though the picture voltage is still of adequate amplitude to yield an acceptable picture.
A ratio of P/S = 10/4, or thereabout, results in a situation such that when the signal to noise ratio reaches a certain low level, the sync amplitude becomes insufficient, i.e., the sync fails at the same time as the picture ceases to be of entertainment value. This represents the most efficient use of the television system
Figure. Horizontal and vertical blanking pulses in video signal. Sync pulses are added above the blanking level and occupy upper 25% of the composite video signal
amplitude
1.15. HORIZONTAL SYNC DETAILS
The horizontal blanking period and sync pulse details are illustrated in Fig. The interval between horizontal scanning lines is indicated by H. As explained earlier, out of a total line period of 64s, the line blanking period is 12 s. During this interval a line synchronizing pulse is inserted. The pulses corresponding to the differentiated leading edges of the sync pulses are actually used to synchronize the horizontal scanning oscillator. This is the reason why in Figand other figures to follow, all time intervals are shown between sync pulse leading edges.
The line blanking period is divided into three sections. These are the ‘front porch’,t he ‘linesync’