www.biogeosciences.net/bg/2/43/ SRef-ID: 1726-4189/bg/2005-2-43 European Geosciences Union
Biogeosciences
Whole-system metabolism and CO
2
fluxes in a Mediterranean Bay
dominated by seagrass beds (Palma Bay, NW Mediterranean)
F. Gazeau1,2,*, C. M. Duarte3, J.-P. Gattuso2, C. Barr´on3, N. Navarro3,**, S. Ruiz3,***, Y. T. Prairie4, M. Calleja3, B. Delille1, M. Frankignoulle1, and A. V. Borges1
1Unit´e d’Oc´eanographie Chimique (B5), MARE, Universit´e de Li`ege, B-4000 Sart Tilman, Belgium
2Laboratoire d’Oc´eanographie de Villefranche, CNRS-Universit´e de Paris 6, B. P. 28, F-06234 Villefranche-sur-mer Cedex,
France
3IMEDEA (CSIC-UIB), Grupo de Oceanografia Interdisciplinar, Instituto Mediterr´aneo de Estudios Avanzados, C/Miquel
Marqu´es 21, 07190 Esporles (Islas Baleares), Spain
4D´epartement des sciences biologiques, Universit´e du Qu´ebec `a Montr´eal, Case postale 8888, succ. Centre-Ville, Montr´eal,
H3C 3P8, Canada
*present address: Netherlands Institute of Ecology (NIOO-KNAW), Postbus 140, 4400 AC Yerseke, The Netherlands **present address: ´Area de Biodiversidad y Conservaci´on, ESCET, Universidad Rey Juan Carlos, C/ Tulip´an s/n, M´ostoles
28933, Madrid, Spain
***present address: CLS Space Oceanography Division, Parc technologique du Canal, 8-10 Rue Herm`es, 31526 Ramonville
Cedex, France
Received: 1 September 2004 – Published in Biogeosciences Discussions: 26 October 2004 Revised: 31 January 2005 – Accepted: 17 February 2005 – Published: 23 February 2005
Abstract. Planktonic and benthic incubations (bare and Posidonia oceanica vegetated sediments) were performed at monthly intervals from March 2001 to October 2002 in a seagrass vegetated area of the Bay of Palma (Mallorca, Spain). Results showed a contrast between the planktonic compartment, which was on average near metabolic balance (−4.6±5.9 mmol O2 m−2 d−1) and the benthic
compart-ment, which was autotrophic (17.6±8.5 mmol O2m−2d−1).
During two cruises in March and June 2002, planktonic and benthic incubations were performed at several stations in the bay to estimate the whole-system metabolism and to examine its relationship with partial pressure of CO2(pCO2)and
ap-parent oxygen utilisation (AOU) spatial patterns. Moreover, during the second cruise, when the residence time of wa-ter was long enough, net ecosystem production (NEP) esti-mates based on incubations were compared, over the Posido-nia oceanica meadow, to rates derived from dissolved inor-ganic carbon (DIC) and oxygen (O2)mass balance budgets.
These budgets provided NEP estimates in fair agreement with those derived from direct metabolic estimates based on incubated samples over the Posidonia oceanica meadow. Whereas the seagrass community was autotrophic, the ex-cess organic carbon production therein could only balance the planktonic heterotrophy in shallow waters relative to the Correspondence to: F. Gazeau
(f.gazeau@nioo.knaw.nl)
maximum depth of the bay (55 m). This generated a hori-zontal gradient from autotrophic or balanced communities in the shallow seagrass-covered areas, to strongly heterotrophic communities in deeper areas of the bay. It seems therefore that, on an annual scale in the whole bay, the organic matter production by the Posidonia oceanica may not be sufficient to fully compensate the heterotrophy of the planktonic com-partment, which may require external organic carbon inputs, most likely from land.
1 Introduction
The role of coastal ecosystems in carbon and nutrient fluxes can be conveniently summarised by their trophic balance, re-ferring to the difference between the production of organic matter, as represented by the gross primary production (GPP) of the ecosystem and its degradation through community res-piration (CR; Odum, 1956). Autotrophic systems, where GPP>|CR| (if CR is expressed in negative units), produce organic matter in excess and thereby act as sinks of inor-ganic nutrients and CO2 from surrounding water. In
con-trast, heterotrophic ecosystems, where GPP<|CR|, rely on allochtonous inputs of organic matter and act as sources of inorganic nutrients and CO2to the surrounding water (Duarte
44 F. Gazeau et al.: Whole-system metabolism and CO2fluxes in Palma Bay
46
2.55 2.60 2.65 2.70 2.75 2.80
Longitude (°E) 39.35
39.40 39.45 39.50 39.55
Latitu
de (°N)
18
19
20
22
23 26
8
10090 80
70 60
50
40 30
2010 Palma
harbour
-10 -8 -6 -4 -2 0 2 4 6 8 10 32
34 36 38 40 42 44 46 48 50 52 54
Mallorca
E.U.
Posidonia
Bahia
4
Cap Endorrocat
[image:2.595.115.481.65.396.2]Fig. 1
Fig. 1. Map of the Bay of Palma showing the bathymetry (dotted lines), the distribution of the Posidonia oceanica meadow (green area,
adapted from Rey and Diaz del Rio, 1984), the four reference stations where incubations for metabolic processes and vertical profiles were carried out (red stars) and stations where only vertical profiles were carried out (blue circles).
The net flux of CO2across the air-water interface is
modu-lated by this metabolic balance but also by external inputs of dissolved inorganic carbon (DIC; upwelling, river inputs. . . ), calcium carbonate (CaCO3) precipitation/dissolution, and
purely thermodynamic effects related to temperature changes or mixing of water masses with different chemical character-istics.
Coastal ecosystems contain highly productive communi-ties, such as macrophyte beds which tend to be net au-totrophic (Duarte and Cebri´an, 1996; Gattuso et al., 1998; Hemminga and Duarte, 2000). As they also receive impor-tant inputs of organic matter from land, both GPP and|CR|
tend to be elevated relative to open ocean waters (Duarte and Agust´ı, 1998; Gattuso et al., 1998; Hopkinson and Smith, 2005).
Smith and Hollibaugh (1993) argued that coastal ecosys-tems are a heterotrophic compartment of the biosphere. In contrast, other authors suggested that they produce organic matter in excess relative to local demands (Duarte and Ce-bri´an, 1996; Gattuso et al., 1998; Wollast, 1998) and then act as sources of organic matter for the open ocean (Wol-last, 1998; Liu et al., 2000; Chen et al., 2003). Duarte and
Agust´ı (1998) and Hopkinson and Smith (2005) concluded, on the basis of comparative analyses of several coastal com-munities, that the metabolic balance of coastal ecosystems would be dependent on their trophic status, with productive areas being more autotrophic.
However, oligotrophic coastal systems, with untive planktonic communities, often support highly produc-tive benthic components. This implies that an assessment of their metabolism requires the integration of both benthic and planktonic compartments over relevant temporal and spatial scales. Nevertheless, an examination of coastal metabolism datasets (Duarte and Agust´ı, 1998; Gattuso et al., 1998; Hop-kinson and Smith, 2005) reveals that most coastal commu-nities were examined at small spatial scales (bottle incuba-tions or benthic chambers) rather than based on research con-ducted at the ecosystem scale. This is largely attributable to the difficulties in encompassing the variability within ecosys-tems using discrete measurements and to extrapolate these estimates to large areas.
Zone, LOICZ approach, Gordon et al., 1996). However, these methods require salinity gradients to compute water exchanges and are, therefore, best used in estuarine systems and cannot be readily used in other coastal areas.
Assessments of the spatial and/or temporal variability of dissolved oxygen (O2)concentration and the partial pressure
of CO2(pCO2)may be also used to derive integrative
esti-mates of net ecosystem production (NEP=GPP+CR). How-ever, these estimates are not straightforward, as temperature changes, the history and residence time of water masses and other physical (e.g. Borges and Frankignoulle, 2001) and/or biogeochemical (e.g. Frankignoulle et al., 1996, 2001) fac-tors may also affect O2 concentration and pCO2. For
in-stance, the computation of the CO2air-water flux can be
crit-ical in the estimation of NEP based on DIC budgets (Gazeau et al., 20051), especially in coastal environments such as es-tuaries where simple parameterisations of the gas transfer ve-locity as a function of wind speed have been shown to be site specific (Borges et al., 2004). Thus, both approaches have their own limitations and, to our knowledge, no comparison of NEP estimates derived from GPP and CR incubation mea-surements and inferred from CO2/O2fluxes at the ecosystem
scale have ever been made in the past.
In this paper, we present (1) results of benthic and plank-tonic metabolism at a fixed station over a seagrass meadow in the Bay of Palma (Mallorca, NW Mediterranean) from March 2001 to October 2002 and (2) estimates of whole sys-tem metabolism based on extensive surveys in the bay at two contrasting periods of the annual cycle in order to test the coherence between two approaches to quantify NEP (incu-bations and DIC/O2budgets).
2 Methods
2.1 Study site
The Bay of Palma (Mallorca, NW Mediterranean) is an olig-otrophic system with a surface area of 217 km2, a width of 30 km and a mean depth of 28.5 m (Fig. 1). It receives negligible freshwater inputs and, in the absence of appre-ciable astronomical tides, exchanges with the offshore wa-ters are dominated by wind stress (Ramis et al., 1990). The Bay of Palma contains extensive seagrass (Posidonia ocean-ica) meadows that extend down to 34 m depth and cover more than 30% of the bay (Fig. 1). As the water is rather clear (average±SE extinction coefficient=0.06±0.02 m−1; Navarro et al., 2004), the sediment remains within the eu-photic layer throughout the bay. The city of Palma de Mallorca (385 000 permanent inhabitants) supports intense tourism activities and a large harbour.
1Gazeau, F., Gattuso, J.-P., Middelburg, J. J., Schiettecatte, L.-S., Brion, N., Frankignoulle, M., and Borges, A. V.: Planktonic and whole-system metabolism in a nutrient-rich estuary (The Scheldt Estuary), Estuaries, submitted, 2005.
Benthic and planktonic metabolisms were estimated, us-ing in situ incubations, at a fixed station from March 2001 to November 2002 and at a grid of stations during two cruises in March (EUBAL-I) and June 2002 (EUBAL-II). During these two cruises, air-sea CO2and O2fluxes, and patterns of
resid-ual water currents were also examined.
2.2 Metabolism at a fixed station from March 2001 to Oc-tober 2002
The community metabolism in a Posidonia oceanica meadow and unvegetated sediments were studied monthly from March 2001 to October 2002 using in situ benthic incu-bation chambers at the shallow (7 m depth) Posidonia station in the Western side of the bay (Fig. 1). Benthic incubations were set up in the vegetated (4 chambers) and unvegetated (3 chambers) sediment to estimate the net community pro-duction (NCP). The benthic chambers consisted of a PVC cylinder inserted in the sediment and a gas-tight polyethy-lene plastic bag fitted to the cylinder with a sampling port (Hansen et al., 2000). Water samples were withdrawn with syringes at the start of the incubation, just before sunset and right after sunrise. Samples for O2were transferred into
Win-kler bottles, fixed and measured by the WinWin-kler technique following Carrit and Carpenter (1966), using an automated titration system (Mettler DL21 Auto-titrator) with potentio-metric end-point detection (Oudot et al., 1988). The average precision achieved in replicates was %CV=0.29. In order to express dissolved O2 changes per unit area, the volume of
water enclosed in the benthic chambers was estimated from the dilution of a phosphate solution (0.25 mol l−1) in the benthic chambers and measurements of phosphate concen-trations by spectrophotometry (Hansen and Koroleff, 1999) from samples collected after an equilibration period of 5 min. Dissolved O2 changes, adjusted to 24 h, within the benthic
chambers were used to calculate NCP. Further details and procedures are provided in Barr´on et al. (2005)2.
Details on the procedure used to estimate the planktonic NCP at the same station from June 2001 to October 2002 are provided by Navarro et al. (2004).
2.3 Whole-system metabolism using different approaches during EUBAL-1 and -2
2.3.1 Hydrography, current velocity and residence time Five CTD (Conductivity Temperature Depth) surveys were conducted in the Bay of Palma during each of the EUBAL-I (1, 3, 7, 11 and 12 March 2002) and EUBAL-EUBAL-IEUBAL-I (19, 21, 25, 26 and 27 June 2002) cruises. During the first survey of EUBAL-I, a total of 32 CTD casts were performed with an
46 F. Gazeau et al.: Whole-system metabolism and CO2fluxes in Palma Bay
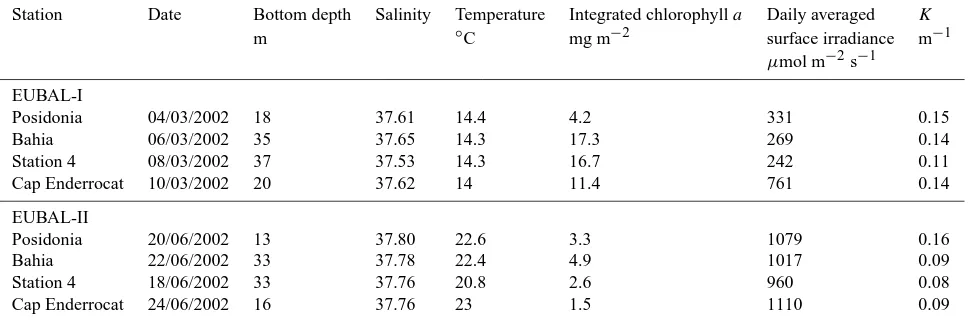
Table 1. Characteristics of the incubation stations during the EUBAL cruises in 2002. Salinity and temperature values were averaged and
chlorophyllaconcentrations were integrated throughout the water column.Kis the light attenuation coefficient.
Station Date Bottom depth Salinity Temperature Integrated chlorophylla Daily averaged K
m ◦C mg m−2 surface irradiance m−1
µmol m−2s−1
EUBAL-I
Posidonia 04/03/2002 18 37.61 14.4 4.2 331 0.15
Bahia 06/03/2002 35 37.65 14.3 17.3 269 0.14
Station 4 08/03/2002 37 37.53 14.3 16.7 242 0.11
Cap Enderrocat 10/03/2002 20 37.62 14 11.4 761 0.14
EUBAL-II
Posidonia 20/06/2002 13 37.80 22.6 3.3 1079 0.16
Bahia 22/06/2002 33 37.78 22.4 4.9 1017 0.09
Station 4 18/06/2002 33 37.76 20.8 2.6 960 0.08
Cap Enderrocat 24/06/2002 16 37.76 23 1.5 1110 0.09
average horizontal sampling resolution of 2.8×2.8 km. The other surveys consisted of 11 CTD casts each, reducing the sampling resolution to 5.2×5.2 km. Profiles were vertically averaged every 0.5 m. Direct current measurements were ob-tained on three surveys during EUBAL-I (1, 9 and 12 March 2002) and one survey during EUBAL-II (25 June 2002) with a ship-hull mounted 150 kHz RD instrument ADCP (Acous-tic Doppler Current Profiler). This latter was set up to record currents from surface (10 m) to the bottom with a vertical resolution of 4 m and a 2 min ensemble period using the Transect Acquisition Software. In order to reduce the in-strumental errors, raw ADCP data were averaged to 10 min ensembles. Absolute ADCP velocities were computed using bottom-tracking mode, which delivers accurate estimation of the ship velocity. Post-processing of ADCP data was car-ried out following the methodology described by Allen et al. (1997). Unfortunately, the ship was not equipped with a 3-D GPS (Global Positioning System) that provides accu-rate heading to account for the gyrocompass error. Hence, a typical error for a conventional gyrocompass of 2◦ (Grif-fiths, 1994) is assumed in the post-processing of ADCP data. The maximum error velocity has been estimated at about 4 cm s−1. The CTD observations were interpolated over a regular 0.5×0.5 km grid, using an objective analysis based on Optimal Statistical Interpolation. The two main parame-ters of this scheme are the characteristic scale and the cut-off length scale. The first determines the influence between ob-servations and the second gives the filtering of scales which were not resolved by the sampling strategy. For the first CTD survey of EUBAL-I (dense sampling), the character-istic scale was set-up to 5 km and the cut-off scale to 10 km. For the other CTD surveys (coarse sampling), the scale de-rived from statistics was 7.5 km and the cut-off length scale was set to 15 km. For further details about this technique refer to Pedder (1993).
In order to have a qualitative view of the general cir-culation in the Mallorca channel, a database of daily sea surface temperature (SST) was compiled, for the EUBAL-I period, from Advanced Very High Resolution Radiometer (AVHRR) obtained from Instituto Espanyol de Oceanografia (http://www.teledeteccion-oceanografica.net/).
2.3.2 Whole-system metabolism based on incubations Planktonic GPP and CR were measured at 4 stations in the bay during each of the EUBAL cruises (Fig. 1). Samples (5 replicates) were incubated in situ at 4 depths for 24 h in both transparent and dark 60 ml BOD bottles. O2concentrations
were measured before and after incubation using an auto-mated Winkler titration technique with potentiometric end-point detection. Analyses were performed with an Orion re-dox electrode (9778-SC) and a custom built titrator. Reagents and standardizations were similar to those described by Knap et al. (1996). Daily planktonic CR and NCP were estimated by regressing O2in the dark and transparent bottles against
time, respectively. Daily GPP was estimated as the difference between NCP and CR.
measured every 15 min during each cruise using a LI-COR cosine corrected quantum sensor (LI-192SA) and a LI-1400 data-logger. Strong variations were observed during the first cruise, while during the second cruise light conditions were relatively constant (Table 1). As phytoplanktonic GPP is strongly dependent on the available light intensity, a correc-tion was applied to compare results obtained under differ-ent light conditions during EUBAL-I. Relationships between daily GPP rates normalized per unit of chlorophyllaand the averaged daily irradiance were established for each station using the model of Platt et al. (1980). The resulting PI (pro-duction vs. irradiance) curves were then used to recalculate GPP for the mean daily surface irradiance over the whole campaign (421.5µmol m−2s−1).
During both EUBAL cruises, the community metabolism of Posidonia oceanica meadow and unvegetated sediment communities were studied at Posidonia (7 m) and Cap En-derrocat stations (15 m) using in situ benthic incubations as described above (Sect. 2.2). Moreover, during EUBAL-II, in-cubations of both communities were performed along a depth gradient at Posidonia station (4, 7, 15 and 22 m). The varia-tion of benthic NCP with depth at this stavaria-tion was upscaled to the entire bay using estimates of the surface area of vege-tated and unvegevege-tated sediments based on the detailed study of Rey and Diaz del Rio (1984), using a Geographic Infor-mation System (ArcView 3.2 software package).
2.3.3 CO2/O2 fluxes and Posidonia oceanica meadow
metabolism based on DIC and O2budgets
Underway parameters (seawater pCO2, O2, salinity and in
situ temperature) were sampled with a frequency of 1 min from the seawater supply of the ship (pump inlet at a depth of about 2 m) during six surveys of the EUBAL-I cruise (1, 3, 7, 9, 11 and 12 March 2002) and during five surveys of the EUBAL-II cruise (19, 21, 25, 26 and 27 June 2002). To-tal alkalinity (TA) and O2were sampled from the seawater
supply to cover the spatial variability during the surveys (on average 10 samples per survey). A non-dispersive infrared gas analyser (IRGA, LI-COR, LI-6262) was used to mea-sure pCO2in wet air equilibrated with seawater. The IRGA
was calibrated daily using three dry gas standards: pure ni-trogen (0.0 ppm; Air Liquide Belgium) and two gas mixtures with a CO2molar fraction of 360.5 and 773.8 ppm (National
Oceanic and Atmospheric Administration). The tempera-ture at the outlet of the equilibrator was monitored with a platinum resistance thermometer (PT100, Metrohm) with an estimated accuracy of±0.05◦C and pCO
2values were
cor-rected for the temperature difference between in situ seawa-ter and waseawa-ter in the equilibrator using the algorithm proposed by Copin-Mont´egut (1988, 1989). The offset in temperature was typically 0.5◦C. The accuracy of the pCO2measurement
by equilibration is estimated to±2 ppm (cumulated errors on temperature correction and instrument calibration). For fur-ther details on the equilibrator design and performance tests
refer to Frankignoulle et al. (2001). A second IRGA was used to measure atmospheric pCO2 sampled at the bow of
the ship. TA was determined using the classical Gran electro-titration method, on 100 ml GF/F filtered samples with a re-producibility of±2µmol kg−1and an estimated accuracy of
±3µmol kg−1. The measurement of pH was obtained us-ing a combined electrode (Metrohm), calibrated on the Total Hydrogen Ion Concentration Scale (mol kg SW−1), using the buffers proposed by Dickson (1993). The reproducibility of pH measurement is estimated to±0.004 pH units. DIC was calculated from pCO2and TA with the dissociation
con-stants of carbonic acid and borate from Roy et al. (1993), the dissociation constant of boric acid from Dickson (1990) and the CO2 solubility coefficient of Weiss (1974). The
accu-racy of DIC computed from the pCO2and TA is estimated
to±5µmol kg−1. DIC was normalized to a constant salinity
according to: DIC37=37
DICobserved
Salinityobserved
(1) to remove the variations due to changes in salinity owing to mixing, evaporation or dilution. pCO2was normalized to a
constant temperature using the algorithm proposed by Copin-Mont´egut (1988, 1989).
Discrete dissolved O2 concentration was measured
ac-cording to the Winkler method using a potentiometric end-point determination with an estimated accuracy of
±2µmol kg−1. Underway O2 concentration was
mea-sured with a polarographic electrode (Oxyguard) calibrated against the discrete O2 samples with an estimated
accu-racy of±3µmol kg−1. Apparent oxygen utilisation (AOU) was computed using the concentration of O2 at
satura-tion calculated with the algorithm proposed by Benson and Krause (1984). Salinity and in situ temperature were mea-sured using a SeaBird SBE21 thermosalinograph. The es-timated errors on salinity and in situ temperature measure-ments are ±0.05 and ±0.01◦C, respectively. Wind speed was measured at approximately 10 m height with a Batos (5 s sampling interval during EUBAL-I) and Aanderaa (1 min sampling interval during EUBAL-II) cup anemometer.
The air-sea CO2 flux (F; mmol C m−2 d−1)
was computed from the air-sea gradient of pCO2
(1pCO2=pCO2 water−pCO2 atmosphere; ppm), the gas
transfer velocity (k; m d−1)and the solubility coefficient of CO2(α; mmol m−3ppm−1), using equation:
F =αk1pCO2 (2)
48 F. Gazeau et al.: Whole-system metabolism and CO2fluxes in Palma Bay
0
-100 -50 50 100
0
Bare sediment (-0.3± 0.6) Posidonia oceanica (18.1± 6.7) A
NCP
(
m
m
o
l O
2
m
-2 d
-1 )
0
Mar Jul Nov Mar Jul Nov -100
-50 50 100
0
Plankton (-4.6± 5.9) Benthos (17.8± 6.5) System (13.2± 8.2)
2001 2002
B
NCP
(
m
m
o
l O
2
m
-2 d
-1 )
Fig. 2. (A) Monthly net community production (NCP) in the bare
sediment and Posidonia oceanica communities. (B) Monthly NCP in the planktonic and benthic compartment as well as the com-bined net ecosystem production (system) at the Posidonia station (cf. Fig. 1). Whole period averages and associated standard errors are presented in the legends.
Copin-Mont´egut, 2002). For each survey, theα1pCO2data
were interpolated on a grid of 0.0034◦E×0.0025◦N. To ac-count for the strong non-linearity of thekparametrizations, the flux computations were carried out using hourly bins of wind speed (assuming that the whole area is uniformly sub-mitted to wind speed measured anywhere during the survey) and then averaged for a given survey.
NEP over the Posidonia oceanica meadow was computed based on a DIC budget, according to the equation:
NEPDI C=
ρ hpos
DICbay0+tbay0
Fbay0
ρ hbay0
−DICpos+tpos
Fpos
ρ hpos
tpos
(3) where NEPDI C is expressed in mmol C m−2 d−1,ρ is the water density (kg m−3), DIC∗ is DIC37 (mmol kg−1), t∗ is the water residence time (d), hpos is the average water column height over the Posidonia oceanica meadow (m),
hbay0 is the average mixed layer depth in the Bay of Palma
[image:6.595.310.546.63.298.2](excluding the Posidonia oceanica meadow, m), F∗ is the air-sea CO2exchange computed using the Wanninkhof and
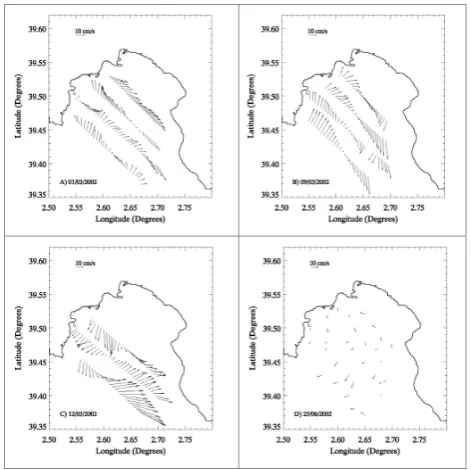
Fig. 3. Current velocity distribution during EUBAL-I at 14 m for (A) 1 March 2002, (B) 9 March 2002 and (C) 12 March 2002; and
EUBAL-II at 10 m (D) for 25 June 2002.
McGillis (1999) k parametrization, subscript pos denotes data over the Posidonia oceanica meadow and subscript bay’ denotes data over the rest of the Bay of Palma (excluding the Posidonia oceanica meadow).
An identical equation was used to computed NEP from O2
concentrations (NEPO2in mmol O2m−2d−1); the flux
air-sea of O2 was computed using the five k parametrizations
mentioned above and the Schmidt number (Sc) formulation for seawater given by Wanninkhof (1992), assuming ak de-pendency proportional to Sc−0.5.
The relative water residence time over the Posidonia oceanica meadow and in the Bay of Palma (excluding the Posidonia meadow) were computed according to:
tpos=tt ot al
Vpos
Vt ot al
(4)
tbay0 =tt ot al Vbay0
Vt ot al
(5)
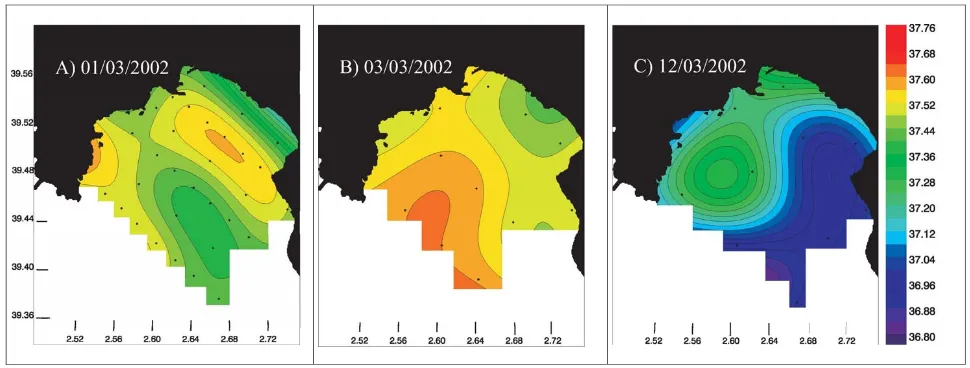
[image:6.595.51.281.63.362.2]Fig. 4. Surface water salinity distributions during EUBAL-I for (A) 1 March 2002, (B) 3 March 2002; (C) 12 March 2002.
3 Results and discussion
3.1 Metabolism at a fixed station from March 2001 to Oc-tober 2002
Benthic and planktonic metabolism were studied at monthly intervals from March 2001 to October 2002 at Posidonia sta-tion (Fig. 1). The Posidonia oceanica community tended to be autotrophic and the bare sediment community tended to be heterotrophic during the study (Fig. 2a). The seagrass community ranged from heterotrophy with a lowest NCP in August 2002 (−24.7 mmol O2m−2d−1)to autotrophy with
a highest NCP in April 2002 (88.8 mmol O2m−2d−1). Over
the study duration, a NCP of 18.1±5.2 mmol O2 m−2d−1
was estimated. The unvegetated sediment community ranged from heterotrophy (−4.8 mmol O2m−2d−1 in April 2001)
to autotrophy (5.0 mmol O2m−2d−1 in July 2001) with a
mean NCP of −0.3±0.6 mmol O2 m−2 d−1, therefore not
significantly different from 0 (p>0.05).
The benthic community metabolism showed considerable variability along the study period, with the highest NCP found in spring and early summer (Fig. 2b). In contrast, the planktonic NCP showed no clear seasonality (Navarro et al., 2004). Indeed, most monthly NCP estimates in 2001 indi-cated a heterotrophy while those in 2002 suggested an au-totrophy, related to high nutrient inputs in the bay due to fre-quent and severe storms according to Navarro et al. (2004). Overall, the NCP of the planktonic compartment averaged
−4.6±5.9 mmol O2m−2d−1, indicating metabolic balance
(i.e. Ho: mean NCP=0, P>0.05), with a tendency towards heterotrophy (Navarro et al., 2004) whereas the benthic com-partment was overall net autotrophic (17.8±6.5 mmol O2
m−2d−1). NEP (sum of benthic and planktonic NCP) was dominated by the benthic compartment in spring and sum-mer, and by the planktonic community in fall and winter. At
an annual scale, NEP was nearly balanced, with a tendency towards autotrophy (13.2±8.2 mmol O2m−2d−1).
Navarro et al. (2004) suggested that the heterotrophy of the planktonic compartment at this station is fuelled by in-puts of organic matter either derived from land or released by benthic communities. In this study, we estimated an overall positive NEP at this shallow station located over a Posidonia oceanica meadow indicating an organic matter production in excess and a possible sequestration in sediments or export to the deepest part of the bay.
3.2 Whole-system metabolism during EUBAL-1 and -2 3.2.1 Hydrography, water currents and residence time The horizontal velocity fields based on the ADCP surveys during the EUBAL-I and -II cruises differed considerably. In March, the flow pattern was initially characterised by a clear clockwise circulation with maximum velocities of 19 and 22 cm s−1, on 1 March and 9 March 2002, respectively (Fig. 3a and b). The water entered the bay on its Western side, while the water outflow is dominant on the Eastern side. The circulation changed to the opposite direction towards the end of the cruise (12 March 2002; Fig. 3c) when the flow pat-tern became anticlockwise and the flow intensified to reach a value of 40 cm s−1. This flow reversion was consistent with
50 F. Gazeau et al.: Whole-system metabolism and CO2fluxes in Palma Bay
50
0
Planktonic CR Planktonic GPP -6 -4 -2 0 2 4 6 8 0 10 20 30 40 Posidonia Station 4 Bahia Cap Enderrocat A De p th ( m ) 0
Planktonic CR Planktonic GPP -6 -4 -2 0 2 4 6 8
10 20 30 40 B De p th ( m ) 0
-6 -4 -2 0 2 4 6 0 10 20 30 40 C Planktonic NCP De p th ( m ) 0
-6 -4 -2 0 2 4 6
[image:8.595.51.286.63.245.2]10 20 30 40 D Planktonic NCP D ept h ( m ) EUBAL-I EUBAL-II
Fig. 5 Fig. 5. Depth profiles of planktonic daily gross primary
produc-tion (GPP), community respiraproduc-tion (CR) and net community pro-duction (NCP; all in mmol O2m−3d−1)measured at four stations (cf. Fig. 1) in the Bay of Palma during (A) and (C) EUBAL-I and
(B) and (D) EUBAL-II cruises.
The water residence time in the Bay of Palma was esti-mated from the current velocities recorded during each sur-vey. The average water residence time was much shorter during EUBAL-I (2.5±0.2 d) than during EUBAL-II (10 d). Due to the low velocities and the consequent noise dur-ing EUBAL-II, the computed residence time is subject to a strong uncertainty.
3.2.2 Whole-system metabolism based on incubations Integrated chlorophyll a concentrations at the incubated sta-tions were on average significantly higher in March than in June, except at Posidonia station which presented similar values during both cruises (Table 1). Minimal and max-imal concentrations were found, respectively, at Cap En-derrocat station in June (1.5 mg m−2) and at Bahia sta-tion in March (17.3 mg m−2). Light attenuation coeffi-cients (K) were rather low (<0.16 m−1during both cruises) with slightly higher values in March, except for Posido-nia station. During EUBAL-I, surface planktonic GPP rates ranged from 2.8 mmol O2m−3d−1(Posidonia) to 5.2 mmol
O2 m−3 d−1 (Cap Enderrocat) with an average value of
3.7±1.2 mmol O2 m−3 d−1 (Fig. 5a). During EUBAL-II,
surface planktonic GPP rates were slightly higher (Fig. 5b; mean: 4.7±1.2 mmol O2m−3d−1)with a minimal value at
Cap Enderrocat (3.3 mmol O2m−3d−1)and a maximal one
at station 4 (6.3 mmol O2m−3d−1). Average water-column
planktonic CR strongly increased between March (Fig. 5a) and June (Fig. 5b), from −1.4±0.2 mmol O2 m−3 d−1 to
−3.2±0.3 mmol O2 m−3d−1, respectively. Higher vertical
and horizontal gradients were found during the EUBAL-II cruise. Positive planktonic NCP rates were generally
ob-51
0 5 10 15 20
0 100 200 300
GPP = 5.8 Chl a (r2 = 0.92; P < 0.001)
GPP = 19.4 Chl a (r2 = 0.9; P < 0.001) EUBAL-I
EUBAL-II A
Chl a (mg m-2)
G PP ( m m o l O 2 m
-2 d
-1 )
0 20 40 60
-60 -40 -20 0
CR = -0.64 GPP - 15.6
r2 = 0.91; P < 0.001 B
GPP (mmol O2 m-2 d-1)
C R ( mmo l O 2 m
-2 d
-1 )
Fig. 6
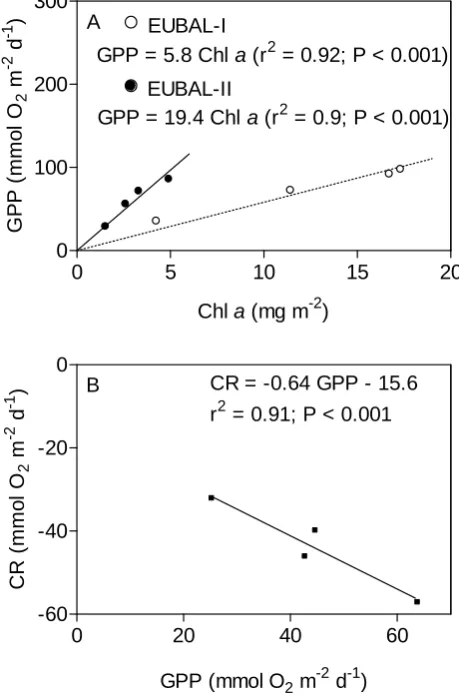
Fig. 6. (A) Linear relationships between integrated gross primary
production (GPP) and integrated chlorophyllaconcentrations (Chl
a) at four stations (cf. Fig. 1) during EUBAL-I and -II cruises.
(B) Linear relationship between GPP and community respiration
(CR) integrated in the water column above the Posidonia oceanica meadow at four stations during the EUBAL-II cruise.
served in March with a maximal value in surface waters at Cap Enderrocat (5.1 mmol O2m−3d−1)while much more
variable rates were measured in June with strongly het-erotrophic conditions at depth in stations Cap Enderrocat and 4.
During EUBAL-I, maximal integrated planktonic GPP values were observed at stations Bahia and 4 (98 and 92 mmol O2m−2d−1)and the minimal one at Posidonia
sta-tion (36 mmol O2m−2d−1, Table 2). During EUBAL-II,
in-tegrated planktonic GPP ranged from 29 mmol O2m−2d−1
at Cap Enderrocat to 86 mmol O2m−2d−1 at Bahia.
Inte-grated planktonic CR showed a low spatial variability during the first cruise with a mean value of−35±4 mmol O2m−2
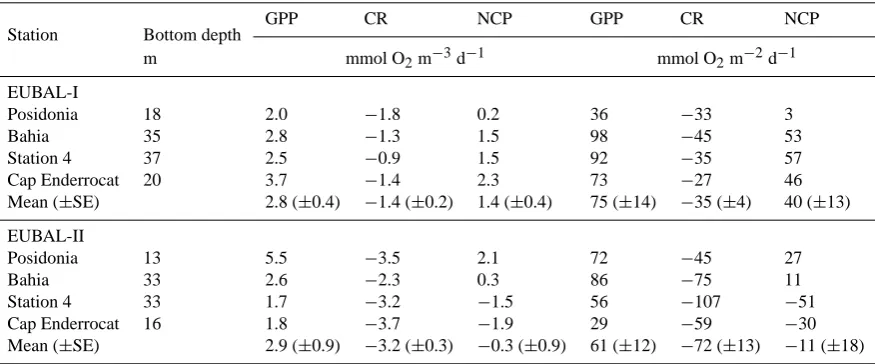
[image:8.595.312.542.69.417.2]Table 2. Water column averages and integrated planktonic gross primary production (GPP), community respiration (CR) and net community
production (NCP) at four stations during the EUBAL-I and -II cruises. Averaged values (±SE) are also presented.
Station Bottom depth GPP CR NCP GPP CR NCP
m mmol O2m−3d−1 mmol O2m−2d−1
EUBAL-I
Posidonia 18 2.0 −1.8 0.2 36 −33 3
Bahia 35 2.8 −1.3 1.5 98 −45 53
Station 4 37 2.5 −0.9 1.5 92 −35 57
Cap Enderrocat 20 3.7 −1.4 2.3 73 −27 46
Mean (±SE) 2.8 (±0.4) −1.4 (±0.2) 1.4 (±0.4) 75 (±14) −35 (±4) 40 (±13)
EUBAL-II
Posidonia 13 5.5 −3.5 2.1 72 −45 27
Bahia 33 2.6 −2.3 0.3 86 −75 11
Station 4 33 1.7 −3.2 −1.5 56 −107 −51
Cap Enderrocat 16 1.8 −3.7 −1.9 29 −59 −30
Mean (±SE) 2.9 (±0.9) −3.2 (±0.3) −0.3 (±0.9) 61 (±12) −72 (±13) −11 (±18)
one at station 4 (−107 mmol O2m−2d−1). The planktonic
compartment was autotrophic at all incubated stations dur-ing EUBAL-I while durdur-ing EUBAL-II, two stations (Station 4 and Cap Enderrocat) presented a heterotrophic status.
Significant relationships were found between integrated planktonic GPP and integrated chlorophylla concentration during both cruises (Fig. 6a). As chlorophyll a concen-trations based on calibrated fluorescence profiles were esti-mated at 11 stations on two surveys during each cruise, these relationships were used to extrapolate GPP, integrated across the euphotic layer (34 m during EUBAL-I and 46 m during EUBAL-II) to the whole bay (Table 3). During both surveys in March, the lowest chlorophyllavalues and consequently the lowest planktonic GPP were found at Posidonia and Cap Enderrocat stations while maximal rates were found in deep waters in the middle of the bay. During the second cruise, due to lower chlorophyllaconcentrations, planktonic GPP were much lower and higher spatial variations were observed in comparison to March, reaching a mean value of 33±9 mmol O2m−2d−1(vs. 93±9 mmol O2m−2d−1during EUBAL-I)
with highest values generally estimated over the Posidonia oceanica meadow.
During the first cruise, for all stations investigated dur-ing the surveys (except incubation stations), planktonic in-tegrated CR rates were calculated by multiplying the mean volumetric rate observed during the incubations (at the 4 ref-erence stations;−1.4±0.2 mmol O2m−3d−1)by the depth
of each station. Planktonic integrated CR was, therefore, highest at deep stations reaching a maximal value at station 8 (60 m depth;−84 mmol O2m−2d1), but was always lower
than planktonic GPP. Consequently, the planktonic compart-ment was autotrophic during EUBAL-I with an average value of 48±9 mmol O2m−2d−1.
Due to the strong heterogeneity in CR observed during EUBAL-II at the four incubated stations, the same procedure
was not applied. During this cruise, a significant relation-ship was observed between GPP and CR integrated across the water column, excluding the last incubated depth (Fig. 6b). CR rates measured near the bottom and therefore near the Posidonia oceanica meadow do not fit with this relationship. This suggests that near the bottom, planktonic CR may be fu-elled by organic matter from the Posidonia oceanica meadow rather than by the planktonic production. Therefore, CR rates collected at the four incubated stations were upscaled only to the area covered by the Posidonia oceanica meadow, while integrated CR was calculated based on the estimated GPP in the rest of the bay where chlorophyllaand consequent GPP rates are much lower.
On average, integrated and extrapolated planktonic CR was similar in March and June (−43±5 and−47±7 mmol O2 m−2 d−1, respectively) but due to much lower GPP
rates during EUBAL-II, the planktonic compartment was heterotrophic (−15±7 mmol O2m−2d−1).
Seagrass communities were autotrophic at all depths dur-ing both cruises, with the highest NCP found at the shallow-est station (Table 4). In contrast, bare sediment communi-ties remained net heterotrophic during both cruises, except for the shallowest community investigated during EUBAL-II (4 m). The upscaled results suggest that the NCP of the Posi-donia oceanica meadow was marginally autotrophic during EUBAL-I (6.5±9.9 mmol O2m−2d−1)and significantly
au-totrophic, with an average NCP of 26.3±8.0 mmol O2m−2
d−1, during EUBAL-II.
Combining these estimates with concurrent estimates of planktonic NCP over the Posidonia oceanica meadow (Sta-tions Posidonia, Bahia, Cap Enderrocat, 4, 18 and 19), a NEP of 63±24 and 10±22 mmol O2m−2 d−1 was estimated in
this area for EUBAL-I and -II, respectively.
52 F. Gazeau et al.: Whole-system metabolism and CO2fluxes in Palma Bay
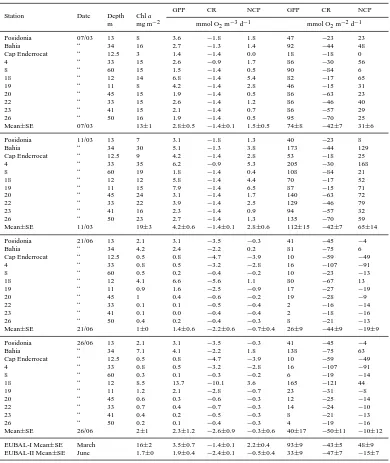
Table 3. Integrated chlorophylla(Chla) concentrations, planktonic gross primary production (GPP), community respiration (CR) and net community production (NCP) estimated on two surveys during each of the EUBAL cruises in 2002.
Station Date Depth Chla
GPP CR NCP GPP CR NCP
m mg m−2 mmol O2m−3d−1 mmol O2m−2d−1
Posidonia 07/03 13 8 3.6 −1.8 1.8 47 −23 23
Bahia “ 34 16 2.7 −1.3 1.4 92 −44 48
Cap Enderrocat “ 12.5 3 1.4 −1.4 0.0 18 −18 0
4 “ 33 15 2.6 −0.9 1.7 86 −30 56
8 “ 60 15 1.5 −1.4 0.5 90 −84 6
18 “ 12 14 6.8 −1.4 5.4 82 −17 65
19 “ 11 8 4.2 −1.4 2.8 46 −15 31
20 “ 45 15 1.9 −1.4 0.5 86 −63 23
22 “ 33 15 2.6 −1.4 1.2 86 −46 40
23 “ 41 15 2.1 −1.4 0.7 86 −57 29
26 “ 50 16 1.9 −1.4 0.5 95 −70 25
Mean±SE 07/03 13±1 2.8±0.5 −1.4±0.1 1.5±0.5 74±8 −42±7 31±6
Posidonia 11/03 13 7 3.1 −1.8 1.3 40 −23 8
Bahia “ 34 30 5.1 −1.3 3.8 173 −44 129
Cap Enderrocat “ 12.5 9 4.2 −1.4 2.8 53 −18 25
4 “ 33 35 6.2 −0.9 5.3 205 −30 168
8 “ 60 19 1.8 −1.4 0.4 108 −84 21
18 “ 12 12 5.8 −1.4 4.4 70 −17 52
19 “ 11 15 7.9 −1.4 6.5 87 −15 71
20 “ 45 24 3.1 −1.4 1.7 140 −63 72
22 “ 33 22 3.9 −1.4 2.5 129 −46 79
23 “ 41 16 2.3 −1.4 0.9 94 −57 32
26 “ 50 23 2.7 −1.4 1.3 135 −70 59
Mean±SE 11/03 19±3 4.2±0.6 −1.4±0.1 2.8±0.6 112±15 −42±7 65±14
Posidonia 21/06 13 2.1 3.1 −3.5 −0.3 41 −45 −4
Bahia “ 34 4.2 2.4 −2.2 0.2 81 −75 6
Cap Enderrocat “ 12.5 0.5 0.8 −4.7 −3.9 10 −59 −49
4 “ 33 0.8 0.5 −3.2 −2.8 16 −107 −91
8 “ 60 0.5 0.2 −0.4 −0.2 10 −23 −13
18 “ 12 4.1 6.6 −5.6 1.1 80 −67 13
19 “ 11 0.9 1.6 −2.5 −0.9 17 −27 −19
20 “ 45 1 0.4 −0.6 −0.2 19 −28 −9
22 “ 33 0.1 0.1 −0.5 −0.4 2 −16 −14
23 “ 41 0.1 0.0 −0.4 −0.4 2 −18 −16
26 “ 50 0.4 0.2 −0.4 −0.3 8 −21 −13
Mean±SE 21/06 1±0 1.4±0.6 −2.2±0.6 −0.7±0.4 26±9 −44±9 −19±9
Posidonia 26/06 13 2.1 3.1 −3.5 −0.3 41 −45 −4
Bahia “ 34 7.1 4.1 −2.2 1.8 138 −75 63
Cap Enderrocat “ 12.5 0.5 0.8 −4.7 −3.9 10 −59 −49
4 “ 33 0.8 0.5 −3.2 −2.8 16 −107 −91
8 “ 60 0.3 0.1 −0.3 −0.2 6 −19 −14
18 “ 12 8.5 13.7 −10.1 3.6 165 −121 44
19 “ 11 1.2 2.1 −2.8 −0.7 23 −31 −8
20 “ 45 0.6 0.3 −0.6 −0.3 12 −25 −14
22 “ 33 0.7 0.4 −0.7 −0.3 14 −24 −10
23 “ 41 0.4 0.2 −0.5 −0.3 8 −21 −13
26 “ 50 0.2 0.1 −0.4 −0.3 4 −19 −16
Mean±SE 26/06 2±1 2.3±1.2 −2.6±0.9 −0.3±0.6 40±17 −50±11 −10±12
EUBAL-I Mean±SE March 16±2 3.5±0.7 −1.4±0.1 2.2±0.4 93±9 −43±5 48±9 EUBAL-II Mean±SE June 1.7±0 1.9±0.4 −2.4±0.1 −0.5±0.4 33±9 −47±7 −15±7
surface area, benthic NCP was estimated at 1.6±3.0 and 8.6±3.2 mmol O2 m−2 d−1 for EUBAL-I and -II,
respec-tively (Table 4). Therefore, a whole-system NEP of 50±12 and−6±10 mmol O2m−2d−1was estimated in March and
June, respectively, indicating that the Bay of Palma acted as a significant autrotrophic ecosystem due to a high planktonic production in March and did not depart from metabolic bal-ance in June despite a significantly autotrophic benthic com-partment.
Interpolated maps of NEP in the bay of Palma during the 4 surveys conducted in March (Fig. 7) and June (Fig. 8) show
that maxima of net production were located in the northern and in the western areas in March and June, respectively. 3.2.3 Spatial and temporal variations of pCO2, TA, AOU
and air-sea CO2fluxes
The comparison of pCO2among cruises required the
normal-ization to a constant temperature, which in the present case should be 19◦C (pCO2(19◦C)). This is because temperature
Table 4. Mean (±SE) benthic net community production (NCP) in March (EUBAL-I) and June 2002 (EUBAL-II).
Cruise Community Depth NCP±SE
(m) (mmol O2 m−2d−1)
EUBAL-I P. oceanica 7 29.7±10.8
15 17.1±3.3 Bare sediment 7 −0.3±0.2
15 −0.4±0.1
P. oceanica meadow extrapolated 6.5±9.9
Bare sediment extrapolated −0.4±0.2
Whole bay extrapolated 1.6±3.0
EUBAL-II P. oceanica 4 44.2±13.6 7 12.0±11.0 15 24.6±3.9 22 19.1±11.1 Bare sediment 4 5.7±0.5
7 −4.0±0.4 15 −3.7±0.3 22 −6.4±0.4
P. oceanica meadow extrapolated 26.3±8.0
Bare sediment extrapolated 1.0±3.1
Whole bay extrapolated 8.6±3.2
Indeed, a temperature increases of 1◦C causes a pCO 2 rise
of about 4%. Normalization of in situ pCO2(pCO2(in situ)) values to a constant temperature allows then to focus on potential biological controls of pCO2. No correlation was
found between AOU and pCO2(in situ)(Fig. 9a) during the two EUBAL cruises taken together, while AOU and pCO2(19◦C)
(Fig. 9b) were strongly correlated which suggests that both variables were controlled by biological effects during these two cruises. The pCO2(19◦C)and AOU values were on
aver-age lower during EUBAL-II than during EUBAL-I that could suggest a stronger NEP during the second cruise, which is clearly inconsistent with values derived from incubations (Sect. 3.2.2). This discrepancy can be explained by the in-put of water masses with different signatures during the two cruises and a much shorter water residence time in March (Sect. 3.2.1) which precludes a significant impact of the metabolism of the bay on pCO2(19◦C) and AOU during this
cruise. This highlights that, to infer on the metabolic status of a system, normalized pCO2 (or DIC) and AOU signals
must be interpreted with ancillary information on the chemi-cal characteristics of the water mass entering the system and the water residence time and volume of the system. Only with such ancillary information, NEP can be computed from pCO2(or DIC) and AOU signals, as developed in Sect. 3.2.4
for the Posidonia oceanica meadow during EUBAL-II. The observed pCO2(19◦C) and AOU values were much
lower than those at the Dyfamed station (located in the open
07 March
39.40 39.45 39.50 39.55
Lat
it
ude (°
N)
290 310 330 350 370 390 410 430 450 470
11 March
pCO (ppm)2 (in situ)
39.40 39.45 39.50 39.55
L
a
ti
tu
de (°N
)
310 330 350 370 390 410
pCO (ppm)2 (19°C)
39.40 39.45 39.50 39.55
L
a
ti
tud
e
(°
N)
-45 -40 -35 -30 -25 -20 -15 -10 -5 0 5
AOU (µmol kg )-1
2.55 2.60 2.65 2.70 2.75 2.80
Longitude (°E) 39.40
39.45 39.50 39.55
La
ti
tu
de (°
N)
-65 -25 15 55 95 135 175
2.55 2.60 2.65 2.70 2.75 2.80
Longitude (°E)
NEP (mmol O m d )-2 -1
[image:11.595.53.278.98.362.2]2
Fig. 7. Interpolated maps of pCO2(in situ), pCO2normalized to a constant temperature (pCO2(19◦C))and Apparent Oxygen
Utilisa-tion (AOU) as well as net ecosystem producUtilisa-tion (NEP) in the Bay of Palma during two surveys of EUBAL-II.
waters of the Ligurian Sea, about 620 km North from the Bay of Palma) for the corresponding periods. This suggests that in the Western Mediterranean Sea, the continental shelf is more productive than the open oceanic waters.
54 F. Gazeau et al.: Whole-system metabolism and CO2fluxes in Palma Bay
Table 5. Mean±SD of AOU, pCO2, pCO2normalized to a constant temperature (pCO2(19◦C)), DIC37(computed from continuous
mea-surements of pCO2and salinity, and TA-salinity linear regression function in legend of Fig. 9), wind speed (u), the air-sea gradient of pCO2 (1pCO2), in the surface waters, and atmospheric CO2 flux computed using the gas transfer velocity given by Wanninkhof and McGillis (1999) (F ), over the Posidonia meadow and in the rest of the bay, on the surveys carried out during the EUBAL-I and -II cruises. Data were interpolated using the Kriging procedure on a grid of 0.0034◦E×0.0025◦N and averaged.
AOU pCO2 pCO2(19◦C) DIC37 1pCO2 u F
µmol kg−1 ppm ppm µmol kg−1 ppm m s−1 mmol C m−2d−1
Bay (excluding Posidonia meadow)
01/03/2002 −4.6±2.3 324±3 386±4 2142±2 −46±16 3.9±1.6 −1.0±0.9 04/03/2002 −10.5±1.8 320±2 384±3 2140±2 −64±1 6.9±1.8 −5.8±4.5 07/03/2002 −2.4±0.6 320±1 388±2 2144±1 −54±2 4.5±2.2 −1.9±2.3 09/03/2002 −0.8±0.9 320±1 386±3 2143±1 −57±3 2.9±0.9 −0.4±0.3 11/03/2002 −3.2±0.5 320±1 381±2 2140±1 −55±4 3.3±0.9 −0.5±0.4 12/03/2002 −4.2±0.9 321±2 380±2 2140±1 −53±7 3.3±1.0 −0.5±0.5 19/06/2002 −15.8±3.5 420±7 363±7 2121±4 50±12 4.7±2.1 1.7±1.4 21/06/2002 −13.3±3.3 426±10 361±7 2120±4 52±18 4.1±2.2 1.6±2.0 25/06/2002 −10.0±2.4 442±10 361±5 2118±3 82±10 6.3±1.4 5.9±3.4 26/06/2002 −10.5±4.0 444±11 358±8 2116±5 77±20 3.6±1.2 1.1±1.1 27/06/2002 −10.8±1.1 443±3 360±1 2119±1 83±3 5.4±1.4 3.6±2.5
Posidonia meadow
01/03/2002 −6.1±2.4 323±2 384±3 2141±2 −56±17 3.9±1.6 −1.0±0.9 04/03/2002 −14.8±2.7 316±3 379±4 2138±2 −63±1 6.9±1.8 −5.7±4.5 07/03/2002 −2.0±1.6 323±5 395±6 2147±3 −54±4 4.5±2.2 −1.9±2.4 09/03/2002 0.0±0.6 323±8 394±10 2147±5 −58±9 2.9±0.9 −0.4±0.4 11/03/2002 −2.6±0.6 320±1 383±2 2141±1 −64±8 3.3±0.9 −0.6±0.5 12/03/2002 −4.2±1.1 321±3 379±2 2140±1 −59±12 3.3±1.0 −0.6±0.5 19/06/2002 −24.0±5.8 405±17 346±15 2110±10 40±21 4.7±2.1 1.4±1.1 21/06/2002 −18.0±4.7 420±18 351±13 2114±9 45±31 4.1±2.2 1.3±1.7 25/06/2002 −14.1±3.9 433±14 351±10 2111±7 74±15 6.3±1.4 5.3±3.1 26/06/2002 −12.6±5.8 445±18 354±12 2114±8 79±31 3.6±1.2 1.1±1.1 27/06/2002 −12.7±2.2 449±7 358±5 2117±3 87±11 5.4±1.4 3.7±2.6
precipitation/dissolution rates were too low and/or water res-idence time too short and/or the water volume too large to significantly affect surface water TA values. The linear re-gression function based on data from both EUBAL cruises was very similar to that reported by Copin-Mont´egut (1993) for the Alboran Sea.
Strong spatial gradients of pCO2(in situ), pCO2(19◦C) and
AOU were observed during both EUBAL cruises (Figs. 7 and 8). During the six EUBAL-I surveys, pCO2(in situ), pCO2(19◦C) and AOU surface distributions exhibited
vari-able patterns with no recurrent spatial features. Moreover, no clear relation was found between the spatial patterns of these variables and those of NEP derived from incubations (Fig. 7). This suggests either highly variable NEP in space and time and/or the advection of water masses with differ-ent pCO2(in situ), pCO2(19◦C)and AOU signatures. The latter
explanation is consistent with changes in the water mass in-ferred from salinity and temperature and shifts of the residual current patterns observed between the start and the end of the
cruise (Sect. 3.2.1). In contrast, during the EUBAL-II sur-veys, pCO2(in situ), pCO2(19◦C) and AOU minima were
sys-tematically observed near-shore, above the Posidonia ocean-ica meadow (Fig. 8 and Table 5). Also, during the EUBAL-II surveys, lower near-shore values of pCO2(in situ), pCO2(19◦C)
and AOU were systematically observed on the Western side of the bay in comparison to the Eastern side (Fig. 8). This is consistent with the anti-clockwise pattern of residual cur-rents (Fig. 3), leading to an impoverishment in CO2and an
enrichment in O2 as the water mass is advected above the
Posidonia oceanica meadow. Also, a higher NEP was ob-served on the Western side of the bay during two EUBAL-II surveys (Table 3 and Fig. 8).
The variability of the flux computations related to the choice of the k parametrization is huge as shown in other studies (e.g. Borges and Frankignoulle, 2002). The fluxes computed using the Wanninkhof and McGillis (1999) k
F. Gazeau et al.: Whole-system metabolism and CO2fluxes in Palma Bay 55
21 June
39.40 39.45 39.50 39.55
Lati
tu
de (
°N)
290 310 330 350 370 390 410 430 450 470
pCO (ppm)2 (in situ)
26 June
39.40 39.45 39.50 39.55
L
a
ti
tude (°
N)
310 330 350 370 390 410
pCO (ppm)2 (19°C)
39.40 39.45 39.50 39.55
La
titude (°N)
-45 -40 -35 -30 -25 -20 -15 -10 -5 0 5
AOU (µmol kg )-1
2.55 2.60 2.65 2.70 2.75 2.80
Longitude (°E) 39.40
39.45 39.50 39.55
Lati
tud
e
(°N)
-65 -25 15 55 95 135 175
NEP (mmol O m d )-2 -1
2.55 2.60 2.65 2.70 2.75 2.80
Longitude (°E)
[image:13.595.354.502.59.507.2]2
Fig. 8. Interpolated maps of pCO2(in situ), pCO2normalized to a constant temperature (pCO2(19◦C))and Apparent Oxygen
Utilisa-tion (AOU) as well as net ecosystem producUtilisa-tion (NEP) in the Bay of Palma during two surveys of EUBAL-I.
corresponded to 57, 66 and 63% of those computed us-ing, respectively, the k parametrization given by Wan-ninkhof (1992), Nightingale et al. (2000) and McGillis et al. (2001). The Bay of Palma was a sink for atmospheric CO2
during EUBAL-I (on average−1.7 mmol C m−2d−1)and a source during EUBAL-II (on average 2.7 mmol C m−2d−1,
250 300 350 400 450
-50 -40 -30 -20 -10 0 10 20 30
B
EUBAL-I EUBAL-II
June
June March
March
pCO2(19°C) (ppm)
AO
U (
µ
m
o
l k
g
-1)
36.5 37.0 37.5 38.0 38.5
2400 2450 2500 2550
EUBAL-I EUBAL-II present study
Copin-Montégut (1993) C
salinity
TA
(
µ
m
o
l k
g
-1)
250 300 350 400 450 500
-50 -40 -30 -20 -10 0 10 20 30
EUBAL-I EUBAL-II
June
June
pCO2(in situ) (ppm)
AO
U (
µ
m
o
l k
g
-1) March
March
A
Fig. 9
Fig. 9. (A) Apparent oxygen utilisation (AOU) versus pCO2(in situ)
and (B) AOU versus pCO2 normalized to a constant tempera-ture (pCO2(19◦C)) in surface waters from all the surveys
dur-ing EUBAL-I and II cruises. The range of variation of AOU and pCO2(19◦C)at the Dyfamed station for the March 1998–1999
[image:13.595.51.284.70.560.2]56 F. Gazeau et al.: Whole-system metabolism and CO2fluxes in Palma Bay
55
-1 0 1 2
NEPDIC = 11 + 69 I0
(r2 = 0.907)
NE
PDI
C
(
mmo
lC
m
-2 h
-1 )
A
800 900 1000 1100 1200 1300 -1
0 1 2
NEPO2 = 11 + 68 I0
(r2 = 0.698)
Surface irradiance (µmol m-2s-1)
NE
PO2
(
mmo
lO
2
m
-2 h
-1 )
B
Fig. 10
Fig. 10. NEPDI C (A) and NEPO2(B) over the Posidonia oceanica meadow versus surface irradiance (I0)during the EUBAL-II cruise. NEPDI C and NEPO2data were adjusted linearly to 12:00 Univer-sal Time (UT; all surveys ended in mid-afternoon, ranging from 14:30 to 16:45 UT). Surface irradiance was averaged from dawn to 12:00 UT.
Table 5). At the Dyfamed station, the CO2 fluxes ranged
between−2.9 and−8.7 mmol C m−2 d−1in March 1998–
1999 and between 2.8 and 3.3 mmol C m−2 d−1 in June 1998–1999 (B´egovic and Copin-Mont´egut, 2002). The stronger fluxes at Dyfamed are related to higher wind speeds since1pCO2values are more marked in the Bay of Palma:
[image:14.595.49.281.66.513.2]−56 ppm during EUBAL-I (−39 ppm at Dyfamed in March 1998–1999) and 68 ppm during EUBAL-II (20 ppm at Dy-famed in June 1998–1999).
Table 6. Net ecosystem production (NEP), over the Posidonia
oceanica meadow during the EUBAL-II cruise. DIC37and O2data
were interpolated as explained in legend of Table 5. The uncertainty on NEP was computed assuming an error onttotalof±1 d.
NEPDI C NEPO2
mmol C m−2d−1 mmol O2m−2d−1
19/06/2002 41±3 31±3
21/06/2002 25±2 10±1
25/06/2002 27±2 9±1
26/06/2002 9±1 2±1
27/06/2002 7±1 −5±1
Mean EUBAL-II 22±12 10±7
The temperature effect on the solubility coefficient of CO2 strongly contributes to the seasonal variability of
air-sea CO2 flux in the Bay of Palma, as also shown in open
oceanic waters (Dyfamed; B´egovic and Copin-Mont´egut, 2002) and other coastal waters (Bay of Calvi – Corsica; Frankignoulle, 1988) of the Western Mediterranean Sea. In-deed, pCO2and1pCO2values were higher during
EUBAL-II than EUBAL-I, although, pCO2(19◦C) and DIC37 were
lower during EUBAL-II (Table 5). Thus, the fact that the Bay of Palma is a source of CO2in June seems to be largely
related to a temperature effect, since pCO2(19◦C) and AOU
data were lower than in March (Figs. 7, 8, 9a and Table 5). Our results also suggest that the potential impact of Posi-donia oceanica meadows on the CO2air-sea flux budget in
the Western Mediterranean continental shelf during summer could be small. The average CO2flux observed over the
Posi-donia meadow during EUBAL-II (2.54 mmol C m−2 d−1; Table 5) was only 10% lower than that for unvegetated areas during the same cruise (2.76 mmol C m−2 d−1). As Posi-donia oceanica meadows are believed to cover about 25% of the shelf area (Bethoux and Copin-Mont´egut, 1986), they can only decrease the summertime CO2emission from the
Mediterranean continental shelf by a modest 2.5%.
3.2.4 DIC- and O2-derived NEP estimates over the
Posido-nia oceanica meadow during EUBAL-II
As mentioned above, pCO2(in situ), pCO2(19◦C)and AOU
sur-face distributions exhibited variable patterns with no recur-rent spatial features during EUBAL-I. Moreover, the resi-dence time of water was too low during this cruise to clearly identify an impact of the Posidonia oceanica meadow on these variables. Therefore, the DIC and O2 mass balance
budgets were not applied during this cruise.
NEP estimates over the Posidonia oceanica meadow dur-ing EUBAL-II based on surface water DIC37 and O2were
[image:14.595.308.543.120.229.2]The day-to-day variability of NEP seems to be mainly re-lated to light availability, as there was a strong relationship between the NEP and surface irradiance (Fig. 10), which explained about 91 and 70% of the variance of, respec-tively, NEPDI C and NEPO2. Based on these linear
regres-sions and continuous surface irradiance measurements, NEP over the Posidonia oceanica meadow was integrated for the full duration of the EUBAL-II cruise (19–27 June): at 22±12 mmol C m−2d−1and 10±7 mmol O2m−2d−1 for,
respectively, NEPDI C and NEPO2.
The difference between NEPDI C and NEPO2could be
re-lated to net CaCO3 production (net DIC consumption) that
was not included in the DIC budget, since TA was assumed conservative for the purpose of the computations (Fig. 9c). Net CaCO3production was measured using in situ benthic
chambers on 20 June 2002 at station Posidonia, yielding a value of 15 mmol C m−2 d−1 for the Posidonia oceanica
vegetated community and 1 mmol C m−2d−1for bare
sedi-ments of the Bay of Palma (Barr´on et al., 20052). Based on the relative sea-floor coverage by these benthic communities, the integrated net CaCO3production between the shore and
30 m depth is 10 mmol C m−2d−1and corresponds to the difference between NEPDI C and NEPO2.
The photosynthetic quotient (PQ) corresponds to the mo-lar ratio of the release of O2 to the consumption of DIC
during photosynthesis while the respiratory quotient (RQ) corresponds to the molar ratio of the release of DIC to the consumption of O2during organic matter mineralization. As
mentioned by Thamdrup and Canfield (2000), an important uncertainty in using O2uptake as a measure of mineralization
in sediments lies in the assumption that anaerobic respiration and reoxidation of reduced inorganic species are at steady state. Holmer et al. (2003) reported that reduced sulfides are low both in the pore waters and in the particulate pools of seagrass sediments around Mallorca Island, suggesting that the previous assumption is realistic in these iron-poor and carbonate rich sediments. Therefore, in the present study, a RQ of 1 was assumed and the NEPO2 vs. NEPDI C ratio was used to compute a PQ value. As the difference between NEPDI C and NEPO2is likely due to net CaCO3production,
a PQ of∼1 is estimated. This would suggest that NEP over the Posidonia oceanica meadow is mainly related to the pho-tosynthetic activity of the seagrass community. Indeed, one can compute a PQ of 1.08, based on the C:N:P elemental mo-lar ratio of 956:39:1 reported by Atkinson and Smith (1983) for Posidonia oceanica leaves. The C:N:P elemental molar ratio of roots is 3550:61:1 (Atkinson and Smith, 1983) but the below-ground production of Posidonia oceanica is much lower than the above-ground production (about 10%; Duarte and Chiscano, 1999) and does not significantly affect the PQ estimate (PQ=1.03 for below-ground production, overall PQ≈1.08). Based on the C:N:P molar elemental composition of phytoplankton reported by Redfield (1963) and Hedges et al. (2002), the predicted PQ values are higher than 1, respec-tively, 1.30 and 1.45.
Error estimates on these NEP values (Table 6) are largely derived from the uncertainty on the water residence time. The analytical error on DIC37 and O2 should not
signifi-cantly affect the NEP estimates, since the variables used in the computations are averages of a large number of observa-tions (assuming that analytical errors are random and not sys-tematic). The air-sea flux correction introduces a relatively small uncertainty in the computations. NEPDI C computed using the air-sea CO2fluxes calculated with Wanninkhof and
McGillis (1999)k parametrization corresponds on average to 99.4, 102.7, 94.7 and 95.0% of NEPDI C computed using thekparametrizations given by, respectively, Liss and Merli-vat (1986), Wanninkhof (1992), Nightingale et al. (2000) and McGillis et al. (2001). NEPO2 computed using the air-sea
O2fluxes calculated with Wanninkhof and McGillis (1999)
kparametrization corresponds on average to 98.5, 96.7, 96.5 and 97.2% of NEPO2 computed using the k
parametriza-tion given by, respectively, Liss and Merlivat (1986), Wan-ninkhof (1992), Nightingale et al. (2000) and McGillis et al. (2001).
This approach is attractive because it is based on large data sets that adequately resolve the spatial variability and considering potential sources of error associated to each method, these estimates (NEPDI C=22±12 mmol C m−2d−1 and NEPO2=10±7 mmol O2m−2d−1)are in fair agreement
with the NEP estimate based on the upscaled incubation mea-surements of 10±22 mmol O2m−2d−1over the Posidonia
oceanica meadow during this cruise (Sect. 3.2.2).
4 Conclusions
58 F. Gazeau et al.: Whole-system metabolism and CO2fluxes in Palma Bay
metabolic balance or slightly heterotrophic, especially dur-ing summer, when the strong increase in ecosystem com-munity respiration, driven by the rise of temperature, greatly exceeds ecosystem gross primary production. This possible heterotrophic nature of the planktonic community and of the whole ecosystem must be supported by allochtonous organic carbon inputs, probably derived from the human population surrounding the Bay of Palma. Unfortunately, information on the amount of organic matter loading to this bay is lack-ing to test this hypothesis. However, inputs from land are expected to be low due to (1) low annual precipitation in the region (about 400 mm yr−1); (2) the lack of rivers and streams to deliver the run-off to the water, as the island is in a kartstic area, where surface water percolate to ground waters; and (3) the zero-loss policy of urban waters, which are treated and then pumped back inland, although there are sporadic inputs during storm surges (Jans´a et al., 1994).
Partial pressure of CO2 (pCO2) normalized to a
con-stant temperature and apparent oxygen utilisation (AOU) val-ues decreased between the two cruises and suggested that the ecosystem is more productive in June than in March. This was clearly inconsistent with net ecosystem production (NEP) rates during these two periods based on incubations. This inconsistency is attributed to the inflow of water masses with different chemical signatures and to the relatively short residence time of the water mass in the bay that was differ-ent during the two cruises. The spatial patterns of pCO2and
AOU were unrelated to those of NEP rates upscaled from O2
incubations, during the March cruise when residence time of the water mass in the bay was less than 3 d. In contrast, during the summer cruise, the spatial patterns of pCO2 and
AOU were consistent with those of NEP upscaled from O2
incubations.
When the water residence time in the bay was long enough (10 d in June), a mass balance approach allowed the deriva-tion of NEP estimates that are in fair agreement with those derived from direct metabolic estimates from incubated sam-ples over the Posidonia oceanica meadow. However, such a mass balance approach requires a detailed physical study to determine the water residence time that is the largest source of uncertainty in the computations. Air-water flux of CO2(or
O2)introduced a relatively small error on the NEP estimates
based on this method, in contrast with other ecosystems char-acterized by much larger air-water fluxes such as estuaries (e.g. Gazeau et al., 20051).
Acknowledgements. We would like to thank U. Riebesell as well
as R. Bellerby and two anonymous reviewers for their useful com-ments and suggestions on our manuscript.
This research was supported by the European Union in the framework of the EUROTROPH project (contract # EVK3-CT-2000-00040), and by a CNRS/CGRI/FNRS/CSIC cooperation. We thank the officers, crew and technical staff of the Tethys II and Mytilus for full collaboration during the EUBAL cruises, D. Tailliez for operating the rosette and CTD and processing the
data during EUBAL-I, C. Copin-Mont´egut for providing the DY-FAMED dataset, R. Biondo, E. Libert, R. Mart´ınez, M.-D. Pizay, R. Santiago and J.-M. Th´eate for technical support. A. V. Borges and M. Frankignoulle are, respectively, a post-doctoral researcher and a senior research associate at the FNRS. C. Barr´on benefited from a grant from the Balearic government, and N. Navarro ben-efited from a fellowship from the Spanish Ministry of Education, Culture and Sports.
Edited by: U. Riebesell
References
Allen, J. T., Alderson, S. G., Ruiz, S., Nurser, A. G., and Griffiths, G.: Shipboard VM-ADCP observations during RRS Discovery cruise 224, Internal Document n◦21, Southampton Oceanogra-phy Centre, 1997.
Atkinson, M. J. and Smith, S. V.: C:N:P ratios of benthic marine plants, Limn. Ocean., 28 (2), 568–574, 1983.
Barranguet, C., Herman, P. M. J., and Sinke, J. J.: Microphytoben-thos biomass and community composition studied by pigment bimoarkers: importance and fate in the carbon cycle of a tidal flat, J. Sea Res., 38, 59–70, 1997.
B´egovic, M. and Copin-Mont´egut, C.: Processes controlling annual variations in the partial pressure of CO2 in surface waters of the central northwestern Mediterranean Sea (Dyfamed site), Deep-Sea II, 49 (11), 2031–2047, 2002.
Benson, B. B. and Krause, D. J.: The concentration and isotopic fractionation of oxygen dissolved in fresh water and seawater in equilibrium with the atmosphere, Limn. Ocean., 29 (2), 620–632, 1984.
Bethoux, J. P. and Copin-Mont´egut, G.: Biological fixation of at-mospheric nitrogen in the Mediterranean Sea, Limn. Ocean., 31 (6), 1353–1358, 1986.
Borges, A. V. and Frankignoulle, M.: Short-term variations of the partial pressure of CO2 in surface waters of the Galician up-welling system, Prog. Ocean., 51 (2–4), 283–302, 2001. Borges, A. V. and Frankignoulle, M.: Distribution of surface
car-bon dioxide and air-sea exchange in the upwelling system off the Galician coast, Global Biogeochem., 16 (2), art. no. 1020, doi:10.1029/20000GB001385, 2002.
Borges, A. V., Delille, B., Schiettecatte, L.-S., Gazeau, F., Abril, G., and Frankignoulle, M.: Gas transfer velocities of CO2in three European estuaries (Randers Fjord, Scheldt and Thames), Limn. Ocean., 49(5), 1630–1641, 2004.
Carrit, D. E. and Carpenter, J. H.: Comparison and evaluation of currently employed modifications of the Winkler method for de-termining dissolved oxygen in seawater: a NASCO Report, J. Marine Res., 24, 286–319, 1966.
Chen, C. T. A., Liu, K. K., and Macdonald, R.: Continental margin exchanges, in: Ocean biogeochemistry, edited by: Fasham, M. J. R., Springer, 53–97, 2003.
Copin-Mont´egut, C.: A new formula for the effect of temperature on the partial pressure of CO2in seawater, Mar. Chem., 25, 29– 37, 1988.