JIEM, 2010 – 3(1): 221-248 – Online ISSN: 2013-0953 Print ISSN: 2013-8423
Evaluating the effectiveness of a priori information on process
measures in a virtual reality inspection task
Shannon Raye Bowling
Old Dominion University (USA)
Received October 2009
Accepted April 2010
Abstract:
Due to the nature of the complexity of the aircraft maintenance industry, much
emphasis has been placed on improving aircraft inspection performance. One proven
technique for improving inspection performance is the use of training. Several strategies
have been implemented for training, one of which is giving feedforward information. The
purpose of this study evaluates the effects of feedforward information on process measures
in a simulated 3-dimensional environment (aircraft cargo bay) by the use of virtual reality.
The study was conducted using six subjects performing inspection in a simulated aircraft
cargo bay. Results show that the use of feedforward information positively impact
inspection performance in terms of process measures (fixation points, fixation durations,
and area covered).
Keywords: virtual reality, aircraft inspection, visual inspection, feedforward information,
visual search, eye-tracking
1 Introduction
JIEM, 2010 – 3(1): 221-248 – Online ISSN: 2013-0953 Print ISSN: 2013-8423
insights about how subjects are moving their eyes and exactly what they are looking at.
Inspection in some form pervades the lives of many people today. Whether inspection is used to determine the quality of fruit or poultry at the grocery store or if it is used to detect defects that may prevent a catastrophic failure of a structure, the consequences of inspection directly affect people’s lives. There are many forms of inspection, however the most prevalent in our society is visual inspection. Though other forms of inspection exist, such as automated inspection tasks, the brunt of most inspection tasks are performed by humans. Because of this fact, it is important to understand how visual inspection is conducted. Although human visual inspection is widespread and economically important (Harris & Chaney, 1969), there exist little theoretical understanding of it (Schoonard, Gould & Miller, 1973). However, one fact that is known about most visual inspection tasks is the two components that compose it. Visual inspection is comprised of two components; these are visual search and decision-making (Drury, 1978; Sinclair, 1984; Drury, 1992). While humans are very good at making decisions, they often lack in the ability to adequately and efficiency perform visual search. Machines, such as computers, often have the ability of perform rapid searches, however they often lack in the ability to make correct and consistent decisions. Because of this fact, most inspection tasks in some way involve humans.
2 Visual inspection
2.1 Visual search
JIEM, 2010 – 3(1): 221-248 – Online ISSN: 2013-0953 Print ISSN: 2013-8423
In a typical visual search experiment, observers are presented with a display containing a number of items. One each trial, the observers must determine if a specific target item is or is not present among the distracter items. The number of items (set size) varies from trial to trial. Experimenters measure the reaction time (RT), the amount of time that is required to make a present” or “target-absent” response. They also note the accuracy of that response. Changes in accuracy and RT as a function of set size constitute the preferred measures of search performance.
One factor suggested throughout the years that may affect visual search is color of the target and distracters. However, the typical finding is that there is little, if any, increased response time when targets and distracters are discriminated by color, provided the colors can be easily discriminated (Carter, 1982; Duncan, 1989; Treisman & Gelade, 1980; Treisman & Gormican, 1988). Gibson & Jiang (1988) also found that an unexpected color singleton does not capture attention in visual search. Another factor suggested that may affect visual search is spatial location of the target. Studies have revealed that absolute spatial position of a distractor does not seem to influence response time (Meegan & Tipper, 1999).
As noted by Wolfe (1998), performance on search tasks varies in a systematic way with the nature of the search stimuli. For some tasks, performance does not depend on set size. For example, in a search for a red spot among green spots, the number of green spots is irrelevant. Accuracy will be high and RT fast for all set sizes. The slope of the RT X Set Size function will be near zero. The independence of RT and set size is consistent with parallel processing of all items. For other tasks, RT is a roughly linear function of set size. For example, in a search for an S among mirror-reversed Ss, RTs will increase at a rate of approximately 20 to 30 ms/item for target-present trials and 40 to 60 ms/item for target-absent trials. The linear increase in RT and the 2:1 ratio between target-absent and target-present slopes is characteristic of a serial, self-terminating search, though it is also consistent with various limited-capacity (Townsend, 1971, 1990) and unlimited-capacity (Palmer & McLean, 1995) parallel search processes.
JIEM, 2010 – 3(1): 221-248 – Online ISSN: 2013-0953 Print ISSN: 2013-8423
(1980) proposed that searches for basic features like color, motion, and orientation are parallel, whereas other searches, like those for S’s among mirror-reversed S’s are serial. Further, they argued that conjunction searches fall into the serial category. A target stimulus in a visual search task may be defined either by a distinct feature (feature search task) or by a particular combination or conjunction (Conjunction search task) (Williams, Reingold, Moscovitch, & Behrmann, 1997). For example, in a feature search task, subjects might be asked to look for a red “O” among blue and green “O”s. Here the target’s color is a unique feature that distinguishes it from the distracters. In a conjunction search task, the target stimulus might be the same red “O,” but this time, the distracters could be blue “O”s and red “X”s. In this case, each distractor shares at least one feature with the target, such that the target can only be defined by a specific conjunction of color and shape. Conjunction search tasks are searches in which the target is defined by two or more basic features. For example, the target might be a small blue item among big blue and small yellow items.
In feature search tasks, the target stimulus is typically found quickly and easily; it seems to “pop out” from the background and distracter stimuli. As a result, the number of distracters in the visual array has little effect on the subjects’ latencies. In a conjunction search task, on the other hand, average response time usually increases as a function of display size (Williams et al., 1997). Research has shown that many conjunction searches are more efficient than would be predicted by a strictly serial search (Cohen, 1993; Dehaene, 1989).
2.2 Series/Parallel search
JIEM, 2010 – 3(1): 221-248 – Online ISSN: 2013-0953 Print ISSN: 2013-8423
attention must be focused on each stimulus in turn, allowing its features to be conjoined to form a unitary object. This process continues until the target stimulus is identified or until the subject, having searched the entire array, decides that it is absent (Treisman & Gelade, 1980).
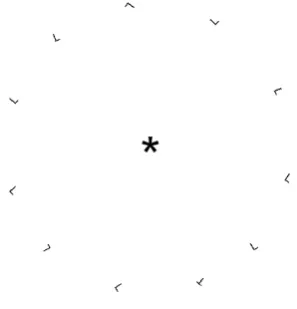
During the period of time following the introduction of the feature integration theory of attention, further research has shown that the situation is more complex than the simple parallel-serial dichotomy initially proposed (Wolfe, 1998). Wolfe (1998) proposes an example that illustrates that visual search is both series and parallel depending on target size. Figure one gives an example of a “parallel” search. While focusing on the center star, a subject can easily identify the “X” and “T” embedded in the ring of characters encircling the star. This is an example of where the target seems to “pop out” to the subject. Figure two gives a similar example where the field size has not changed but the target size has been reduced. Now for the subject to identify the “T” embedded in the ring of characters encircling the star, the inspector must begin a “serial” search, in which the subject systemically scans each of the characters on the outer ring and decides what character is the target character. Duncan and Humphreys (1989) showed that search becomes more difficult as the individual stimuli become smaller and Cohen and Ivry (1991) found that search become more difficult as stimulus density increases. Target eccentricity also affects performance in both feature search tasks (Scialfa, Thomas, & Joffe, 1994; Viviani & Swensson, 1982) and conjunction search tasks (Carrasco, Evert, Chang, & Katz, 1995; Scialfa & Joffe, 1998). Search difficulty increases with both distractor heterogeneity and target-distractor similarity (Treisman, 1991; Duncan & Humphreys, 1992; Treisman & Gormican, 1988). Patterns of response times consistent with serial processing have been observed in feature search tasks when the target and or when distractors are heterogeneous (Wolfe, Friedman-Hill, Stewart, & O’Connell, 1992).
JIEM, 2010 – 3(1): 221-248 – Online ISSN: 2013-0953 Print ISSN: 2013-8423
efficiency, with shorter response times and a shallower slope indicating more efficient search.
Figure 1. “Example of Parallel Search Pattern”. Source. Own contribution
Figure 2. “Example of Serial Search Pattern”. Source. Own contribution
JIEM, 2010 – 3(1): 221-248 – Online ISSN: 2013-0953 Print ISSN: 2013-8423
to take into account that subjects’ processing of displays was cut short by the brief exposure duration (Treisman & Gormican, 1988. However a study by Scialfa and Joffe (1998) suggests that preventing eye movements does affect reaction time and accuracy.
2.3 Feedforward information
The use of feedforward or a priori information has been shown to increase performance of inspectors. Prior knowledge or information consists of the concepts, goals, rules, and other information already stored in memory about a particular topic. One example of feedforward information is the use of past experience; subjects (inspectors) typically concentrate their search on a subset of the more probable faults types. Other examples of feedforward information may include issuing information about lot quality, probable defect location, and criticality of defects. Sheehan and Drury (1971) found that informing an inspector which defect would be present before each inspection trial greatly improved inspection performance. Evaluation using signal detection theory showed the prior information had caused the inspector’s detectability to increase, thereby increasing the number of correct rejections.
The ways in which inspectors use feedforward information is not uniform and varies from inspector to inspector. McKernan (1989) suggests that inspectors may 1) ignore the information completely, 2) selectively incorporate only some of the information, or 3) incorporate the information only after gaining verification from the initial inspection segments.
McKernan (1989) suggest that experienced inspectors may make use of feedforward information in a way that complements their sensitivity to the fault. If the fault is one that is not easily detected by the inspector, he/she will rely heavily on the information provided. West (1981) also came to the same notion. His results indicate that inspectors will use prior information in situations that are ambiguous. If an inspector is unsure of what to expect, he/she will adjust search time based on the prior information.
JIEM, 2010 – 3(1): 221-248 – Online ISSN: 2013-0953 Print ISSN: 2013-8423
use it. The prior information will not help search performance. Results seem to indicate that inspectors use the information where they need assistance in the inspection task, and when they are able to add it to their memory load.
Though inspectors might not use feedforward information, the use of excessive prior information may in fact reduce the inspector performance in a visual search task. When a relatively simple stimulus such as a tone or visual shape is repeatedly presented as irrelevant, it becomes difficult for that stimulus to enter into new associations (Lubow & Kaplan, 1997).
Because excessive amount of feedforward information may be of no use to the inspector or may worsen performance, McKernan (1989) suggests there should exist an optimum amount of information which, when given to the inspector in the proper form, will allow him/her to make accurate judgments without having to interpret any extraneous information. It has been shown that prior information may increase lobe size, direct eye movement patterns, enhance conspicuity, and decrease human error. The purpose of this current study is to expand on McKernan’s work to determine what the optimal amount of feedforward information should be in order to maximize performance.
Due to technological limitations in the past, process measures were indirectly measured using performance measures as surrogates. However because equipment capabilities and computational power have increased drastically over the past decade, researchers now have the abilities to measure process measure directly using eye-tracking technology. Some recent examples of this include, Duchowski (2000), Laemlaksakul and Kaewkuekool (2007), Nalangulaa, Greenstein, and Gramopadhye (2006), Gramopadhye, Bhagwat,
3 Methodology
Kimbler, and Greenstein (1998). This work hopes to expand on these studies.
3.1 Experimental procedures
The subjects for this research consisted of 6 students from Clemson University. Each of the students was paid ten dollars per hour for their participation. Students can be used in lieu of inspectors because as Gallwey and Drury (1986) have shown
JIEM, 2010 – 3(1): 221-248 – Online ISSN: 2013-0953 Print ISSN: 2013-8423
minimal differences exist between inspectors and student subjects under experimental conditions. Only subjects that had 20/20 vision were used for the experiment because of the required use of the VR helmet. The use of a small number of subjects was due to the fact that subjects went through a rigorous training regimen and spend a significant amount of time in the virtual environment. While the number of subjects performing the experiment was relatively small, the total number of samples from the runs was adequate (4*18=72).
The stimulus material consisted of a Virtual Reality (VR) environment that was developed based on a detailed task analytic methodology (Duchowski et. al., 2000). Data on aircraft inspection activity was collected through interviewing, shadowing, observation, using still and video images, and digital record techniques. The task was a simulated visual inspection of an airframe using a Virtual Reality (VR) environment.
Stimulus material
Figure 3. “Virtual Reality Eye Tracking (VRET) Laboratory at Clemson University”. Source: Own Contribution.
The experiment was conducted on a Dual-processor 1.5GHz Linux (RH 7.3) PC equipped with 1G RAM and an NVidia GeForce4 Ti4600 graphics card. The hardware components included a binocular ISCAN eye tracker mounted within a Virtual Reality V8 Head Mounted Display (HMD) with separate eye feeds, each having a resolution of 640x480. Navigation was achieved through a tracking system utilizing Ascension Technology Corporation's Flock of Birds (FOB). A hand-held mouse having 6 Degrees Of Freedom (DOF) was used as a virtual tool in the
JIEM, 2010 – 3(1): 221-248 – Online ISSN: 2013-0953 Print ISSN: 2013-8423
environment (Duchowski et al., 2000). Figure 3 shows Virtual Reality Eye Tracking (VRET) Laboratory at Clemson University where the study was conducted.
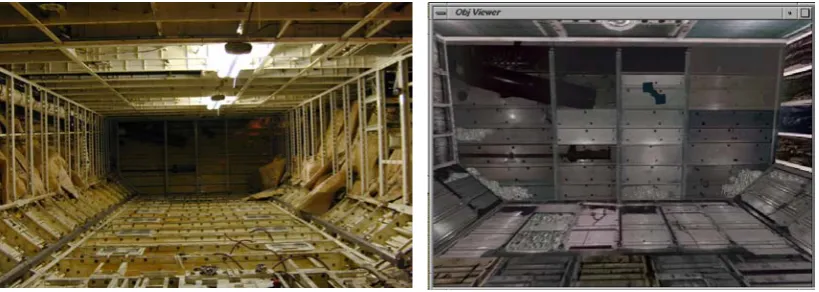
The criterion task consisted of inspecting a simulated aircraft cargo bay similar in dimension, shape, and structure to the real cargo bay of an L1011 aircraft. Figure 4 shows both a real and the simulated VR aircraft cargo bay.
Visual Search Task
Figure 4. “Real (left) and VR (right) Aircraft Cargo bay”. Source: Own contribution.
The inspection task involved only a visual search component. Subjects were asked to locate one of six types of defects.
The criterion task consisted of inspecting the simulated aircraft cargo bay and searching for damage. Damage is defined as any cross-sectional area change or permanent distortion of a structural member. Damage is classified in the following three categories: allowable damage, repairable damage and damage necessitating replacement of damaged parts.
Several defects can occur in a real environment situation, these include:
1. Dent: Normally a damage area which is depressed with respect to its normal contour. There is no cross-sectional area change in the material. Area boundaries are smooth. Its form is generally the result of contact with a relatively smoothly contoured object.
JIEM, 2010 – 3(1): 221-248 – Online ISSN: 2013-0953 Print ISSN: 2013-8423
size, which results in, a cross-sectional area change due to scuffing, rubbing, scraping, or other surface erosion. It is usually rough and irregular.Gouge: A damage area of any size, which results in a cross-sectional area change. It is usually caused by contact with a relatively sharp object, which produces a continuous, sharp or smooth channel-like groove in the material.Nick: A local gouge with sharp edges. Consider a series of nicks, in a line pattern to be the equivalent of a gouge.
6. Scratch: A line of damage of any depth in the material and results in a cross-sectional area change. It is usually caused by contact with a very sharp object.
7. Crack: A partial fracture or complete break in the material and produces the most significant cross-sectional area change. In appearance, it is usually an irregular line and is normally the result of fatigue failure.
8. Corrosion: Due to a complex electro-chemical action, it is a damage area of any size and depth, which results in a cross-sectional area change. Depth of such pitting damage must be determined by a clean up operation. Damage of this type may occur on surfaces of structural elements.
9. Hole: Any perforation of the surface which is completely surrounded by undamaged material. Other forms of damage may be removed by creating a hole of a regular shape, provided that it is within the allowable damage limits or can be repaired in an appropriate manner.
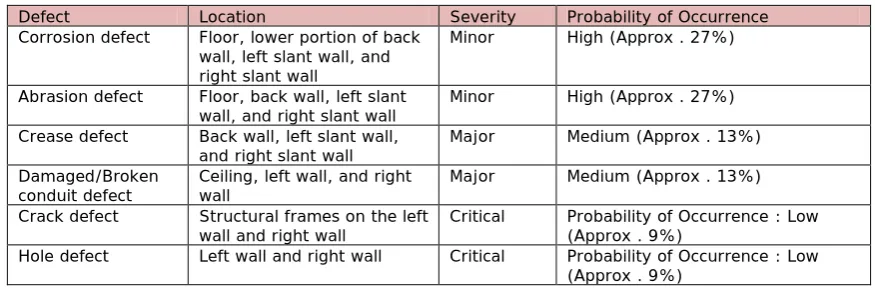
Defect Location Severity Probability of Occurrence Corrosion defect Floor, lower portion of back
wall, left slant wall, and right slant wall
Minor High (Approx . 27%)
Abrasion defect Floor, back wall, left slant
wall, and right slant wall Minor High (Approx . 27%) Crease defect Back wall, left slant wall,
and right slant wall Major Medium (Approx . 13%) Damaged/Broken
conduit defect Ceiling, left wall, and right wall Major Medium (Approx . 13%) Crack defect Structural frames on the left
wall and right wall Critical Probability of Occurrence : Low (Approx . 9%) Hole defect Left wall and right wall Critical Probability of Occurrence : Low
(Approx . 9%)
Table 1. “Defects chosen for VR Simulator”. Source: Own contribution
JIEM, 2010 – 3(1): 221-248 – Online ISSN: 2013-0953 Print ISSN: 2013-8423
3.2 Training
Subjects were instructed to perform the visual inspection task using four levels of feedforward information. The levels were minimal feedforward information (M.F.F.), feedforward information pertaining to severity (F.F.S.), feedforward information pertaining to severity and probability of occurrence (F.F.S.P.), and full feedforward information pertaining to severity, probability of occurrence, and location (F.F.S.P.L.). Minimal feedforward information is equivalent to no feedforward information at all. The terminology of minimal feedforward information is used to represent the minimal amount of information required to perform the task.
Subjects were presented with information pertaining to each of the feedforward conditions. Each presentation contained information specific to the type of feedforward information being presented. The minimal feedforward information (M.F.F.) presentation contained a minimal amount of information required for subject to search for various types of defects. The (M.F.F.) presentation contained information pertaining to what types of defects can exist in the aircraft cargo bay, a description of each, and an image of each type of defect. The severity feedforward information (F.F.S.) presentation contained information pertaining to severity (minor, major, critical) of each type of defect in addition to the (M.F.F.) presentation. The probability feedforward information (F.F.S.P.) presentation contained information pertaining to probability (low, medium, high) of occurrence for each type of defect in addition to the (F.F.S.) presentation. The location feedforward information (F.F.S.P.L.) presentation contained information pertaining to location of occurrence for each type of defect in addition to the (F.F.S.P.) presentation.
JIEM, 2010 – 3(1): 221-248 – Online ISSN: 2013-0953 Print ISSN: 2013-8423
blocking factors, not because subjects have a poor understanding of the feedforward information being presented.
Prior to the actual study, each of the participants were exposed to the VR environment. Subjects were trained in the use of the VR helmet and 3-D mouse used to identify defects in the simulated environment. Subjects also underwent training in aircraft inspection; this consisted of attending presentations that educated them as to what defines defects and the various types of defects found in an actual aircraft cargo bay. The purpose of the training was to ensure subjects had sufficient knowledge to participate in the experiment.
Each subject was requested to complete a consent form and a demographic questionnaire. Next, all the subjects were provided information about the task they had to perform. They were shown the entire search area of the virtual aircraft cargo bay and were provided with graphical and verbal description of all the types of defects.
Subjects were then presented with a familiarization task similar to the actual criterion task using the VR simulator. As the subjects were acquainted with the system, they were then shown how to use the 3-D mouse for pointing and clicking targets (defects).
The following hypotheses were examined for the study,
• a. There is a significant difference on inspection performance for each
•
level of feedforward information as measured by number of fixation points
b. There is a significant difference on inspection performance for each
•
level of feedforward information as measured by number of fixation groups
c. There is a significant difference on inspection performance for each
•
level of feedforward information as measured by mean fixation duration
JIEM, 2010 – 3(1): 221-248 – Online ISSN: 2013-0953 Print ISSN: 2013-8423
3.3 Pilot study
In order to ascertain information pertaining to the subjects’ ability to perform in the simulated aircraft cargo bay, a pilot study was conducted. The purpose of the pilot study was twofold. First, having the subjects replicate the experiments provides additional training in the use of VR. The training reduces the learning effect of subsequent trials and thereby gives a more accurate representation of the subjects’ performance. Second, by analyzing the performance measures such as inspection times, pacing times were developed for use in the actual experiment.
The pilot study consisted having each of the six subjects perform two runs for the minimal feedforward information experiment. The pilot study was conducted unpaced and identical to that of the actual experiment. The pilot study required each subject to perform 2 runs for a total of 12 runs. The layout of the study can be seen in Table 2, where S1 and S2 represent scenarios one and two.
Subject 1 2 3 4 5 6
M.F.F S1, S2 S1, S2 S1, S2 S1, S2 S1, S2 S1, S2
Table 2. “Layout of Pilot Study”. Source: Own contribution.
3.4 Research issues
In order to determine if there is a difference in the performance of inspectors given varying levels of feedforward information, the following general hypothesis was developed: Feedforward information positively affects the performance of inspectors in a simulated aircraft inspection task.
To make comparisons pertaining to the effect of interventions in the VR environment, specific process measures were developed. The measures consist of four categories, they include: number of fixation points, number of fixation groups, mean fixation duration, and percent area covered.
Analyses were performed on various process measures after completion of the experiment. The process measures include, number of fixation points (FP), number of fixation groups (FG), mean fixation duration (MFD), and percent area covered
JIEM, 2010 – 3(1): 221-248 – Online ISSN: 2013-0953 Print ISSN: 2013-8423
(AC). An analysis of variance (ANOVA) was conducted on each performance measure. The general linear model used to analyze the performance of the inspectors based on different response variables has the form:
ijk k j i
ijk
T
R
Y
=
µ
+
+
β
+
+
ε
where
Yijk
µ = overall mean
= Dependent variable (FP, FG, MFD, and AC)
Ti
β
= type of feedforward information, i = 0,1,2,3
k
R
= blocking effect (Subject Number), j = 1,2,…,6,
l
ε
= Replication (blocking factor 2) effect, k = 1, 2, and
ijk
3.5 Actual study
= overall error term.
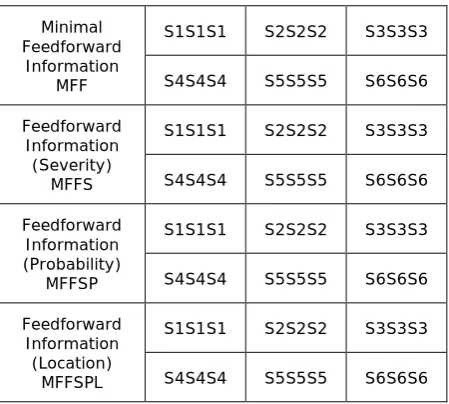
The actual study required each subject to complete three replicates for each of the four levels of feedforward information. Each level of feedforward information contained 18 replicates (3*6=18). The total number of replicates for the experiment was 72 (4*18=72). Each subject took approximately 20 minutes to complete each scenario and one hour to complete the daily experiment. With a total of six subjects the amount of time spent per day on the experiment was approximately six hours. The layout of the study can be seen in Table 3, where S1, S2, and S3 represent scenarios one, two, and three.
4 Results
JIEM, 2010 – 3(1): 221-248 – Online ISSN: 2013-0953 Print ISSN: 2013-8423
Minimal Feedforward
Information MFF
S1S1S1 S2S2S2 S3S3S3
S4S4S4 S5S5S5 S6S6S6
Feedforward Information (Severity)
MFFS
S1S1S1 S2S2S2 S3S3S3
S4S4S4 S5S5S5 S6S6S6
Feedforward Information (Probability)
MFFSP
S1S1S1 S2S2S2 S3S3S3
S4S4S4 S5S5S5 S6S6S6
Feedforward Information (Location)
MFFSPL
S1S1S1 S2S2S2 S3S3S3
S4S4S4 S5S5S5 S6S6S6
Table 3. Layout of Actual Study. Source: Own contribution.
4.1 Fixation points
An ANOVA was conducted on subjects’ number of fixation points during the experiment. The analysis revealed a significant main effect of type of feedforward information (F(3, 61) = 5.10, p < 0.01). The blocking effect of subject was found to be significant (F(5, 61) = 53.55, p < 0.01), and hence the precision of the estimates of the treatment means was improved. However, the blocking effect of replicate was not found to be significant.
Figure 5 shows the effect feedforward information has on number of fixation points. The figure shows a general upward trend in the number of fixation points as the amount of feedforward information increases. In order to determine what levels significantly differ, Fisher’s Protected Least Significant Difference Procedure (Fisher’s LSD) was performed on the least squares means for the treatment factor. The results of this analysis are shown in Table 4.
Type M.F.F. F.F.S. F.F.S.P. F.F.S.P.L.
M.F.F. - 0.187 0.0705 *
F.F.S. - 0.6214 *
F.F.S.P. - **
F.F.S.P.L. -
* Significant at .01 level; ** Significant at .05 level
JIEM, 2010 – 3(1): 221-248 – Online ISSN: 2013-0953 Print ISSN: 2013-8423
Figure 5. “Number of Fixation Points as a Function of Amount of Feedforward Information Provided”. Source: Own contribution
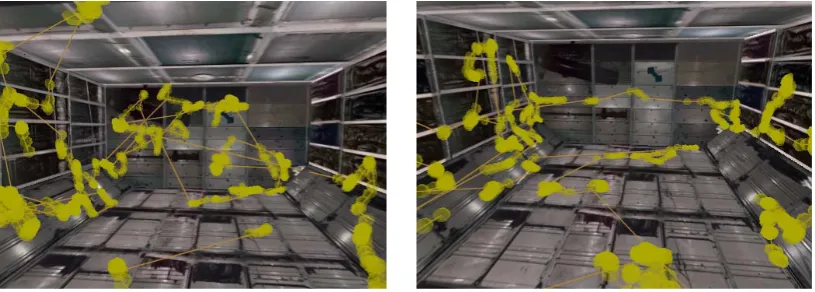
Figure 6. “Fixation Points for M.F.F”. Figure 7. “Fixation Points for F.F.S”.
Figure 8. “Fixation Points for F.F.S.P”.
1300
1350
1400
1450
1500
1550
1600
1650
1700
M.F.F.
F.F.S .
F.F.S.P.
F.F.S.P.L.
F
ixat
ion
P
oi
n
ts
JIEM, 2010 – 3(1): 221-248 – Online ISSN: 2013-0953 Print ISSN: 2013-8423
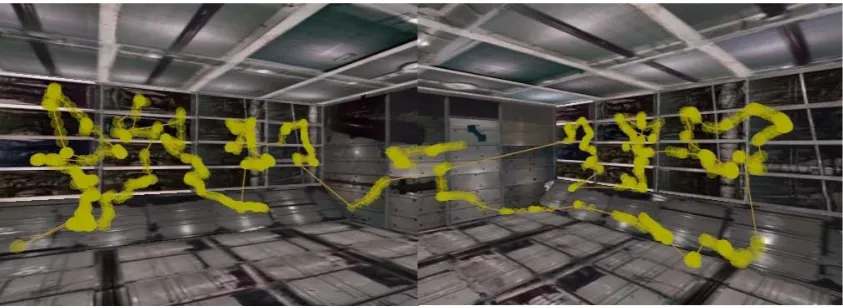
Figures 6-9 show various samples of fixation points for different levels of feedforward information. As can be seen from figures 6 through 9, the search process becomes more systematic and efficient as feedforward information is increased.
Figure 9. “Fixation Points for F.F.S.P.L.”. Source: Own contribution.
4.2 Fixation groups
An ANOVA was conducted on subjects’ number of fixation groups during the experiment. The analysis revealed a significant main effect of type of feedforward information (F(3, 61) = 20.75, p < 0.01). The blocking effect of subject was found to be significant (F(5, 61) = 53.93, p < 0.01), and hence the precision of the estimates of the treatment means was improved. However, the blocking effect of replicate was not found to be significant.
Figure 6. “Number of Fixation Groups as a Function of Amount of Feedforward Information Provided”. Source: Own contribution.
40
45
50
55
60
65
70
M.F.F.
F.F.S .
F.F.S.P.
F.F.S.P.L.
F
ixat
ion
G
rou
p
s
JIEM, 2010 – 3(1): 221-248 – Online ISSN: 2013-0953 Print ISSN: 2013-8423
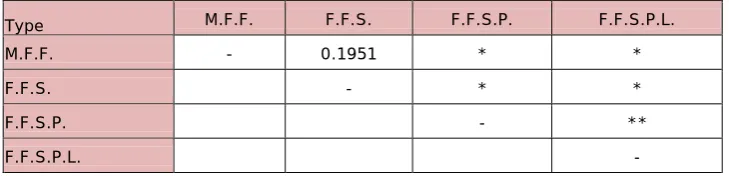
Figure 6 shows the effect feedforward information has number of fixation groups. The figure shows a general upward trend in the number of fixation groups as the amount of feedforward information increases. In order to determine what levels significantly differ, Fisher’s Protected Least Significant Difference Procedure (Fisher’s LSD) was performed on the least squares means for the treatment factor. The results of this analysis are shown in Table 5.
Type M.F.F. F.F.S. F.F.S.P. F.F.S.P.L.
M.F.F. - 0.1951 * *
F.F.S. - * *
F.F.S.P. - **
F.F.S.P.L. -
* Significant at .01 level; ** Significant at .05 level
Table 5. “Fisher’s LSD on Number of Fixation Groups”. Source: Own contribution.
4.3 Mean fixation duration
An ANOVA was conducted on subjects’ mean fixation duration during the experiment. The analysis revealed a significant main effect of type of feedforward information (F(3, 61) =7.64, p < 0.01). The blocking effect of subject was found to be significant (F(5, 61) = 8.03, p < 0.01), and hence the precision of the estimates of the treatment means was improved. However, the blocking effect of replicate was not found to be significant.
Figure 7. “Mean Fixation Duration as a Function of Amount of Feedforward Information Provided”. Source:Own contribution.
750
800
850
900
950
1000
1050
M.F.F.
F.F.S .
F.F.S.P.
F.F.S.P.L.
M
ean
F
ixat
ion
D
u
rat
ion
JIEM, 2010 – 3(1): 221-248 – Online ISSN: 2013-0953 Print ISSN: 2013-8423
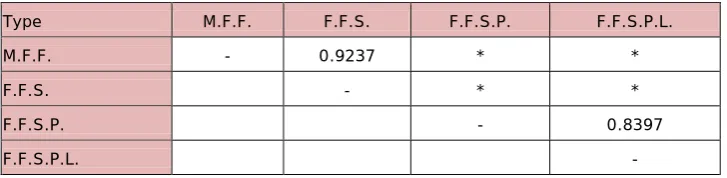
Figure 7 shows the effect feedforward information has on mean fixation duration. The figure shows a general downward trend in mean fixation duration as the amount of feedforward information increases. In order to determine what levels significantly differ, Fisher’s Protected Least Significant Difference Procedure (Fisher’s LSD) was performed on the least squares means for the treatment factor. The results of this analysis are shown in Table 6.
Type M.F.F. F.F.S. F.F.S.P. F.F.S.P.L.
M.F.F. - 0.9237 * *
F.F.S. - * *
F.F.S.P. - 0.8397
F.F.S.P.L. -
* Significant at .01 level
Table 6. “Fisher’s LSD on Mean Fixation Duration”. Source:Own contribution.
4.4 Area covered
An ANOVA was conducted on subjects’ area covered during the experiment. The analysis revealed a significant main effect of type of feedforward information (F(3, 61) = 21.73, p < 0.01). The blocking effect of subject was found to be significant (F(5, 61) = 32.08, p < 0.01), and hence the precision of the estimates of the treatment means was improved. However, the blocking effect of replicate was not found to be significant.
Figure 8. “Area Covered as a Function of Amount of Feedforward Information Provided”. Source. Own contribution.
25
27
29
31
33
35
37
39
M.F.F.
F.F.S.
F.F.S.P.
F.F.S.P.L.
%
A
rea
C
ove
red
JIEM, 2010 – 3(1): 221-248 – Online ISSN: 2013-0953 Print ISSN: 2013-8423
Figure 8 shows the effect feedforward information has on area covered. The figure shows a general upward trend in area covered as the amount of feedforward information increases. In order to determine what levels significantly differ, Fisher’s Protected Least Significant Difference Procedure (Fisher’s LSD) was performed on the least squares means for the treatment factor. The results of this analysis are shown in Table 7.
Type M.F.F. F.F.S. F.F.S.P. F.F.S.P.L.
M.F.F. - 0.4322 * *
F.F.S. - * *
F.F.S.P. - *
F.F.S.P.L. -
* Significant at .01 level
Table 7. “Fisher’s LSD on Area Covered”.
5 Discussion
The purpose of this study evaluates the effects of feedforward information on process measures in a simulated 3-dimensional environment (aircraft cargo bay) by the use of virtual reality. Results show that the use of feedforward information positively impact inspection performance in terms of process measures (fixation points, fixation durations, and area covered). However, the study also shows that the positive impact varies based on what type and how much feedforward information is provided to inspector. The following sections discuss the findings.
5.1 Fixation points
JIEM, 2010 – 3(1): 221-248 – Online ISSN: 2013-0953 Print ISSN: 2013-8423
area of interest. By doing this, the inspectors were able to fixate on more areas during the inspection, thereby increasing the number of fixation points.
5.2 Fixation groups
Analysis of the number of fixation groups yielded results similar to that of fixation points. The only exception is that probability information is significantly higher than no feedforward and severity information. One explanation for this may be that while performing the inspection with more feedforward information, especially with information pertaining to statistical characteristic of defects (probability and location), inspectors fixate less time on areas of interest. Inspectors would have a tendency of fixating less time, if they knew the likelihood of when and where defects should occur. The inspector probably does not do an exhaustive search with this information, but rather an “educated” search using the information given. This thereby reduces the fixation duration and increases the fixation groups.
5.3 Mean fixation duration
The results of this analysis are analogous to the result of the preceding section. Inspectors receiving more feedforward information do in fact fixate, on average, less time than without feedforward information, or non-statistical feedforward information (severity). Only statistical feedforward information (probability and location) are significantly different (lower) from the analysis. This fact supports the hypothesis in the preceding section as to why the number of fixation groups is higher for probability and location.
5.4 Area covered
Because area covered is dependent on the number of fixation groups, the analysis should yield similar results. In fact the results of area covered are identical to that of number of fixation points. All levels of feedforward information were significant with the exception of severity information.
6 Conclusions
JIEM, 2010 – 3(1): 221-248 – Online ISSN: 2013-0953 Print ISSN: 2013-8423
fixations, reducing mean fixation duration and increasing area covered as the level of feedforward information increased.
The results of this study bode well with the literature suggesting feedforward information is useful in improving inspection performance (McKernan, 1989). However, this study also suggests that some forms information may be more beneficial than others. Therefore depending on the difficulty of acquiring various forms of feedforward information, industries should consider the return, in terms of performance increase, before making investments to acquire this information.
The acquisition of feedforward information pertaining to defects is not trivial in a complex inspection task such as aircraft inspection. Acquiring information pertaining to severity, probability and location may require substantial resource investment. This is especially true in the airline industry where many different aircraft exists and each one has its own characteristic pertaining to the feedforward information it contains.
The purpose of this study was to help determine in what ways resources should be invested in order to maximize inspection performance from the available information of the inspection environment. Once established what feedforward information yields the highest increases in inspection performance, resources can then be diverted to acquiring that information.
Acknowledgements
We would like to thank Delta Airlines Tech-Operations facility in Atlanta, GA for the use of their facility and help in acquiring the information necessary for this study. We would also like to thank John Govendnik of Delta Airlines for all of his support and help in the study. This research was supported by a grant from NASA-AMES research center, Task # NCC 2-1288.
References
Carrasco, M., Evert, D. L., Chang, I., & Katz, S. M. (1995). The eccentricity effect: Target eccentricity affects performance on conjunction searches. Perception and
JIEM, 2010 – 3(1): 221-248 – Online ISSN: 2013-0953 Print ISSN: 2013-8423
Carter, R. C. (1982). Visual search with color. Journal of Experimental Psychology:
Human Perception and Performance, 8, 127-136.
Chmiel, N. (1989). Response effects in the perception of conjunctions of color and
form. Psychological Research, 51, 117-122.
Cohen, A. (1993). Asymmetries in visual search for conjunctive targets. Journal of
Experimental Psychology: Human Perception and Performance, 19, 775-797.
Cohen, A., & Ivry, R. B. (1991). Density effects in conjunction search: Evidence for a coarse location mechanism of feature integration. Journal of Experimental
Psychology: Human Perception and Performance, 17, 891-901.
Dehaene, S. (1989). Discriminability and dimensionality effects in visual search for featural conjunctions: A functional pop-out. Perception and Psychophysics, 46, 72-80.
Drury, C. G. (1992). Inspection performance, in Handbook of Industrial Engineering, 2nd
Drury, C. G., & Clement, M. R. (1978). The effect of area, density, and number of background characters on visual search. Human Factors, 20, 597-602.
ed., Chapter 88, by G. Salvendy (ed.) (Wiley and Sons, New York).
Duchowski, A. T., Shivashankaraiah, V., Rawls, T., Gramopadhye, A.K., Melloy, B., & Kanki, B. (2000). Binocular Eye Tracking in Virtual Reality for Inspection Training. In Eye Tracking Research and Applications Symposium, ACM.
Duncan, J., & Humphreys, G.W. (1989). Visual Search and Stimulus Similarity.
Psychological Review, 96, 433-458.
Duncan, J., & Humphreys, G. W. (1992). Beyond the search surface: Visual search and attentional engagement. Journal of Experimental Psychology: Human
JIEM, 2010 – 3(1): 221-248 – Online ISSN: 2013-0953 Print ISSN: 2013-8423
Ernst, R. & Yovits, M., 1972, Information Science as an Aid to Decision-Making, Decision Making: Creativity, Judgment, and Systems, ed. Brinkers, H., Ohio State University Press.
Gallwey, T. J., & Drury, C. G. (1986). Task complexity in visual inspectio. Human
Factors, 28(5), 595-606.
Gibson, B. S., & Jiang, Y. (1998). Surprise! An Unexpected Color Singleton does not Capture Attention in Visual Search. Psychological Science, 9(3), 176-182.
Gramopadhye, A. K. Bhagwat, S., Kimbler, D., & Greenstein, J. (1998). The use of advanced technology for visual inspection training. Applied Ergonomics, 29(5),
361-375.
Gramopadhye, A. K., Drury, C. G., & Sharit, J. (1997). Feedback strategies for visual search in airframe structural inspection. International Journal of Industrial
Ergonomics, 19, 333-344.
Harris, D. H. & Chaney, F. B. (1969). Human Factors in Quality Assurance, New York: Wiley.
Klein, R., & Farrell, M. (1989). Search performance without eye movement.
Perception and Psychophysics, 46, 476-482.
Laemlaksakul, V., & Kaewkuekool, S. (2007). The effect of feedforward training to improve: Industrial Engineering and Engineering Management,
Long, G. M., & Rourke, D. A. (1989). Training effects the resolution of moving targets-dynamic visual acuity. Human Factors, 3, 443-452.
2007 IEEE International Conference on 2-4 Dec. 2007, 423-426.
Lubow, R. E. & Kaplan, O. (1997). Visual Search as a Function of Type of Prior Experience with Target and Distractor. Journal of Experimental Psychology:
Human Perception and Performance, 23(1), 14-24.
JIEM, 2010 – 3(1): 221-248 – Online ISSN: 2013-0953 Print ISSN: 2013-8423
McKernan, K. E., (1989). The Benefits of Prior Information to Visual Search for Multiple Faults, Unpublished Master’s Thesis, SUNY, Buffalo, Department of Industrial Engineering.
McLeod, P., Driver, J., & Crisp, J. (1988). Visual search for a conjunction of movement and form is parallel. Nature, 332, 154-155.
Meegan, D. V., & Tipper, S. P. (1999). Visual Search and Target-Directed Action.
Journal of Experimental Psychology: Human Perception and Performance, 25(5),
1347-1362.
Nalanagulaa D., Greensteinb J.S., & Gramopadhye A. K. (2006). Evaluation of the effect of feedforward training displays of search strategy on visual search performance. International Journal of Industrial Ergonomics, 36, 289–300.
Palmer, J., & McLean, J. (1995). Imperfect, unlimited-capacity, parallel search yields large set-size effects, Society for Mathematical Psychology.
Schoonard, J. W., Gould, J .D. & Miller, L. A. (1973). Studies of Visual Inspection.
Ergonomics, 16(4), 365-379.
Scialfa, C. T., & Joffe, K. M. (1998). Response times and eye movements in feature and conjunction search as a function of target eccentricity. Perception and
Psychophysics.
Scialfa, C. T., Thomas, D. M., & Joffe, K. M. (1994). Age differences in the useful field of view: An eye movement analysis. Optometry and Vision Science, 71, 736-742.
Sheehan, J. J., & Drury, C.G. (1971). The Analysis of Industrial Inspection. Applied
Ergonomics, 2, 74-78.
Sinclair, M. A. (1984). Ergonomics of quality control, Workshop document, International Conference on Occupation Ergonomics (Toronto).
Townsned, J. T. (1971). A note on the identification of parallel and serial processes.
JIEM, 2010 – 3(1): 221-248 – Online ISSN: 2013-0953 Print ISSN: 2013-8423
Townsned, J. T. (1990). Serial and parallel processing: Sometimes they look like Tweedledum and Tweedledee but they can (and should) be distinguished.
Psychological Science, 1, 46-54.
Treisman, A. (1980). A feature integration theory of attention. Cognitive
Psychology, 12, 97-136.
Treisman, A. (1991). Search, similarity, and integration of features between and within dimensions. Journal of Experimental Psychology: Human Perception and
Performance, 17, 652-676.
Treisman, A., & Gormican, S. (1988). Feature analysis in early vision: Evidence from search asymmetries. Psychological Review, 95, 15-48.
Treisman, A., Sykes, M., & Gelade, G. (1977). Selective attention and stimulus integration. Attention and Performance III, 280-292.
Treisman, A. M., & Gelade, G. (1980). A feature-integration theory of attention.
Cognitive Psychology, 12, 97-136.
Viviani, P., & Swensson, R. G. (1982). Saccadic eye movements to peripherally discriminated visual targets. Journal of Experimental Psychology: Human
Perception and Performance, 8, 113-126.
Vora J., Nair, S., Gramopadhye, A. K., Duchowsk, A. T., Melloy, B. J., & Kanki, B. (2002). Using virtual reality technology for aircraft visual inspection training: presence and comparison studies. Applied Ergonomics, 33 (6), 559-570.
West, C. K. (1981). The social and psychological distortion of Information, Chicago: Nelson.
Williams, D. E., Reingold, E. M., Moscovitch, M., & Behrmann, M. (1997). Patterns of eye movements during parallel and serial visual search tasks, 51(2), 151-164.
Wolfe, J. M. (1998). What can 1 million trails tell us about visual search?.
JIEM, 2010 – 3(1): 221-248 – Online ISSN: 2013-0953 Print ISSN: 2013-8423
Wolfe, J. M., Friedman-Hill, S. R., Steward, M. I., & O’Connell, K.M. (1992). The role of categorization in visual search for orientation. Journal of Experimental
Psychology: Human Perception and Performance, 18, 34-39.
©© Journal of Industrial Engineering and Management, 2010
Article's contents are provided on a Attribution-Non Commercial 3.0 Creative commons license. Readers are allowed to copy, distribute and communicate article's contents, provided the author's and Journal of Industrial Engineering and Management's names are included. It must not be used for commercial purposes. To see the complete