R E S E A R C H
Open Access
Novel
1
H low field nuclear magnetic resonance
applications for the field of biodiesel
Paula Berman
1, Adi Leshem
1, Oren Etziony
1, Ofer Levi
2, Yisrael Parmet
2, Michael Saunders
3and Zeev Wiesman
1*Abstract
Background:Biodiesel production has increased dramatically over the last decade, raising the need for new rapid and non-destructive analytical tools and technologies.1H Low Field Nuclear Magnetic Resonance (LF-NMR) applications, which offer great potential to the field of biodiesel, have been developed by the Phyto Lipid Biotechnology Lab research team in the last few years.
Results:Supervised and un-supervised chemometric tools are suggested for screening new alternative biodiesel feedstocks according to oil content and viscosity. The tools allowed assignment into viscosity groups of
biodiesel-petrodiesel samples whose viscosity is unknown, and uncovered biodiesel samples that have residues of unreacted acylglycerol and/or methanol, and poorly separated and cleaned glycerol and water. In the case of composite materials, relaxation time distribution, and cross-correlation methods were successfully applied to differentiate components. Continuous distributed methods were also applied to calculate the yield of the transesterification reaction, and thus monitor the progress of the common and in-situ transesterification reactions, offering a tool for optimization of reaction parameters.
Conclusions:Comprehensive applied tools are detailed for the characterization of new alternative biodiesel resources in their whole conformation, monitoring of the biodiesel transesterification reaction, and quality evaluation of the final product, using a non-invasive and non-destructive technology that is new to the biodiesel research area. A new integrated computational-experimental approach for analysis of1H LF-NMR relaxometry data is also presented, suggesting improved solution stability and peak resolution.
Keywords:1H low field nuclear magnetic resonance, Biodiesel, Biodiesel physical properties, Chemometrics, Laplace inversion, Transesterification
Background
Biodiesel is defined as mono-alkyl esters of long chain Fatty Acids (FAs), offering a viable alternative to petroleum-based diesel fuel. Biodiesel has become more attractive recently because of diminishing petroleum reserves and the environmental consequences of exhaust gases from petroleum-fueled engines. It is simple to use, biodegradable, nontoxic and essentially free of sulfur and aromatics. Since it can be manufactured using existing industrial production capacity, and used with conventional equipment, it provides substantial opportunity for immediately addressing energy
security issues [1]. As a consequence, biodiesel production grew in the last decade from 0.8 to 14.7 × 10⁹l [2].
Biodiesel is commonly produced by a chemical reaction named transesterification (TE), where a lipid is reacted with an alcohol in the presence of a catalyst. It can be derived from a wide range of lipid-containing materials, although more than 95% is currently produced from edible-grade oils [3]. Large-scale production of biodiesel from edible resources can lead to imbalance in the global food market. Thus, alternative high yield and high quality feedstocks are continuously researched. These include non-edible oilseeds such as castor [4,5] and jatropha [6]; algae [7]; and waste materials such as recycled oils [8], municipal [9,10] and winery [11] wastes.
The quality of the biodiesel produced is of paramount importance to its successful commercialization [12]. Its per-formance in a compression-ignition engine is determined * Correspondence:wiesman@bgu.ac.il
1The Phyto-Lipid Biotechnology Lab, Departments of Biotechnology, Energy and Environmental Engineering, Ben-Gurion University of the Negev, P.O. Box 653, Beer-Sheva 84105, Israel
Full list of author information is available at the end of the article
by the physical properties of the fuel attributed by the bio-diesel composition, which corresponds to the FA profile of the parent lipid [13,14]. Severe operational problems in-cluding engine deposits, filter clogging, and fuel deterior-ation can be caused by residues of unreacted lipids such as sterols, acylglycerols, phospholipids, and Free Fatty Acids (FFAs), or residues such as glycerol, alcohols, and water in the biodiesel [12]. Therefore, to maintain proper vehicle performance, official international standards were established that require analyses consisting of chromato-graphic, spectroscopic, physical properties-based, and wet chemical methods. These methods are destructive, time consuming, laborious and environmentally unfriendly.
1
H Low Field Nuclear Magnetic Resonance (LF-NMR) is a rapid non-destructive technology extensively used in the food, polymer, petroleum and pharmaceutical indus-tries. It is widely used in industrial quality control for the determination of solid-to-liquid and oil-to-water ra-tios in materials as diverse as oil-bearing rock, food emulsions and plant seeds [15].
The field of1H LF-NMR relaxometry is a powerful tool for identifying molecular species and to study their dy-namics even in complex materials. This relates to the measurement of relaxation constants as a consequence of interactions among nuclear spins and between them and their surroundings. Longitudinal magnetization returns to equilibrium following application of a radio frequency field because of energy transferred to the lattice, and transverse relaxation arises from spin-spin interactions following a 90° pulse. The time constants for longitudinal and trans-verse relaxations areT1andT2respectively.
Relaxation time distribution experiments range from simple and rapid one dimensional (1D) tests to more com-plicated multidimensional ones. 1D tests use constant intervals between pulses, allowing for either longitudinal or transverse relaxation to be evaluated, whereas in multi-dimensional experiments, the signal is measured as a func-tion of two or more independent variables, allowing the spin system to evolve under different relaxation mecha-nisms [16]. In biological samples, spins exist in a variety of different environments, giving rise to a distribution of re-laxation times in which the measured rere-laxation decay is a sum of contributions from all spins [17].
Most commonly applied 1D tools are based on either acquisition of the free induction decay signal following a 90° pulse, or pulse sequences such as the spin echo [18], pulsed field gradient spin echo [19], CPMG [20,21] or inversion/saturation recovery [22]. Only few of the appli-cations found in the literature, mainly for the food in-dustry, include measuring oil content in low moisture oilseeds [23-25], algae [26], and meat [27]; for solid fat content measurement [28]; water holding capacity in meat and fish, [29-31]; characterization of water in agro-food products [32]; molecular mobility in wheat starch
[33]; study of the denaturation of proteins in eggs and whey [34]; effect of formulation on liquid and solid fat ice cream [35]; prediction of viscosity, cetane number, and iodine value of oilseeds [36]; drug delivery [37]; and many others.
More recently, new two-dimensional (2D) relaxation time distribution pulse sequences have been suggested, including T1-T2 [16], T2-store-T2 [38] and T2-D [39].
Several of the applications published in the last decade include 2D relaxation/diffusion correlations in porous media [39-41]; determination of avocado maturity [42]; monitoring the effect of high pressure and microwave processing on the microscopic water distribution and starch chain dynamics in potato and starch [43]; investi-gation of the physiological changes associated with rip-ening and mealiness in apples [44]; peak assignment to cell components, including compartmentalized water, pectins, starch, protein, and hemicelluloses in carrots [45]; and peak assignment for exploratory purposes in other foodstuffs including eggs, fish, dairy products, salad cream, and cake [46].
The speed with which data is obtained and the com-plexity of the signal acquired can become overwhelming unless suitable methods for interpretation are used. Data analysis of relaxation time distribution experiments is traditionally performed in one of several ways:
a. By projecting the data into new coordinates that maximize the original variance. This can be applied only on a group of observations, as the model looks for commonalities in the original data. The main advantage is that the method imposes no mathematical constraints. This field is termed chemometrics and it comprises the application of multivariate statistics, mathematics, and
computational methods to chemical measurements to enhance the productivity of chemical
experimentation [47]. Chemometric methods include clustering techniques (to spot differences between samples, detection of outliers, and grouping) and regression models (for correlating NMR measurements to reference data) [48]. b. By assuming discrete multi-exponential behavior of
the data. Coefficients are extracted using nonlinear fitting models, and the coefficients can be used in prediction models [49-52].
c. By assuming a continuous distribution of
exponentials. Here a relaxation time distribution of exponential coefficients is achieved with
components appearing as peaks. This is an ill-posed Inverse Laplace Transform (ILT) problem. The common mathematical solution implemented today, for both 1D and 2D data, is based onL2-norm
The goal of this summary is to show the potential of ap-plying 1H LF-NMR technology to the field of biodiesel. We detail novel applications based on 1D (CPMG) and 2D (T1-T2) pulse sequences for (a) screening new
alterna-tive biodiesel resources in their whole conformation, (b) monitoring the biodiesel TE reaction, and (c) evaluating the quality of the final product. A new algorithm for the 1D ILT problem, suggested by our research team, is also presented. This new approach applies L1-norm
regularization to find sparse solutions, using a formulation suitable for the PDCO solver (Primal-Dual interior method for Convex Objectives) [56]. In comparison, the commonL2-norm (least squares) result has been found to
contribute to the broadening of peaks.
Results and discussion
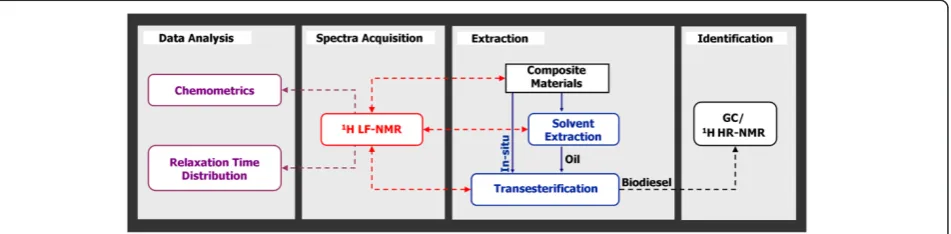
The methodology for performing the research presented hereby is detailed in Figure 1. This multidisciplinary re-search consists of applying different data analysis methods to correlate the information acquired with1H LF-NMR on different materials to standard chromatographic and spec-troscopic methods.
Selection of alternative biodiesel feedstocks
To successfully market a new biodiesel feedstock, the bio-diesel overall production process should be cost-effective to compete with petrodiesel prices. Zhang et al. [57] reported that 70–95% of the biodiesel production cost is the price of the feedstock itself. Therefore, high oil content sources are favored. In addition, biodiesel must meet inter-national quality standards, several of which are related to the FA composition of the parent oil, thus determined by choice of feedstock. Hence, oil content and physical prop-erties related to FA composition are important parameters in the successful commercialization of a new feedstock.
Oil content has long been measured using1H LF-NMR. In addition, biodiesel quality parameters were successfully predicted from oilseeds relaxation signals [36]. The main
component in dried oilseeds is the oil constituent; therefore the acquired1H LF-NMR signal can be directly related to oil quantity and quality. Different composite materials consisting of additional components such as fibers, com-partmentalized water and others require a more compre-hensive analysis of the relaxation signals using ILT analysis.
In the following section, we present two 1H LF-NMR tools that can be applied for finding new alternative bio-diesel feedstocks. The first involves simultaneous screening of oilseeds by viscosity and oil content using chemometric tools. The second involves assigning peaks to the different components in olives using 1D and 2D tools, and thus re-lates only to the desired components.
Simultaneous screening of oilseeds by viscosity and oil content using chemometrics
The standard relaxation time distribution method, for oil content measurement in oilseeds, consists of acquisi-tion of a single intensity signal and its correlaacquisi-tion to oil content, to construct a calibration curve according to the international standard [58]. Each type of oilseed re-quires a specific calibration curve, since different types of oilseed hold unique FA profiles and therefore result in unique slopes and intercepts. This procedure is relatively simple but has several weaknesses, including (a) loss of qualitative information, (b) lack of robustness, since uni-variate models cannot properly handle outliers that re-sult from abnormal signals or varied quality of oilseeds, and (c) applicability only to oilseeds whose calibration curve has already been established.
Screening of suitable biodiesel feedstocks often involves sampling extremely large batches of samples. Here a new protocol is suggested for qualitative and quantitative large-scale screening of oilseeds. A fast application that provides comprehensive information on observations will simplify the characterization and quantification of new and existing alternative biodiesel resources. This is very important to this field.
The protocol was demonstrated using the acquired 1D transverse relaxation data of nine oils, each approximately 1, 2, 3, and 4 ml, that were correlated against oil content. The different oil volumes were used to represent varying oil contents. Oils were chosen for the application because of the possibility of controlling oil content with constant FA content of each sample from the same oil source. Un-supervised data exploration was initially conducted using Principal Component Analysis (PCA). The oils used in this analysis are almond (ALM), canola (CAN), castor (CAS), linseed (LIN), mustard1 (MUS-A), mustard2 (MUS-B), olive (OLI), soy (SOY) and sunflower (SUN).
PCA score scatter plots of the first two Principal Com-ponents (PC1 and PC2) extracted using the covariance
matrice processed by the first value or without pre-processing, are described in Figure 2A and 2B. Figure 2A shows no information related to oil content, given that almost no differentiation was observable between the different volumes from the same type of oil. Since all the samples per type of oil were very closely clustered, the name of only one of the oil samples for each of the oils is shown on the plot, to facilitate its interpretation. Still,
PC2 revealed qualitative information, meaning high or
low values of PC2 correlated to high or low viscosities,
as shown in a previous study [59]. In that study, a PCA model was suggested for rapid large-scale screening of castor seeds according to viscosity. An excellent correl-ation was found there between viscosity andPC2
calcu-lated from the 1D transverse relaxation data, acquired on castor genotypes.
In Figure 2B on the other hand, bothPC1andPC2held
significant information regarding oil content. Fitting of the calculatedPC1andPC2for each of the individual oils
sep-arately yielded an excellent linear regression (without inter-cept). The slope extracted from each of these curves was
found to linearly correlate with the ln(T2) of the oils (y = −0.49ln(T2) + 2.54, R2=0.99; the Figure was added in an
additional file [see Additional file 1]). T2was the average value for each of the 4 samples per oil, calculated using monoexponential fitting.
Based on the unsupervised results shown, it was as-sumed that construction of an oil content (according to the oil weight) calibration including various types of oils would be possible using multivariate regression. Partial Least Squares (PLS) was then applied on the unpro-cessed covariance matrice. Training of the model was performed using three samples per oil, and the fourth was used for validation. The established model showed excellent prediction capability, as calculated on the val-idation set (RP2=0.99, Root Mean Squared Error of
Pre-diction (RMSEP) = 0.075 g, the Figure was added in an additional file [see Additional file 2]). This suggests that the PLS model considers the decay rate of the specific oil, and generates an oil content reading accordingly. This model met the initial goal of eliminating the need for constructing specific calibration curves for each oil quality composition. These are important findings, suggesting that both quantitative and qualitative information can be extracted using PCA for data exploration and PLS for prediction.
Selection of alternative biodiesel feedstocks according to chemical composition
As a first step in characterizing lipid components in com-posite materials using1H LF-NMR, for ultimately screen-ing new feedstocks, we chose olives as a test case. This work was performed in collaboration with Dr. Brian Hills from the Institute of Food Research (Norwich, UK).
A major opportunity within the olive oil production in-dustry is the exploitation of certain by-products obtained
during the processing of olives for oil, such as pomace and olive pits, which can be used as biofuels [60]. Olive fruits have been studied for many years from an analytical point of view. The olive fruit is an ovoidal drupe consisting of an epicarp (1.5-3.5% of the fruit weight), mesocarp (or pulp, 65-83%), and kernel (or stone, 13-30% of fruit weight). Its average chemical composition is water 50%, oil 22%, proteins 1.6%, sugar 19.1%, cellulose 5.8% and ash 1.5% [61].
In this study, 1D and 2D pulse sequences were used for signal acquisition of olive oil, a whole fresh olive fruit, olive stone, and dry whole olive fruit samples. 1D relax-ation time distribution using the WinDXP ILT software package, and 2D cross-correlation ILT software, were used for data analysis. Peaks were provisionally assigned to olive components by collating information from the different
samples, and according to published peak assignment on avocado, apples, and xylem and phloem of carrots, as de-scribed below. Real peaks were marked A-H and cross peaks were marked according to the two exchanging com-ponents (e.g. BF stands for proton exchange of peaks B and F).
1D relaxation time distribution The olive oil 1D peak distribution consists of peaks B and C (Figure 3A). Olive oil contains mostly triacylglycerols (98-99%); therefore, peaks B and C were assigned as oil peaks. These two oil peaks agree with the bi-exponential behavior of oil in oil-containing materials as previously suggested [25,50]. This result also coincided with previous peak assignment in avocado [42].
Figure 3Peaks assignment of the 1D relaxation time distributions of olive constituents.Continuous distribution of exponentials of (A) olive oil, (B) whole fresh olive, (C) whole dry olive, and (D) olive stone were calculated using the WinDXP ILT software package. Peaks in each Figure were assigned (A-F) to olive components by collating information from the different samples, and according to published peak
The 1D olive fruit sample contains four peaks in addition to the two oil peaks (Figure 3B). Interestingly, in the oil sample, peak C has a higher relative intensity than peak B, whereas in the fruit this ratio is flipped. As noted before, fresh olives consist of approximately 50% water. Since these components are the major peaks in the fruit sample, and based on previous peak assignment [44], it was assumed that they arise also from cytoplas-mic and extracellular water. This was validated using the dry whole olive sample (Figure 3C).
Peak A in Figure 3B was assigned as vacuolar water because of the high fluidity of water molecules in this organelle as suggested for apples [44]. Indeed, in a dis-sected olive sample, peak A changed into one of the major peaks (data not shown), probably because of free water released as a consequence of dissecting the olive flesh. Peak E did not appear in the dissected olive flesh sample. Its relative intensity in a dry olive sample was significantly reduced compared to the fresh sample, suggesting that water had been evaporated, though not entirely. Peak E was therefore assigned as a water com-ponent in the olive stone. The chemical composition of olive stones (% dry weight) according to Heredia et al. [62] consists almost entirely of fibers (80%), around 10% moisture, 5% oil and some other minor components. Based on this information, it is reasonable to assume that the peaks in the olive stone sample, with the lowest relative importance, are the oil components B and C, whereas peak D probably arises from a water component (Figure 3D).
Peak F in apples was assigned as water associated with the rigid components of the cell wall [44]. This however did not coincide with the relative intensity of this peak in the stone sample (Figure 3D), where it is the principal component. As previously stated, the major constituent compatible with this peak, is the lignocellulosic material, which frameworks the cell wall, with hemicellulose, cellu-lose and lignin as the main components. MacKay et al. [63] suggested that the primary cell wall molecules (not includ-ing water) can be divided into a practically rigid fraction consisting of all the cellulose and some of the hemicellu-lose molecules; and a higher mobility fraction consisting of pectic polysaccharide and some hemicellulosic molecules. At this point, it is difficult to determine whether peak F arises from these very fast relaxing molecules, or from water attached to them, and will be further discussed using 2D cross-correlation measurements.
2D cross-correlation Figures 4A-4D show the 2D cross-correlation relaxation time distributions analyses for the olive oil, whole fresh and dry olive fruit, and olive stone samples respectively. The previously assigned peaks A-F appear here on the diagonal whereT1≈T2. Here two
new peaks (marked G and H) appear off-diagonal in the
area whereT2<T1. These were assigned as the higher
mo-bility hemicellulosic fraction (Peak G) and the more rigid cellulosic constituent, as they are the major peaks in the stone sample (Figure 4D). This coincided with previous peak assignment in xylem and phloem of carrots [45]. A summary of the relaxation contribution assignment is presented in Table 1.
The advantage of using multidimensional cross-correl-ation methods is apparent from comparing Figures 3B and 4B. Components G and H have similar transverse relaxation times as peaks E and F, and therefore cannot be distinguished in a 1D representation. This is most emphasized for the stone sample as discussed before in the assignment of Peak F. In addition, cross-correlation methods can be used to study proton exchange, which is not discussed in this work.
Relaxation time distribution analysis and cross-correlation methods allow the identification of components in com-posite materials. These can be used to identify separately oil, fibers, compartmentalized water and more, to search for new biodiesel feedstocks. The application of these methods in combination with simple linear and/or multi-variate regression methods, can lead to the construction of intelligent and robust calibration curves and prediction models. The construction of an oil content calibration curve of olive mill pomace, using relaxation time distribu-tion analysis, was recently shown by our research team [64]. In this study only eight olive mill pomace samples were used. Full leave one out cross validation yielded R2=0.83.
Monitoring of the biodiesel TE reaction
The conditions and materials of the TE reaction may vary significantly according to the type of lipid substrate. The most common TE reaction is performed under alkaline conditions by reacting oil with methanol, because of its lower price compared to other alcohols. The alkali catalyst leads to a relatively fast conversion, while requiring only a moderate temperature. However, high yields are only achieved when the starting material is essentially free of moisture and consists of a low FFA content (<3%). Alter-natively, low grade substrates and/or non-acylglycerol lipids can be reacted using Brönsted acids. Yet, the reac-tion is usually carried out at higher temperatures and for longer periods [65].
potentially influence the quality of the following one, and of the final product.
The reactants in the TE reaction include the lipid sub-strate and alcohol, which is usually added in excess to drive the process forward. The desired product consists of high purity Fatty Acid Methyl Esters (FAMEs). However, residual glycerol, acylglycerol constituents (tri-, di- and mono-glycerides), alcohol, catalyst, water and others can often be found at diverse concentrations in the product, according to the reaction process. Therefore, assessment of the conversion of oil to biodiesel is required for moni-toring and control of the production process in order to meet international biodiesel standards.
Monitoring of the TE reaction and biodiesel product using relaxation time distribution experiments, requires as a first step assigning peaks in the analyzed relaxation time
distribution signals. Several of the components that par-ticipate in this reaction including soy oil, soy biodiesel, gly-cerol, water and methanol were sampled separately using
1
H LF-NMR. Data was analyzed using the WinDXP ILT software package, and the combined relaxation time distri-butions are shown in Figure 5. Each solution was normal-ized to its highest value for simplicity of comparison. Here, the position of every component on the relaxation time distribution can be explained by its chemical struc-ture. Water and methanol are polar, very mobile liquids, and thus have the largestT2values. The biodiesel and oil
samples consist of the same FA composition (biodiesel was produced from the analyzed oil). However, biodiesel consists of individual FAMEs (that have high freedom of movement and thus large T2) and oil, which consists
backbone) that have lower mobility andT2because of this
more rigid structure. Glycerol is a three-carbon molecule with three hydroxyl groups. As a result it has the lowest mobility andT2because of hydrogen bonding.
Figures 6A-6D show the analyzed relaxation time distri-butions acquired from mixtures (1:1 v/v) of biodiesel and oil, glycerol, water and methanol respectively (the relax-ation time distributions of the pure materials presented above are shown for reference). As expected from their chemical composition, the water and biodiesel-glycerol mixtures formed two immiscible and separated phases inside the test tube, while the biodiesel-oil and biodiesel-methanol consisted of a single phase. As can be seen, the position of the different peaks in Figures 6A-6C is constant also for composite samples, though the peaks in the oil-biodiesel mixture are difficult to resolve because
of overlapping of components and widening of peaks im-posed partly by the WinDXP ILT algorithm. In the biodiesel-methanol mixture (Figure 6D), the position of the biodiesel peak is shifted toward the methanol component probably because of solubility interactions between the two components. This suggests that if methanol (or other alco-hol) residues exist in the biodiesel; a shift is to be expected for the biodiesel peak in relation to its content.
Application of the new L1-norm regularization based
PDCO algorithm [56] to find sparse solutions (recently submitted article by our research group to Concepts in Magnetic Resonance A Journal) on the same biodiesel, glycerol, water, oil and methanol samples (Figure 7) showed better resolved relaxation time distributions and more accurate solutions. The PDCO analyzed relaxation time distributions of the oil and biodiesel samples reveal a larger number of peaks compared with the conven-tional results analyzed by the WinDXP ILT toolbox (Figure 5). As previously mentioned and as shown here, WinDXP analysis of oil reveals two overlapping peaks. Marigheto et al. [42] suggested that the peaks arise from molecules of differing mobility, such as the oleic and palmitic constituents, or from nonequivalent proton pools of different mobility, such as those on methyl and olefinic groups. In the current study, the PDCO algo-rithm reveals four resolved peaks instead of only two, suggesting promising unpublished information regarding identification of lipids constituents using relaxation time distribution experiments, and its supremacy as an ana-lytical tool. Assignment of peaks to the appropriate com-ponents will be performed in the near future using standard materials.
To monitor the conversion reaction of oils to biodiesel, samples were acquired at different times during TE of rape-seed oil, and measured using relaxation time distribution experiments to track the progression of this reaction until completion. To calculate the yield of TE from the relax-ation time distributions, a correlrelax-ation with the data ac-quired by 1H High Resolution (HR)-NMR following the procedure of Meher et al. [65] was established. In situ TE process of olive mill waste was also monitored using ation time distribution experiments by measuring the relax-ation signal of the pomace and biodiesel products following acid esterification, alkali TE and n-hexane extraction. Mon-itoring of this process led to successful optimization of re-action parameters.
Monitoring of the TE process and calculation of yield using
1
H LF-NMR
As previously shown, oil and biodiesel mixtures can be evaluated using relaxation time distribution experiments. This can also be applied to monitor the progression of the TE reaction and to calculate its yield. Accurate measurement of the biodiesel yield, and analysis of the Figure 5WinDXP ILT analyses of biodiesel (BIO), glycerol (GLY),
water (H2O), methanol (MeOH) and oil (OIL) samples.Data acquisition and analysis were performed separately for each material. Relaxation time distributions were calculated using the WinDXP ILT software package.Each relaxation time distribution was normalized to its highest value for simplicity of comparison.
Table 1 Peaks assignment of olives according to relaxation time distribution and cross correlation experiments
Description Peak
Vacuolar/free water A
Oil 1 and cytoplasmic water B
Oil 2 and extracellular water C
Pectin and extracellular water D
Water in fibers E
Cell wall water F
Hemicellulose (stone) G
final FAME product for the presence of acylglycerol, is of paramount importance for establishing its quality.
As a first step, two rapeseed oil biodiesels were pre-pared, each using 0.05% and 0.5% (w/w) KOH catalyst (samples A and B respectively). Yield of TE was calculated using 1H HR-NMR. Figures 8A and 8B show the 500 MHz1H HR-NMR spectra acquired for samples A and B. The integrals of the peaks used for the yield calculations, as well as glyceryl peaks are listed in Table 2. Peak num-bers are according to the numnum-bers shown on the Figures. As expected from the low catalyst concentration, the inte-gral of the glycerol peaks in sample A is larger, suggesting of high acylglycerol residues in the biodiesel. Consequently, samples A and B achieved yields of 54.7% and 93.3%
respectively. Still, the last did not meet international stan-dards (0.96% w/w total bound glycerol content, as mea-sured from the same sample using Gas Chromatograph (GC), by an accredited European biodiesel laboratory, ASG Analytik-Service Gesellschaft mbH, Germany).
regularization via PDCO. As Figure 8C shows for the PDCO solution, one of the oil peaks can now be distin-guished (intrinsicT2at approximately 220 ms).
This suggests that 1H LF-NMR is a simple and rapid tool for estimating acylglycerol content in biodiesel. It should be stated, however, that based on Figure 8D, it is not yet clear whether the limit of detection of the pro-posed method will allow detecting low acylglycerol resi-dues in biodiesels that don't meet international standards.
Several process and reaction monitoring applications, using1H LF-NMR either spectroscopically or using relax-ation analysis, have been described in the literature ([68-71] and references therein). More recently, Linck et al. [72] have shown the potential of applying a mobile LF1H NMR spectrometer for the analysis and monitoring of bio-diesel production. Cabeça et al. [73] suggested a method for off-line monitoring the biodiesel TE reaction using monoexponential fitting. In that study, monoexponential
T2 measurements were used to track the progression
of the reaction until completion. In the case, however, where residues of methanol remained in the sample, an in-crease inT2value was observed. This is consistent with the
previous result shown for a biodiesel-methanol mixture (Figure 6D). Likewise, glycerol residues would lead to a de-crease in the calculatedT2value, even though the reaction
may have been completed. Since monoexponential fitting does not provide information regarding individual constit-uents, rather an average estimation of allT2s in regards to
their content in the sample, the application of relaxation time distribution analysis using PDCO is hereby described. Using this approach, both at-line and off-line process mon-itoring can be performed, by tracking the disappearance of the oil peak in relation to the biodiesel peaks.
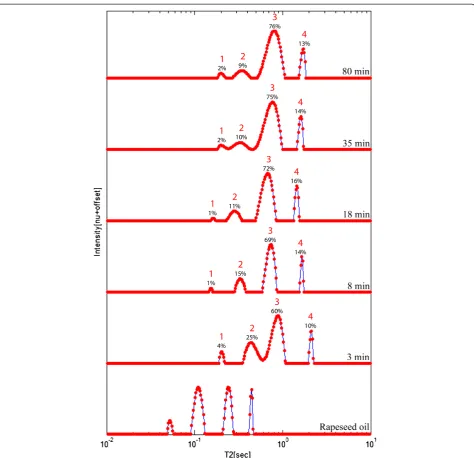
At-line monitoring of the TE process of rapeseed oil was performed by collecting aliquots from the reaction flask, and immediately measuring them using relaxation time dis-tribution, without further cleaning or tempering. Figure 9 shows the combined relaxation time distributions of five of the samples collected throughout the reaction, according to the order of collection, along with a rapeseed oil sample as reference. Since the TE reaction is performed at 50°C, and the1H LF-NMR instrument operates at 40°C, there was a small influence to the relaxation time distributions, that can be observed from the shifts in the position of the peaks. Despite of this change, four peaks are clearly resolved for each sample.
According to previous peak assignment, peak 3 was the main biodiesel component and peak 4 was attributed to methanol. Peaks 1 and 2 were previously related to oil components. As can be seen, their relative intensities reach equilibrium but are not reduced to zero intensity as would have been expected. In order to assign these peaks, the sample collected following 110 min from the begin-ning of the reaction, was allowed to separate into two phases for twenty minutes, and then an aliquot from the upper layer was measured using relaxation time distribu-tion. The analyzed distribution showed a result consistent with a biodiesel sample (without oil residues), as previ-ously shown in Figure 7. It was therefore assumed that peak 2 belong both to glycerol and residues of oil compo-nents. The shift in the position of the glycerol component, to a higher T2 value is caused due to its solubility in
methanol (relaxation time distribution of different methanol-glycerol mixtures is shown in Additional file 3). Peak 1 is more difficult to assign with certainty. At short reaction times it most probably originates from the oil component. However at longer periods this is not prob-able, especially since it disappears when measuring the upper layer alone. This remains for further study.
The kinetics of the reaction according to the oil to bio-diesel peaks area ((peak2/peak2+peak 3)*100%) is shown in Figure 10. As expected, the reaction progresses logarith-mically, and a plateau is achieved at approximately 100 min. This trend is consistent with the results presented by Rashid and Anwar [74] for the kinetics of a rapeseed oil TE reaction at the same conditions. However, since the oil and glycerol peaks cannot be distinguished, the maximum calculated yield achieved is about 90%. This suggests that using the methodology described, the actual yield of the reaction cannot be accurately determined. Assessment of actual yields requires at least one separation step. This takes time, and therefore cannot be performed at-line.
To examine the possibility of calculating yields using relaxation time distribution, correlation of the yield cal-culated according to the relaxation time distribution (predictor) to the yield of TE calculated using 1H HR-NMR (predicted) was performed. For this purpose, six Figure 7PDCO analyses of biodiesel (BIO), glycerol (GLY),
samples were collected while TE reaction of rapeseed oil was proceeding, and immediately placed on ice. Following phase separation, glycerol was drained and the biodiesel was cleaned. Three additional samples prepared using low catalyst concentration (0.05%, 0.1% and 0.15% w/w KOH) were also used in the correlation, in order to broaden the range of yields. Since the prepared samples were cleaned, no glycerol or methanol residues were shown in the relax-ation time distributions. The yield based on relaxrelax-ation
time distribution was therefore calculated from the oil to biodiesel peaks area.
This correlation yielded an excellent linear fit (y= 0.78x+ 20.50,R2= 0.99; the Figure was added in an additional file [see Additional file 4]). This suggests that the proposed method is a good tool for monitoring and calculating the yield of the TE reaction. Its disadvantage, however, is the time consuming cleaning process which makes this an off-line tool.
Figure 8Comparison of the NMR spectra and relaxation time distributions of two rapeseed biodiesel samples containing high and low acylglycerol residues.Data was acquired using (A)-(B)1H HR-NMR and (C)-(D)1H LF-NMR of two rapeseed biodiesel samples A and B prepared with 0.05 and 0.5% KOH catalyst respectively, to achieve high and low acylglycerol residues. Peak numbers on (A) and (B) correspond to the peaks assignment in Table 2. Relaxation time distribution data was calculated using the WinDXP tool package and PDCO.
Table 2 Peaks assignment and corresponding integrals of the1H HR-NMR spectra of samples A and B
Peak number Functional groupa Chemical shifta[ppm] Sample Abintegral [nu] Sample Bbintegral [nu]
1 -OCO-CH2- (Acyl group) 2.23-2.36 0.78 0.80
2 R-OCO-CH3(Methyl ester group) 3.7 0.64 1.12
3 -CH2OCOR (Glycerol group) 4.1-4.32 0.25 0.01
a
Peaks were assigned according to Meher et al. [65] and Guillén and Ruiz [67].
b
A combined tool is therefore suggested, were monitor-ing of the TE reaction is qualitatively performed at-line, until reaching equilibrium, and yield quantification is car-ried out off-line, following phase separation and cleaning of the upper layer.
Monitoring of the in situ TE process of pomace
Reutilization of bio-wastes as alternative energy holds the possibility of reducing their impact on the environ-ment, along with the potential to expand the currently
the reaction as well as with the separation of glycerol [65]. In order to carry out the in situ TE reaction, a preliminary acidic esterification step is required in which FFAs are transformed into FAMEs. If carried out for long periods, oil is additionally transesterified into biodiesel. This is en-ergy consuming because it is performed at a relatively high temperature (100°C), and thus not desirable. In the current study, the in situ process consisted of an acidic es-terification step, followed by alkali TE. As a final step, the solid pomace with methoxide sludge was washed with n-hexane to remove oil and FAME residues in order to achieve low oil content pomace.
Monitoring of this process is shown in Figures 11A-11D and 11E-11G for the analyzed relaxation time distribu-tions of the solid pomace and biodiesel products respect-ively, using the WinDXP ILT toolbox. Data was acquired at each step of the reaction. 1, 2, and 3 mark each of the reaction steps: acid esterification, alkali TE and n-hexane extraction.
Based on the previous peaks assignment in olives, the main constituents in the initial dry solid pomace sample consisted of oil (intrinsic peak at approximately 90 ms) and fibers (intrinsic peak at approximately 0.1 ms) com-ponents, as shown on Figure 11A. Following the esterifi-cation step, the area of these two types of components was changed, meaning the oil component was reduced while the fibers increased (Figure 11B). This suggested that not only FFAs were reacted following this step, but also oil was transesterified into FAMEs. This was assessed by analyzing the liquid product following this step (Figure 11E). Here a biodiesel peak was observed. In addition, another major component was detected, which was attributed to suspended solids in the sample because the liquid fraction was opaque in color. The increase in
the fibers peak area was attributed to the formation of more mobile constituents, following breaking down of fi-bers which could not be detected before because of their fast relaxation. As expected, an additional reduction in the relative content of the oil fraction was accomplished fol-lowing the alkali TE step (Figure 11C). Still additional optimization of these process parameters is required be-cause the reacted pomace contained substantial amounts of oil. The residual oil was successfully extracted using n-hexane as shown on Figure 11D. Monitoring of the liquid fraction following each step confirmed the successful pro-duction of biodiesel, and showed the presence of impur-ities in the product (Figures 11E-11G).
The achieved low oil content pomace, which is very rich in fibrous material, can be further used for produc-tion of bioethanol. In a collaborative work with Dr. Ely Morag (Designers Energy Ltd, Israel) and Prof. Edward A. Bayer (Weizmann Institute of Science, Israel), it was found that reducing the oil content in olive pomace, prior to cellulase enzymatic hydrolysis, showed signifi-cant increase of sugar release from the pomace cellulosic fraction. In addition, the acidic and alkali treatments de-scribed above for the in situ biodiesel production signifi-cantly supported the enzymatic pre-treating procedure. This suggests that relaxation time distribution experi-ments can be applied for monitoring the production of other biofuels, including bioethanol. Such a study is cur-rently being carried out.
In this work, monitoring of the in situ biodiesel TE process was performed qualitatively. However, develop-ment of calibration curves or the use of internal standards can reveal important quantitative information, including oil content, conversion yield, quantity of biodiesel pro-duced, and more. These applications are currently being developed by our team for optimization of the in situ TE process of olive pomace.
Quality assessment of the biodiesel product
As previously shown, relaxation time distribution experi-ments can be applied to calculate the yield of the TE reac-tion. This gives an approximation of residual acylglycerol content in the biodiesel, which is a qualitative indication of whether it meets international standards. Another qualitative aspect is the biodiesel FA composition, which affects several physical properties of the fuel. Several of the parameters specified in international biodiesel stan-dards are determined directly by choice of feedstock, according to their FA profile. Prestes et al. [36] showed that it is possible to predict several of these parameters by measuring transverse relaxation data of oilseeds, even without extracting and transesterifying the oil. However, evaluation of physical properties of the biodiesel product is also of paramount importance, especially for biodiesel and/or petrodiesel blends.
In this study, transverse relaxation data of six different types of biodiesels and nine petrodiesel-biodiesel mixture samples (BXX, where XX stands for the amount of castor biodiesel in the mixture) was acquired using LF-NMR. Hierarchical Cluster Analysis (HCA) was applied to ex-plore the relative distance and grouping of samples according to the pre-processed relaxation data. Biodiesel viscosities were calculated from their FA composition, as suggested by Allen et al. [13].
Biodiesel consists of a mixture of FAMEs in which each constituent contributes to the overall viscosity. Viscosity increases with chain length and with increasing degree of
saturation [75]. The main FAMEs and calculated viscos-ities are shown on Table 3 (observations are ordered by ascending calculated viscosities). Even though the viscosity of the BXX samples cannot be determined by GC, samples were assigned to viscosity groups based on the HCA den-drogram mixture.
Figure 12 shows the HCA dendrogram. Using a linkage distance threshold of 4000, four distinct groups (marked 1–4) were observed, that can be related to the viscosity of the samples. Linseed and soy biodiesels, rich in the poly-unsaturated, linoleic and linolenic acids, showed the low-est viscosities (3.60 and 3.99 mm2/s respectively) and were Figure 11Monitoring of the in-situ TE process of pomace.Samples were collected following (1) acid esterification (2) alkali TE, and
thus assigned to group 1. Group 2 was subdivided into two groups. The first included the olive and canola sam-ples (rich in the monounsaturated oleic acid, 4.25 and 4.45 mm2/s respectively) and B0-B10 mixtures. The second included the mustard sample (rich in erucic acid, 5.52 mm2/s) and B15-B30 mixtures. Erucic acid increases vis-cosity because of its larger chain length compared to the more common 18 carbon components. Group 3 comprised of only mixture samples (B50-B80). Even though their exact viscosity values are unknown, based on the mixing ratio they should have higher viscosity than B30 and lower than B100 (pure castor biodiesel). Therefore, the highest viscos-ity group 4 was assigned to castor biodiesel, having very high viscosity (13.76 mm2/s) imparted by intermolecular hydrogen bonds caused by ricinoleic acid.
The proposed methodology allows the assignment into viscosity groups of samples whose viscosity is unknown, simply by acquiring their transverse 1H LF-NMR signals
and analyzing them using chemometric tools like HCA and PCA. These methods can also be applied to find biodiesel samples that have residues of unreacted acylglycerol and/or methanol, and poorly separated and cleaned glycerol and water, provided a high quality biodiesel of the same source is used for comparison. All the aforementioned residues in-fluence the viscosity of the sample, and accordingly affect the acquired transverse relaxation signal.
An example is shown on thePC2score line plot
calcu-lated using PCA on the pre-processed transverse relaxation signals (Figure 13). In order to show the effect of residues on the position of samples in the score line plot, the follow-ing samples were used along with all the biodiesels de-scribed before: (a) four of the samples collected and used to calculate the yield of TE reaction (3, 6, 12 and 30 min), to demonstrate acylglycerol residues; (b) two biodiesel samples with low water content (BIO+H2O1 and BIO+H2O2 con-sist of 3.33% and 6.66% v/v water in rapeseed biodiesel re-spectively); and (c) two biodiesel samples with low methanol content (BIO+MeOH1 and BIO+MeOH2 consist of 3.33% and 6.66% v/v methanol in rapeseed biodiesel re-spectively). ThePC2scale of the plot was enlarged, in order
to focus on the area of interest, therefore the castor bio-diesel sample is not shown. Following the established cor-relation ofPC2and viscosity [59], it is clearly demonstrated,
that residues of water and/or methanol lead to lower than expected biodiesel viscosities, whereas high acylglycerol content lead to the opposite effect.
This tool allows to rapidly identify lower or higher vis-cosity samples than the one expected. More precisely, when using additionally samples whose viscosity is known (or estimated by their FAME profiles); it is possible to also approximate the viscosity value of the unknown samples, rather than simply assign them as higher or lower viscos-ities than the reference.
Conclusions
The novel1H LF-NMR applications presented offer great potential to the biodiesel industry for characterizing new alternative biodiesel resources in their whole conform-ation, monitoring the biodiesel TE reaction and evaluating
Table 3 FAME profiles according to GC and calculated viscosities of the six biodiesels produced
Samplea FAME compositionb[%] Calculated
viscosities [mm2/s] C16:0 C18:0 C18:1 C18:2 C18:3 C20:0 C20:1 C22:1 C18:1-OH
Linseed 5.6 4.6 18.2 15.4 56.1 - - - - 3.60
Soy 10.8 3.6 25.6 53.4 5.5 0.4 0.4 0.4 - 3.99
Canola 4.8 1.6 63.7 20.3 7.2 0.6 1.3 - - 4.25
Olive 10.6 2.8 77.3 7.4 0.6 0.4 - - - 4.45
Mustard 1.7 1.0 9.8 13.8 12.9 0.8 6.2 51.4 - 5.52
Castor 1.0 1.1 3.0 3.9 - - - - 91.1 13.76
a
Samples are ordered by ascending calculated viscosities.
b
Only major FAMEs are shown.
Figure 12Viscosity assessment of the biodiesel product using chemometrics.HCA dendrogram of six biodiesels (LIN: linseed, SOY: soy, CAN: canola, OLI: olive, MUS: mustard and CAS: castor) and nine petrodiesel-biodiesel mixture samples (BXX, where XX stands for the amount of castor biodiesel in the mixture) was calculated using the acquired transverse relaxation signals. A linkage distance threshold of 4000 yielded four groups which were assigned to
the quality of the final product. In addition, the new integrated computational-experimental approach for 1H LF-NMR relaxometry presented, suggests better resolved relaxation time distributions and more accurate solutions.
Materials and methods
Materials
CDCl3(99.8% + 0.05% v/v TMS) was purchased from
D-Chem Ltd., Israel. Glycerol was purchased in a local phar-macy (Ph Eur grade, Floris, Israel). All other chemicals and reagents used in this study were analytical grade. All oils were purchased from local suppliers. Biodiesels were prepared through a base catalyzed reaction using several of the purchased oils. Petrodiesel was purchased at a local gas station.
Fresh olive fruits were harvested from a plot located in the central Negev, Israel. The whole dry olive sample was oven dried at 70°C for 72 h to remove excess mois-ture. Olive mill pomace was collected from Darawsha olive press (Iksal, Israel).
1
H LF-NMR signal acquisition
Relaxation time distribution experiments for peaks as-signment of the olive oil and olive stone samples were performed on a DRX23 bench-top pulsed NMR analyzer (Resonance Instruments, Witney, UK) operating at 25°C, equipped with a permanent magnet and a 10 mm probe head operating at 23.4 MHz. Prior to measurement,
samples were equilibrated at 25°C for 1 h. All other 1H LF-NMR measurements were performed on a Maran bench-top pulsed NMR analyzer (Resonance Instru-ments, Witney, UK) operating at 40°C, equipped with a permanent magnet and different diameter probe heads, operating at 23.4 MHz. Prior to measurement, samples were equilibrated at 40°C for 1 h.
1D relaxometry experiments were performed using a CPMG pulse sequence. This multiple sequence consists of applying a single 90°; pulse followed by multiple con-secutive 180° pulses. This allows measuring transverse relaxation, which results from spin-spin interactions.
2D cross-correlation experiments were performed by a
T1-T2sequence, where an inversion recovery step [180°–t1]
is inserted in front of the CPMG sequence [16]. Here the
T1dimension is acquired by repeating the sequence a
deter-mined number of steps, where the spacet1is varied
loga-rithmically between runs. The t1 period is dominated by
longitudinal relaxation, including possible longitudinal cross relaxation processes; while thet2period is dominated
by transverse relaxation processes [15].
All relaxation time distribution experiments on solid and liquid samples, were analyzed without further prepar-ation. Samples were inserted in glass NMR tubes as whole, without using solvents or further crushing. Parameters in each pulse sequence were tailored according to the type of experiment and material. Following data acquisition the signal was phase rotated and only the main channel was used for the analyses.
Data analysis Chemometrics
In this work, chemometric data analysis tools included PCA for unsupervised data exploration and PLS for creat-ing multidimensional regression curve fittcreat-ing [76-78]. Both these methods extract PCs and loadings to maximize the original variance and reduce dimensionality; hence they describe the data in a more condensed form. The PCs are mutually orthogonal and their extraction is such that the first PC holds the maximum variance, the second holds the second-maximum variance, and so on.
HCA was applied for clustering. HCA is an unsupervised clustering technique that examines the interpoint distances between all samples in row space and represents them in a dendrogram. To generate the dendrogram, a common ap-proach is to initially treat each sample as a cluster and join closest clusters together. The process is repeated until only one group remains [77]. The amalgamation rule used was complete linkage and distances between clusters were cal-culated according to Euclidean distances. Analysis of re-sults was carried out using the distance dendrogram.
All chemometric methods were computed using STATISTICA software (ver. 11.0, StatSoft). PCA and PLS were applied using the NIPALS algorithm on the covari-ance matrices. Transverse relaxation data was either used as acquired, or pre-processed by dividing the entire signal of each sample by its first (and highest) intensity.
Goodness of fit for the PLS regression model was de-termined using the validation set. RMSEP was calculated using Eq. (1):
RMSEP¼
ffiffiffiffiffiffiffiffiffiffiffiffiffiffiffiffiffiffiffiffiffiffiffiffiffiffiffiffiffiffiffiffiffiffiffiffiffiffiffiffiffiffiffiffiffiffiffiffiffiffiffiffiffiffiffiffi
Xn
i¼1
xi;predictedxi;calculated
2 n v u u u t
ð1Þ
wherenis the number of observations.
Monoexponential and continuous distribution fitting of 1D relaxation signals
Monoexponential fitting was performed with the WinFit software package (Oxford Instruments, UK).
Conversion of the relaxation signal into a continuous distribution of relaxation components is performed using Eq. (2), where the probability densityf(T2) is calculated
ap-plying ILT, s(t) is the relaxation signal acquired with 1H LF-NMR at time t,T2are the time constants, andE(t) is
the measurements error:
s tð Þ ¼ Z
et=T2f T
2
ð ÞdT2þE tð Þ: ð2Þ
The most common numerical method implemented today for dealing with ill-posed problems of this kind is based on L2-norm regularization, where Eq. (2) is
ap-proximated by a discretized matrix form, and minimized
according to theL2-norm expression:
f ¼argmin sk Kfk22þλk kf 22;
f≥0
ð3Þ
whereKis the discrete Laplace transform, andλis theL2
weight. This type of regularization, however, can signifi-cantly distort the solution by contributing to the broaden-ing of peaks.
In this work, we applied a novel numerical optimization method developed by our research team for analyzing the
1
H LF-NMR relaxometry data. Full description of the al-gorithm is described in an article recently (2012) submit-ted to Concepts in Magnetic Resonance A Journal. The new method applies the PDCO solver that can be adjusted to solve the inverse problem with nonnegativity con-straints and an L1 regularization term that stabilizes the
solution process without introducing the typical L2 peak
broadening. The underlying principle is that all structured signals have sparse representation in an appropriate co-ordinate system, and using such a system/dictionary typic-ally results in better solutions with a relatively low level of noise.
The mathematical formulation of our proposed method is the linearly constrained convex optimization problem
min
f;c;rλ1k kc 1þ
1 2λ2k kc
2 2þ
1 2k kr
2 2
s:t:Kf þr¼s;
f þBc¼0; f≥0;
ð4Þ
whereKis the discrete Laplace transform,fis the unknown spectrum vector,sis the measurements vector,ris the re-sidual vector, andBis a sparsifying dictionary.
L2calculations of relaxation time distribution were
de-convoluted as a continuous distribution of relaxation times with the WinDXP ILT software package (Distrib-uted ExPonential Analysis, Oxford Instruments, UK).
Continuous distribution fitting of 2D cross correlation relaxometry
2D cross correlation relaxometry signals were analyzed by 2D-ILT as described in [16], using an in-house program written in MATLAB as detailed by Hills et al. [15]. Briefly, the acquired 2D array of CPMG echo trains s(t1,t2) is
given as
s tð1;t2Þ ¼∬ 12et1=T1
et2=T2f T
1;T2
ð ÞdT1dT2
þE tð1;t2Þ;
ð5Þ
where s(t1,t2) is the relaxation signal acquired at t1and t2
times, and the function f(T1,T2) corresponds to the
Extraction Oil extraction
For non-quantitative oil extraction, oil-containing materials were crushed manually in a mortar and incubated over-night with n-hexane in an orbital shaker at 25°C. The oil and n-hexane solution was then evaporated under a mild vacuum with a rotary evaporator. In cases where large vol-umes of oil were required (>10 ml), a cold-pressed extruder was used (Komet CA 59G, Monchengladbach, Germany).
Oil extraction for oil content measurements was carried out using a modified procedure according to the AOCS of-ficial method [79], using a soxhlet apparatus and n-hexane. Briefly, about 2 g of oil containing materials were manually crushed with a mortar and positioned in the extraction chamber for 24 h. The oil and n-hexane mixture was then evaporated under mild vacuum to obtain pure oil.
Alkali TE
Prior to biodiesel production, oils were heated to 80°C for 1 h to evaporate water, and then allowed to cool down to room temperature. Biodiesels were prepared in a batch la-boratory scale TE process with methanol and KOH. Briefly, a potassium hydroxide solution was freshly prepared by mixing methanol (1:6 oil to methanol mol/mol) with KOH (100 g kg-1of the oil). The reaction was carried out for 1 h under reflux at 50°C with constant stirring and then allowed to cool down to room temperature. The mixture was then transferred to a separating funnel and allowed to stand for approximately 1 h. The bottom layer (glycerol, methanol and most of the catalyst) was drained out. The upper layer (FAMEs, some methanol and traces of the catalyst) was cleaned thoroughly by washing 5 times with warm (~50°C) de-ionized water. The solution was then heated to 80°C for 30 min until cleared.
In situ TE of olive mill waste pomace
Prior to in situ TE reaction samples were oven dried at 70°C for 72 h to remove excess moisture. The dry pomace was then ground using a Hsiangtai electric grinder (Taipei Hsien, Taiwan) to provide more surface area for the reaction.
Because of high FFA content (2-13% FFA according to a titration procedure), pomace was first esterified using H2SO4. Briefly, 100 g of dry and grounded pomace were
reacted under reflux and stirring, with 2 ml H2SO4(0.094
M) and 400 ml methanol. The reaction was carried out for 1 h at 65°C. An alkali TE reaction was then performed as described before. Prior to reaction, the remaining sulfuric acid was neutralized using a KOH in methanol solution (4.8% w/w). Eventually, 200 ml n-hexane was added to ex-tract the biodiesel. The final product was separated into solid and liquid fractions by filtration. The liquid fraction was transferred to a separating funnel and allowed to set-tle for 30 min. The bottom layer consisting of methanol,
residual catalyst and soluble sub-millimeter particles was removed, and the upper layer consisting of the biodiesel produced and n-hexane was washed several times with warm (~50°C) de-ionized water. The biodiesel produced was eventually recovered using a rotary evaporator, and heated to 80°C for 60 min until cleared.
Identification GC
GC was used for identification and quantification of FAMEs. The FA composition was used to calculate the kinematic viscosity of biodiesels as described by Allen et al. [13] using Eq. (6).μiandμ0are the kinematic
viscos-ities at 40°C of each FA and biodiesel, respectively;yiis the
mass fraction of each FA. Neat FA viscosities, given as FAMEs, were taken from [75]. The viscosity of arachidic acid (20:0) was assumed to be similar to that of stearic acid (18:0), as suggested by Allen et al. [13].
lnμ0¼X
n
i¼1
yilnμi ð6Þ
GC analyses were conducted on a Varian 3400 apparatus (Palo Alto, CA, USA) equipped with a flame ionization de-tector and a Stabilwax-DA capillary column (RESTEK, Bellefonte, US; Dimensions: 15 m × 0.32 mm × 0.25μm).
1
H HR-NMR
1
H HR-NMR analyses were conducted on a Bruker DMX-500 NMR spectrometer (Bruker, Germany) operating at 500 MHz.1H HR-NMR was used to monitor acylglycerol residues in biodiesel. Prior to measurement, samples were dissolved in CDCl3.
The yield (C) of TE reaction was calculated according to Eq. (7), whereAMEis the integrated signal at 3.7 ppm
cor-responding to methyl protons in methyl esters; and ACH2
is the integrated signal at 2.3 ppm due to methylene pro-tons adjacent to the ester group in triglycerides [65].
C¼1002AME 3ACH2
ð7Þ
Additional files
Additional file 1:Correlation of the slope and T2of the 9 different oils.Slopes were calculated by fitting the extractedPC1andPC2of each of the individual oils separately.T2was the average value for each of the 4 samples per oil, calculated using monoexponential fitting.
Additional file 2:Correlation of measuredvs.calculated oil content of the nine different oils through PLS.The correlation was performed on the validation set.
Additional file 4:Correlation of the yield calculated from1H LF-NMR to that of1H HR-NMR.The yield based on relaxation time distribution was calculated from the oil to biodiesel peaks area. The samples used for the correlation include six samples collected while TE reaction of rapeseed oil was proceeding, following separation and cleaning, and three additional samples prepared using low catalyst concentration (0.05%, 0.1% and 0.15% w/w KOH).
Abbreviations
1D:One dimensional; 2D: Two dimensional; CP: Cross peak; CPMG: Carr, Purcell, Meiboom and Gill; FA: Fatty acid; FFA: Free fatty acid; GC: Gas chromatograph; HCA: Hierarchal cluster analysis; HR-NMR: High resolution nuclear magnetic resonance; ILT: Inverse laplace transform; LF-NMR: Low field nuclear magnetic resonance; PC: Principal component; PCA: Principal component analysis; PDCO: Primal-dual interior method for convex objectives; PLS: Partial least squares; RMSEP: Root mean squared error of prediction; TE: Transesterification.
Competing interests
The authors declare that they have no competing interests.
Authors’contributions
PB designed and performed most of the experiments, analyzed results, contributed in the establishment and validation of the new PDCO algorithm, and drafted the manuscript. AL performed the monitoring of the TE process and calculation of yield using relaxation time distribution experiments. OE performed and optimized the monitoring of the in situ TE process of pomace using relaxation time distribution experiments. OL, YP and MS formulated, designed and established the PDCO algorithm. ZW led and coordinated the overall project, contributed to the development of the experimental design and proofread the manuscript. All authors read and approved the final manuscript.
Acknowledgements
PB acknowledges support from the Women in Science scholarship of the Israel Ministry of Science and Technology. AL and OE acknowledge support from the Israeli Ministry of Energy and Water Resources scholarships. The authors would like to thank Ormat Industries for the donation of the1H LF-NMR system, and the Phyto-Lipid Biotechnology Lab (PLBL) members at Ben Gurion University of the Negev, for their contribution to this work. We also thank four anonymous reviewers for their constructive criticism, and Dr. Thierry Guiheneuf, principal magnetic resonance technical specialist at Oxford Instruments (UK), for the very helpful discussions.
Author details
1The Phyto-Lipid Biotechnology Lab, Departments of Biotechnology, Energy and Environmental Engineering, Ben-Gurion University of the Negev, P.O. Box 653, Beer-Sheva 84105, Israel.2Department of Industrial Engineering and Management, Ben-Gurion University of the Negev, P.O. Box 653, Beer-Sheva 84105, Israel.3Department of Management Science and Engineering, Stanford University, Stanford, CA, USA.
Received: 17 November 2012 Accepted: 22 March 2013 Published: 16 April 2013
References
1. Bhardwaj HL:Utilizing locally-produced canola to manufacture biodiesel. InProceedings of the Sixth National Symposium on Creating Markets for Economic Development of New Crops and New Uses: 14-18 October 2006; San Diego, California.Edited by Janick J, Whipkey A. Alexandria: ASHS Press; 2007:43–46.
2. Sorda G, Banse M, Kemfert C:An overview of biofuel policies across the world.Energ Policy2010,38:6977–6988.
3. Gui MM, Lee KT, Bhatia S:Feasibility of edible oil vs. non-edible oil vs. waste edible oil as biodiesel feedstock.Energy2008,33:1646–1653. 4. Conceicao MM, Candeia RA, Silva FC, Bezerrab AF, Fernandes VJ, Souza AG:
Thermoanalytical characterization of castor oil biodiesel.Renew Sust Energ Rev2007,11:964–975.
5. Berman P, Nizri S, Wiesman Z:Castor oil biodiesel and its blends as alternative fuel.Biomass Bioenerg2011,35:2861–2866.
6. Openshaw K:A review of Jatropha curcas: an oil plant of unfulfilled promise.Biomass Bioenerg2000,19:1–15.
7. Hossain ABMS, Salleh A, Boyce AN, Chowdhury P, Naqiuddin M:Biodiesel fuel production from algae as renewable energy.Am J Biochem Biotechnol2008,4:250–254.
8. Canakci M, Van Gerpen J:Biodiesel production from oils and fats with high free fatty acids.TRANS ASAE2001,44:1429–1436.
9. Dufreche S, Hernandez R, French T, Sparks D, Zappi M, Alley E:Extraction of lipids from municipal wastewater plant microorganisms for production of biodiesel.J Am Oil Chem Soc2007,84:181–187.
10. Willson RM, Wiesman Z, Brenner A:Analyzing alternative bio-waste feedstocks for potential biodiesel production using time domain (TD)-NMR.Waste Manage2010,30:1881–1888.
11. Fernández CM, Ramos MJ, Perez A, Rodriguez JF:Production of biodiesel from winery waste: extraction, refining, and transesterification of grape seed oil.Bioresource Technol2010,101:7019–7024.
12. Knothe G:Analyzing biodiesel: standards and other methods.J Am Oil Chem Soc2006,83:823–833.
13. Allen CAW, Watts KC, Ackman RG, Pegg MJ:Predicting the viscosity of biodiesel fuels from their fatty acid ester composition.Fuel1999,
78:1319–1326.
14. Knothe G, Steidley KR:Kinematic viscosity of biodiesel fuel components and related compounds. Influence of compound structure and comparison to petrodiesel fuel components.Fuel2005,84:1059–1065. 15. Hills B, Benamira S, Marigheto N, Wright K:T1-T2correlation analysis of
complex foods.Appl Magn Reson2004,26:543–560.
16. Song YQ, Venkataramanan L, Hürlimann MD, Flaum M, Frulla P, Straley C: T1–T2correlation spectra obtained using a fast two dimensional Laplace inversion.J Magn Reson2002,154:261–268.
17. Kroeker RM, Henkelman RM:Analysis of biological NMR relaxation data with continuous distributions of relaxation times.J Magn Reson1986,
69:218–235.
18. Hahn EL:Spin echoes.Phys Rev1950,80:580–594.
19. Stejskal EO, Tanner JE:Spin diffusion measurements: SE in the presence of a time-dependent field gradient.J Chem Phys1965,42:288–292. 20. Carr HY, Purcell EM:Effects of diffusion on free precession in nuclear
magnetic resonance experiments.Phys Rev1954,94:630–638. 21. Meiboom S, Gill D:Modified spin-echo method for measuring nuclear
relaxation times.Rev Sci Instrum1958,29:688–691.
22. Abragam A:The Principles of Nuclear Magnetism.Clarendon: Oxford University Press; 1961.
23. Gambhir PN:Application of low-resolution pulsed NMR to the determination of oil and moisture in oilseeds.Trends Food Sci Tech1992,
3:191–196.
24. Rubel G:Simultaneous determination of oil and water contents in different oilseeds by pulsed nuclear magnetic resonance.J Am Oil Chem Soc1994,71:1057–1062.
25. Pedersen HT, Munck L, Engelsen SB:Low-field1H nuclear magnetic
resonance and chemometrics combined for simultaneous determination of water, oil, and protein contents in oilseeds.J Am Oil Chem Soc2000,
77:1069–1077.
26. Gao C, Xiong W, Zhang Y, Yuan W, Wu Q:Rapid quantitation of lipid in microalgae by time-domain nuclear magnetic resonance.J Microbiol Meth2008,75:437–440.
27. Correa CC, Forato LA, Colnago LA:High-throughput non-destructive nuclear magnetic resonance method to measure intramuscular fat content in beef.Anal Bioanal Chem2009,393:1357–1360.
28. Bosin WA, Marmor RA:The determination of the solids content of fats and oils by nuclear magnetic resonance.J Am Oil Chem Soc1968,
45:335–337.
29. Jepsen SM, Pedersen HT, Engelsen SB:Application of chemometrics to low-field1H NMR relaxation data of intact fish flesh.J Sci Food Agr1999,
79:1793–1802.
30. Bertram HC, Andersen HJ, Karlsson AH:Comparative study of low-field NMR relaxation measurements and two traditional methods in the
determination of water holding capacity of pork.Meat Sci2001,57:125–132. 31. Bertram HC, Donstrup S, Karlsson AH, Andersen HJ:Continuous distribution
analysis ofT2relaxation in meat- an approach in the determination of water-holding capacity.Meat Sci2002,60:279–285.