Cross-Sectional Variation in Stock Price Reaction to
Bond Rating Changes: Evidence from India
Sanjay Sehgal
Professor, Department of Financial Studies
South Campus, University of Delhi
Benito Juarez Road, Dhaula Kuan, Delhi, India
E-mail: [email protected]
Shruti Mathur (Corresponding Author)
Assistant Professor, Sri Venkateswara College, University of Delhi
Benito Juarez Road, Dhaula Kuan, Delhi, India
E-mail: [email protected]
Received: July 12, 2013 Accepted: September 7, 2013 Published: December 1, 2013
doi:10.5296/ajfa.v5i2.3998 URL: http://dx.doi.org/10.5296/ajfa.v5i2.3998
Abstract
Keywords: Bond Ratings, Stock Price Reaction, Wealth Redistribution and Signalling Effect, Firm Characteristics, Event Study Analysis
1. Introduction
Credit rating agencies play a very vital role in the financial markets by providing an opinion about the ‘quality’ or ‘creditworthiness’ of a particular debt instrument to the investors. The ratings define the default risk for the bond issue over its life. While the investors gain from this assessment, it is claimed that the firms also benefit because ratings and subsequent rating changes are an effective means of conveying confidential inside information to the investors without revealing anything to the competitors (Kliger and Sarig, 2000; Bannier and Hirsch, 2010). However, recently the rating agencies have been severely criticized. The lack of prompt response by the rating agencies during the East Asian Financial Crisis (1997), the failures of Enron (2001), Worldcom (2002) and Subprime Mortgage crisis (2008) have put a question mark on their reliability and credibility.
The issue regarding the informational content of the ratings has been debated. One school of thought believes that ratings only lower the borrowing costs but do not tell anything new (Wakeman, 1990). The agency’s rating change action is based on publicly available information and lags the event. Thus, the announcement of bond rating changes would not affect market prices, assuming the capital markets are efficient in semi-strong form. Many studies support the premise that bond rating changes do not provide new information (Pinches & Singleton, 1978; Creighton, Gower and Richards, 2007; Mohindroo, 2008).
On the other hand, the credit rating agencies claim to possess superior information about the company which is used by them for arriving at their ratings (Goh and Ederington, 1993; Ederington and Yawitz, 1987). Therefore, any change in the ratings would affect security prices.
Again, the exact nature of relationship between rating changes and stock returns needs to be understood. There are two main theories which explain the impact of rating change announcements by the credit rating agency on stock prices. These are -Information
Asymmetry and Signalling Hypothesis and Wealth Redistribution Hypothesis (Romero
and Fernández, 2007). The signalling hypothesis suggests that a rating change provides additional information to the market about total value of the firm. A rating change may be seen as a signal indicating future earnings and cash flows of the issuer. Hence, a rating downgrade is associated with a decline in stock prices (Hand, Holthausen and Leftwich, 1992; Elayan, Maris and Young, 1996; Hite and Warga, 1997; Barron, Clare and Thomas, 1997; Dichev and Piotrosky, 2001; Choy, Gray and Ragunathan, 2006; Gropp and Richards, 2001; Benjamin, 2008; Avramov et al. 2009; Chakravarty, Chiyachantana and Lee, 2009; Lal and Mitra, 2011) while an upgrade (or placement on a watch with positive indications) is associated with rise in stock prices (Barron, Clare and Thomas, 1997; Gropp and Richards, 2001; Chakravarty, Chiyachantana and Lee, 2009).
lead to a decrease in stock prices. Holthausen and Leftwich (1986) and Zaima and McCarthy (1988) also suggest that if equity shareholders are viewed as holding an option on the value of the firm with an exercise price equal to the par value of the firm's debt, then an increase in the variance of the firm's cash flows would redistribute the wealth from bondholders to stockholders. The higher the volatility, the more the risk and thus the option pricing model for valuation becomes more relevant. Results obtained by Goh and Ederington (1993); Bhoot (1995) and Romero and Fernández (2007) support wealth redistribution hypothesis.
The signalling and wealth redistribution effects work in opposite direction and may fully or partly offset each other.
Prior literature also shows that the price responsiveness to downgrades is more pronounced than upgrades. This confirms the asymmetric nature of relationship between bond rating changes and stock returns.
Another notable issue is whether all the firms react in a similar manner to the information provided by the rating changes. There may be a differential response to new information in case of companies for which there is little or infrequent information compared to companies which are always in news. The former are much harder to value and arbitrage. For instance, small size, low price to book value (as a measure of relative firm distress as suggested by Chan and Chen (1991)), low liquidity, high asset intangibility, high leverage and low profitability firms are expected to exhibit stronger price reaction to bond rating information, owing to poor disclosures, lower investment analyst and media coverage, higher cost of trading, greater degree of uncertainty in estimating their cash flows and a greater likelihood of earnings management. Dichev and Piotroski (2001) and Creighton, Gower and Richards (2007) reported stronger price reaction for small firms. Avramov et al. (2009) ran cross-sectional regressions of monthly individual stock returns on credit rating and other firm characteristics including book value to market value ratio but did not find it to significantly affect the returns. Cornell, Landsman and Shapiro (1989) found that a firm’s stock price response to bond rating variations depends on the net intangible assets of the firm. Kliger and Sarig (2000) show that the bond price reaction to rating change was positively affected by the firm’s leverage. In contrast, Goh and Ederington (1993) report that downgrades arising due to a change in the leverage of the firm did not affect the prices of stocks significantly. The actual direction of the impact on returns depends on whether earnings or leverage or both are a surprise.
and Ederington, 1999).
Another variable shaping the response of share prices to the rating change announcements is the magnitude of rating change i.e. the number of grades or levels by which the rating is changed. Cornell, Landsman and Shapiro (1989) and Hand, Holthausen and Leftwich (1992) found that the number of rating grades changed on rating revision has a significant influence on returns. A related issue is whether the investors react more strongly where the change in bond rating is from investment to speculative grade in case of downgrades. Holthausen and Leftwich (1986); Hite and Warga (1997); Creighton, Gower and Richards (2007); Benjamin (2008) and Lal and Mitra (2011) found that downgrades resulting in change in category of bond from investment to speculative grade extract a larger price response than any other downgrades. Similarly, it is expected that where the bond ratings are in the speculative grade the shareholders may respond more intensely due to higher risk of default of such bonds (Goh and Ederington, 1999). Another factor under consideration is the influence of bad economic conditions on the post – event abnormal returns in case of rating changes (Goh and Ederington, 1999). The time frame in this study includes the period when the investor sentiments were negative due to the sub-prime mortgage crisis. In such times, the investors expect bad news like the announcement of downgrades. They also under react to positive news like announcement of upgrades though there is an element of surprise. Moreover, the degree of risk aversion increases in recession, so the price reactions are expected to be stronger. This paper also considers the influence of all such factors on the price response of firm – characteristic based portfolios (size, P/B, trading volume, leverage, intangibility and profitability) to bond rating changes.
A review of the past research shows that although a lot of studies on the changes in ratings and their relationship with stock returns have been conducted abroad; there is little research on the subject in India. The limited literature which exists concentrates more on the comparison and analysis of rating methodologies and the performance of various rating agencies (Duggal, 1992; Goswami and Venkatesh, 1999; Raghunathan and Verma, 1992; Bajaj, 1998; Sehgal and Arora, 2004; Kaur and Kaur, 2011). Although some studies do cover the rating changes, but their impact on security prices is not examined (Bajaj, 1998; Sehgal & Arora, 2004). Only a few studies explore this relationship in the Indian context (Mohindroo, 2008; Lal and Mitra, 2011). Moreover, other important areas such as the effect of firm characteristics on the relationship between bond rating changes and stock return behaviour have not been studied. The impact of factors like anticipation, magnitude of rating change, transition to, from or within speculative grade and business cycle on stock returns after rating change in the Indian market is also largely unexamined. Thus, a serious gap exists in the existing literature on credit rating for the Indian environment. The present study attempts to fill this important research gap in bond market literature.
post – event abnormal returns implying surprise or importance element in case of upgrades and downgrades and firm characteristic based portfolios. It also examines whether factors like magnitude of rating change, transition to, from or within speculative grade and business cycle influence post – event abnormal returns.
The paper is divided into 5 sections including the present one. Section 2 describes data and their sources, section 3 deals with methodological issues. The empirical results are discussed in section 4, while the last section provides summary and conclusions.
2. Data
The data about the bond rating changes was collected from the websites of the two main rating agencies in India namely – CRISIL and ICRA. A list of all the events where a company’s bonds had been upgraded or downgraded between November 2003 and February 2011 was made. This consisted of a total of 227 bond rating changes out of which 117 were downgrades and 110 were upgrades. However, these cases were checked for any contamination. The event was considered to be contaminated if any other major announcement like merger or acquisition, divestment, buyback of shares, debenture, GDR or FCCB conversion or exercising of ESOP or ESOS option took place 70 days before or 35 days after the announcement of rating change. Data was also considered contaminated if there was any capital structure change such as declaration of stock dividend, rights issues and stock splits within the event window or if there was an earnings announcement between ±3 days of the date of rating change (Goh and Ederington, 1993). It was also important to identify companies for which regular stock price data was available for the event periods. After data filtering process we finally end up with 70 valid cases of which 31 were upgrades and 39 were downgrades. For all these 70 cases of rating revision, daily closing price data was obtained from BSE Sensex. Daily closing observations for BSE 200 stock index, which was used as market proxy, were also obtained for the corresponding periods. BSE 200 is a broad based value weighted (free float weighted) index which is compiled on the lines of Standard and Poor’s Index, USA.
The data for firm characteristics i.e., market capitalization, price to book value ratio, daily trading volume, debt equity ratio, net intangibles to total assets ratio and return to equity ratio was collected from Thomson Reuter’s Datastream software. The details about measurement of
Exhibit A: Measurement of Firm Characteristics Firm
Characteristic
Measurement Calculation Number of
usable cases
Number of cases in each Portfolio
Size Natural Log of
Market Capitalization
Loge[(Price) X (Number of shares outstanding)]
51 cases (24 downgrades
and 27 upgrades)
Downgrades- 9 large and 15 small size.
Upgrades- 19 large and 8 small size.
Price to Book Value Ratio
Market Price to Book Value Ratio
Market Price / Book Value per Share
50 cases (23 downgrades
and 27 upgrades)
Downgrades-, 4 high and 19 low P/B.
Upgrades- 12 high and 15 low P/B.
Trading volume7
Natual log of Average trading volume to total average trading volume for all companies on BSE 500.
Loge[(Average
trading volume for one year preceding the date of rating change) ÷ (total average trading volume for all companies on BSE 500)]
48 cases (23 downgrades
and 25 upgrades)
Downgrades-12 high and 11 with low trading volume.
Upgrades- 12 high and 13 low trading volume.
Leverage Debt Equity Ratio Long-term debt / Shareholders'
Equity.
42 cases (18 downgrades
and 24 upgrades)
Downgrades- 11 high and 7 low leverage.
Upgrades- 11 high and 13 had low leverage. Intangibles Net Intangibles to
Total Assets Ratio
Net Intangibles / Total assets
44 cases (18 downgrades
and 26 upgrades)
Downgrades- 10 high and 8 as low intangibles.
Upgrades- 14 high and 12 had low intangibility. Profitability Return on Equity PAT / Average Net
Worth
44 cases (18 downgrades
and 26 upgrades)
3. Methodology
The study has been conducted in two parts. In the first part, the relationship between company characteristics, bond rating changes and stock returns is examined. The impact of bond rating changes is analysed separately in case of downgrades and upgrades and for each of the company characteristics. We use event study methodology, as developed by Fama, et al. (1969), Brown and Warner (1985) and Campbell, et al. (1997).
The event date ‘T0’ is the date of announcement of the bond rating change. The daily closing stock prices for the period T0 – 120 days to T0 + 20 days are used for analysis in this study. This daily prices are converted into daily returns using the formula:
Rk, t = log e (Pk, t / Pk, t-1) (1)
Where,
Rk,t isthe continuously compounded return on Day ‘t’ for the stock ‘k’,
Pk, t is the closing price of the stock ‘k’ on day ‘t’,and
Pk, t-1 is the closing price of the stock ‘k’ on day ‘t – 1’ i.e. the previous day.
Daily log returns were also found for the BSE 200 index for the same period.
The market model developed by Sharpe (1963) was used in the analysis. This model relates the return of a security to the return of the market index as given below:
Rk, t = αk + βk R m, t + εk, t (2)
E[εk, t ] = 0 and Var[εk, t ] = σ2 εk .
Where,
Rk, t is the Day t return on security ‘k’,
R m, t is the market index (BSE 200) on day ‘t’,
εk, t is the zero mean error term, and
αk , βk and σ2 εk are the estimated parameters of the market model.
Next, abnormal returns were calculated using the following formula:
ARk, t = Rk, t – ERk , t (3)
Where,
ARk, t is the abnormal return for security ‘k’ on day ‘t’,
Rk, t is the realized return of the security ‘k’ on day ‘t’, and
ERk , t is the fitted values derived from equation (2).
The daily abnormal returns for the pre-event window, days T0 – 20 to T0 – 1 as well as the post - event window, i.e. days T0 to T0 + 20 were calculated. For drawing inferences about the impact of the event, the abnormal returns so obtained were aggregated. The summation for each company was across time.
Cumulative Abnormal Returns for the stocks were defined as:
= , (4)
= , (5)
Where,
CARi are the pre-event Cumulative Abnormal Returns,
CARj are the post-event Cumulative Abnormal Returns, and
ARk,t are the abnormal returns of security ‘k’ on day ‘t’ calculated using equation 3
The abnormal returns of firms with downgrades and those with upgrades were analysed as separate portfolios. We estimate the average of Abnormal Returns across sample companies for each event day (i.e. T0 – 20, T0 – 19,…….,T0 + 20). These were called as Average Abnormal Return (AAR).
= , ⁄ (6)
where,
AARt is the Average Abnormal Returnfor day ‘t’ ,
t is any day in the pre – event or post – event window (i.e. T0 – 20, T0 – 19,…….,T0 + 20)
ARk,t is the Abnormal Return of company k for day ‘t’ as calculated by Equation 3.
The AARs were summed for the pre-event and post-event windows to obtain CAARi and CAARj respectively. These are given by the following equations:
= , (7)
= , (8)
Where,
CAARi and CAARj are respectively the pre-event and post - event Cumulative Average Abnormal Returns,
AARt is the Average Abnormal Returns for day ‘t’ as calculated by Equation 6.
The CAARs were then standardized using the equation given below:
= ⁄ (9)
Where,
SCAAR is the Standardized Cumulative Average Abnormal Return,
CAAR is the pre-event or post – event Cumulative Average Abnormal Return
SECAAR is the standard error of CAAR calculated as:
= ∗ (10)
Where,
T is the number of days (20 for pre- event and 21 for post - event)
σp is portfolio standard deviation given by the Markowitz Portfolio formula:
= + (11)
Where,
σp2 is the portfolio variance.
σk and σh are the Standard deviations of abnormal returns of company ‘k’ and ‘h’ for the pre – event or post-event windows,
ρkh is the correlation coefficient between the returns of securities of company k and h.
N=number of sample companies (31 for upgrades and 39 for downgrades).
ρkh accounts for any cross-correlations between the securities. The correlation coefficient ρkh is
taken to be 0 if there is no overlap in the event windows of the k and hth companies.
The SCAAR values follow t-distribution and are compared to t-statistic, at 5% significance level, 2-tailed with (T-2) degrees of freedom. This helps to find significant average abnormal returns in the pre-event and post-event windows.
The relationship between the bond rating changes and stock returns is also analysed for portfolios created on basis of different firm chacterstics. The characteristics considered include firm size, price to book value ratio, stock liquidity, leverage, nature of assets (intangibles) and profitability. The first step included arranging the BSE 500 companies in the descending order of their respective firm characteristic value (size, P/B ratio, Leverage, proportion of intangibles and profitability) at end of each year (31 December) from 2002 to 2010. The BSE 500 companies were then divided into two equal parts – large and small, each year on the basis of their characteristic value. Company below the median characteristic value was classified as small or low on characteristic otherwise it was classified as large or high on the characteristic1. The characteristic category of each case of bond rating change was taken as the category to which the case belonged for the year – end preceding the rating change. Liquidity had to be estimated as average trading volume. The liquidity of stocks was computed for each case of rating change. The companies on BSE 500 were arranged in the descending order of this ratio and divided into two equal parts - high and low based on their liquidity value for each relevant date. Company below the median liquidity value was classified as less liquid otherwise it was classified as highly liquid. The category of each case of rating change was taken as the category to which the case belonged on the relevant date of rating change. Thereafter, upgrade and downgrade portfolios based on each characteristic were analysed separately using the CAAR analysis.
In the second phase of research, the relationship between the stock returns and bond rating changes was analysed in light of factors like anticipation, magnitude of rating change, transition to, from or within speculative grade and impact of business cycle. The impact of these factors is also seen for the various firm characteristic based portfolios. Regression model given by Goh and Ederington (1999) was used for analysis. The equation is given below:
CARj = α + β1 * CARi + β2 * NUM_GRADE + β3 * BUSINESS_CYCLE + β4* SPEC +
β5 *FALLEN + εi (12)
E[εi] = 0 and Var[εi] = σ2 εi
change. BUSINESS_CYCLE is dummy variable for downturn of business cycle taking values either 1 or 0. In this study the period after September, 20085 was taken as the period where the business cycle took a downturn due to global economic crisis. The variable takes the value of 1 where the rating was changed after September, 2008. In all other cases where the rating underwent a change in or before September, 2008, the dummy variable is taken as 0. SPEC is a dummy variable taking the value of 1 for movement within speculative grade and 0 otherwise. FALLEN is also a dummy variable which assumes value 1 where the movement is to or from speculative grade and 0 otherwise.
This model was also applied to the various firm chacteristic based portfolios to examine whether this relationship changes due to the variables including anticipation, magnitude of rating change and impact of business cycle. The other two variables (FALLEN and SPEC) were excluded owing to the lack of sufficient cases in the portfolio data.
All the variables were tested for correlation with each other. Wherever, a significant correlation was found the variables were suitably transformed to avoid multicollinearity problems.
4. Empirical Results
4.1 Bond Rating Changes and Stock Returns
4.1.1 Aggregate Analysis
Table 1. Aggregate Analysis: Pre-Event and Post-Event CAAR
* Value significant at 5% level of significance
In case of upgrades, (Table 1), pre-event CAAR is not significant but post upgrade CAAR is found to be positive and significant. The statistical insignificance of pre – event results indicates the lack of anticipation by the shareholders in case of upgrades. It emphasizes that shareholders do not monitor good news or positive developments as closely as bad news or potentially negative developments. This confirms asymmetric investor reaction to different types of information.
In case of upgrades, significantly positive abnormal returns are observed after the rating change and there is no lag or anticipation of the rating change. The positive sign in case of upgrades indicates the dominance of signalling effect i.e. the rating change is seen as an indication of future trend of company’s performance.
4.1.2 Analysis on the Basis of Firm Characteristics
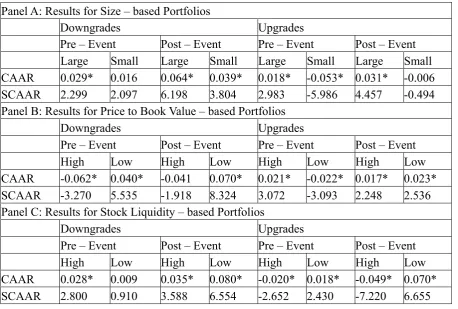
Size Based Portfolios - The results on the basis of company size are listed in Panel A of Table
2. It can be seen that the size based portfolios exhibit different return behavior in case of upgrades. While signalling effect dominates in large size portfolio, small sized portfolio does not depict a significant impact after upgrades. However, in case of downgrades, both the large and small size portfolios show dominance of wealth redistribution effect. Thus, they show similar post – downgrade reaction.
Moreover, though theory suggests that small sized firms should respond more strongly to bond rating changes than large firms but the results obtained do not support this conjecture. This is due to the observation of strong post – event abnormal returns in case of large firms both after downgrades as well as upgrades. In case of downgrades, the large size firms demonstrate stronger response (CAAR = 0.064) than small size portfolio (CAAR = 0.039). In case of upgrades, CAAR is significant only in case of large sized firms.
It is also observed that large size firms show anticipation both in case of upgrades and downgrades as evident from the presence of significant pre – event abnormal returns. This anticipation may be because institutional investors have exposure in large companies and these companies are continuously monitored for any developments which may have a bearing on the future cash flows. Moreover, the impact of the news leading to a rating revision is not fully absorbed in the pre – event period and the effect continues after the rating change.
Small firm portfolio does not show anticipation in case of downgrades. The absence of significant returns in case of small companies indicates that there is no pre – emption. This is
Downgrades Upgrades Pre - event Post - event Pre - event Post - event
CAAR 0.024* 0.009 -0.002 0.016*
consistent with the expectations since small firms are expected to have lesser transparency and may be difficult to value and arbitrage. So credit ratings provide new information in their case.
Table 2. Results for Firm Characteristic – based Portfolios Panel A: Results for Size – based Portfolios
Downgrades Upgrades
Pre – Event Post – Event Pre – Event Post – Event
Large Small Large Small Large Small Large Small CAAR 0.029* 0.016 0.064* 0.039* 0.018* -0.053* 0.031* -0.006 SCAAR 2.299 2.097 6.198 3.804 2.983 -5.986 4.457 -0.494 Panel B: Results for Price to Book Value – based Portfolios
Downgrades Upgrades
Pre – Event Post – Event Pre – Event Post – Event
High Low High Low High Low High Low CAAR -0.062* 0.040* -0.041 0.070* 0.021* -0.022* 0.017* 0.023* SCAAR -3.270 5.535 -1.918 8.324 3.072 -3.093 2.248 2.536 Panel C: Results for Stock Liquidity – based Portfolios
Downgrades Upgrades
Pre – Event Post – Event Pre – Event Post – Event
Panel D: Results for Leverage – based Portfolios
Downgrades Upgrades
Pre – Event Post – Event Pre – Event Post – Event
High Low High Low High Low High Low
CAAR 0.027* 0.004 0.081* 0.009 -0.020* 0.020* -0.041* 0.076* SCAAR 2.825 0.325 7.474 0.622 -2.371 3.381 -4.987 7.897
Panel E: Results for Intangibles – based Portfolios
Downgrades Upgrades
Pre – Event Post – Event Pre – Event Post – Event
High Low High Low High Low High Low
CAAR -0.027* 0.074* 0.056* 0.048* 0.017* -0.007 0.071* -0.041*
SCAAR -2.813 5.468 4.880 3.606 2.597 -0.848 8.038 -5.141
Panel F: Results for Profitability – based Portfolios
Downgrades Upgrades
Pre – Event Post – Event Pre – Event Post – Event
High Low High Low High Low High Low
CAAR 0.010 0.021* -0.012 0.077* 0.004 0.013 -0.012 0.104*
SCAAR 0.630 2.320 -0.861 7.113 0.640 1.310 -1.879 7.606
* Value significant at 5% level of significance
Price to Book Value (P/B) Based Portfolios - Panel B of Table 2 shows results of Price to
Book Value based portfolios. The firms classified on the basis of P/B ratio differ in their response to bond rating changes after downgrades. While no significant reaction is seen for high P/B firms after downgrades, for low P/B firms a strong wealth redistribution effect is observed. This may be because in high P/B firms, both the signalling and wealth redistribution effect cancel each other. Alternatively, it can be said that the entire impact of the information leading to downgrades may have been absorbed in the pre – event period and, therefore, no significant CAAR is observed after the downgrade.
continues in the post - event period as well, bringing positive abnormal returns later.
In case of upgrades, however, both high as well as low P/B portfolios exhibit signalling effect after announcement.
Moreover, the relationship between bond rating changes and stock returns is more pronounced for low P/B firms compared to high P/B firms. This is indicated by the presence of strong abnormal returns for low P/B firms both after downgrades as well as upgrades. This is particularly evident in case of downgrades where no significant reaction is observed for high P/B firms after downgrades but for low P/B firms a strong wealth redistribution effect is seen after the announcement of rating downgrade. The value of CAAR in their case increases from 0.040 before to 0.070 after the announcement of downgrade.
Also in case of upgrades, the stock return behavior of low P/B portfolio shows a stronger response than high P/B firms. The CAAR value for high P/B portfolio is only 0.017 whereas in case of low P/B portfolio the CAAR is 0.023 after upgrade. For low P/B portfolio the sign of CAAR changes from negative to positive after upgrade announcement. In this case a strong positive signal on announcement of upgrade overcomes the negative wealth redistribution effect prevailing in the pre – event period. This may be because for low P/B firms there is less reliable public information. The negative abnormal returns before announcements of upgrades may be due to the wealth redistribution or because the ongoing developments may not be clear to the shareholders and the uncertainty lead to fall in prices, but the upgrade announcement sends a clear positive signal leading to positive returns after the upgrades. Thus, it can be concluded that low P/B firms respond more strongly to bond rating changes than high P/B firms.
All the P/B portfolios exhibit anticipation in pre –event period. In downgrades, the direction of CAAR is different. In high P/B firms, the signalling effect is anticipated and dominant. This is so because such companies may have better disclosures which give the shareholders a fair idea about the earnings position of these firms. In the low P/B companies there may be information problems which make anticipation of earnings difficult. However, the wealth redistribution effects are easier to anticipate. Thus, these firms exhibit positively significant returns before downgrade. The direction of pre – event CAAR also differs in case of upgrades. For high P/Bfirms, a positive impact is seen on the share prices because of strong signalling effect. This observation is in line with expectation that these companies disclose information in a timely manner leading to occurrence of abnormal returns in the pre – event period. However, in low P/B firms, wealth redistribution effect offsets the positive earnings signal leading to negative CAAR.
Stock Liquidity based Portfolios -Panel C of Table 2 shows results of stock liquidity based
to value and therefore, the rating upgrades give a strong earnings signal in case of such firms.
However, post - downgrades, wealth redistribution effect is shown by both the portfolios. It is observed that the post downgrade CAAR for stocks with low trading volume is 0.080 which is higher as compared to CAAR of highly liquid stocks (0.035). So the response to bond rating downgrades is stronger in case of illiquid stocks.
No significant reaction is seen before the downgrades for illiquid stocks (small trading volume). The lack of anticipation is in line with the premise that illiquid firms may have few interested investors and these firms may not be closely monitored for major changes. On the other hand, for the firms whose shares are frequently traded, positive pre – event abnormal returns are observed. This is due to the possible close watch kept by the stockholders for any material changes in the capital structure or earnings situation of these companies. Liquidity, therefore, seems to be the criteria for pre empting information about the downgraded stocks.
In case of upgrades, liquid as well as less liquid stocks show abnormal returns in the pre – event period. However, the direction of these returns is different. In case of less liquid (small trading volume) stocks, signalling effect is very strong and overcomes the wealth redistribution effect leading to a positive CAAR. On the other hand, in case of more liquid stocks, the wealth redistribution effect dominates and overcomes the signalling effect and negative abnormal returns are witnessed.
Financial Leverage based Portfolios- Panel D of Table 2 shows results of leverage based
portfolios. The relationship between bond rating changes and stock returns differs in case of high leverage firms and low leverage firms. In case of rating downgrades, as expected, the high leverage firms show a strong response to rating change while low leverage portfolio do not show any significant CAAR. For high leverage firms the abnormal returns are positively significant both before and after the event because the firms which already have a high leverage are more risky and therefore any further change in leverage may be closely monitored by the shareholders. There is an increase in risk due to downgrades which prompts the investors to expect a higher return on their stocks. The downgrades occurring due to change in capital structure make the investment risky for the bondholders but may lead to transfer of wealth from bondholders to shareholders. Also, these are usually the firms with information problems and therefore the wealth redistribution effect is not fully absorbed in the pre - event window. The firms with low leverage show insignificant returns before as well as after the downgrade. This is because these firms are less risky and a downgrade, in particular, that which occurs in response to change in capital structure does not affect these firms very strongly.
The response of the two portfolios also differs in case of upgrades. In case of upgrades, while strong wealth redistribution effect explains results for high leverage firms, signalling effect dominates the firms with low leverage.
Intangible Assets based Portfolios - Panel E of Table 2 shows results of intangibles based portfolios. The nature of response to rating upgrades is different for high and low intangibility firms. In case of upgrades, while strong signal explains results for high intangibility firms, wealth redistribution dominates the firms with low intangibility. In case of firms with higher intangibles, the value of CAAR increases from 0.017 to 0.071 after upgrades. This is possibly because in these firms rating upgrades provide new earnings information. The abnormal returns continue from the pre – event period to the post –event period implying that the information is not fully absorbed in the first period. The CAAR becomes stronger after the announcement because the announcement possibly provides clear earnings signal for such companies which are usually difficult to value and have less predictable earnings. On the other hand, the wealth redistribution appears after the announcement which leads to negative returns in case of firms with small proportion of intangibles. This may be because earnings signal is not very strong as these companies are easier to value.
In case of downgrades both the portfolios demonstrate wealth redistribution effect after announcement. Moreover, after downgrades, the high intangible firms react strongly (CAAR = 0.056) in comparison to firms with low intangibles (CAAR = 0.048).
The firms with high component of intangibles show pre - emption about earnings signal both before upgrades and downgrades but the low intangibles firms exhibit surprise in case of upgrades.
Profitability based Portfolios- Panel F of Table 2 shows results of profitability based
portfolios. Price response is more pronounced for small profitability firms compared to large profitability firms. The results for high profitability portfolio are insignificant. For low profitability firms, a response is seen both after upgrades and downgrades. Signalling effect is dominant after upgrades in low profitability firms. This may be because the investors normally do not expect firms with low profitability to be upgraded. The announcement of upgrade is seen as an improvement in the future earnings prospects of the firm. This leads to positive sentiment in the shareholders and generates significant returns. In case of downgrades, wealth redistribution effect dominates and overcomes the signal. Also firms with low profitability are likely to be downgraded, thus, anticipation is seen in form of significant pre – event returns. There is no pre - emption in case of upgrades. This may be because investors monitor negative market developments (leading to downgrades) more closely than good ones (which result in upgrades).
4.2 Factors Affecting Cross –Sectional Post Rating Change Performance
4.2.1 Aggregate Analysis
Table 3 shows the results of regression between the post - event CAR and the independent variables both in case of downgrades and upgrades.
Table 3. Results of Regression Between Post – event CAR and Pre – event CAR, Magnitude of Rating Change, Business Cycle Dummy, Movement within Speculative Grade dummy and Movement from Investment to Speculative Grade Dummy
Downgrades Upgrades** Beta t Beta t
(Constant) 0.025 0.517 0.008 0.188
CARi -0.326* -2.162 0.646 1.677
NUM_GRADE -0.081* -3.392 -0.121 -1.072 BUSINESS_CYCLE -0.031 -0.491 0.024 0.438
SPEC -0.007 -0.056 -0.074 -0.634
FALLEN 0.075 0.648 -- --
Adjusted R Square 0.337 0.138
* Value significant at 5% level of significance
**There were no cases of rise of rating from speculative grade to investment grade after upgrade in the sample. Therefore, the variable FALLEN was not included in analysis of upgrades
In case of downgrades, two of the variables namely the pre – event CAR (CARi) and magnitude of rating change (NUM_GRADE) are found to significantly affect the post – event stock returns. The pre – event CAR negatively affects the post - event CAR. The negative sign implies that post – event abnormal returns are high in cases where pre – event abnormal returns are low and vice – versa. Thus, where the downgrade is anticipated by the investors, the post – event abnormal returns are low whereas, the abnormal returns are larger where the downgrade is a surprise.
In case of upgrades, none of the variables was found to be significant.
4.2.2 Firm characteristic based portfolios
The results of relationship of post –event stock returns with pre – event stock returns, magnitude of rating change and business cycle in case of bond rating changes for firm characteristic based portfolios are shown in Table 4. Significant relationship was observed in only two cases. The portfolios based on liquidity cross – sectional variation in case of upgrades. The relationship between pre – event and post – event returns was found to be significant in case of upgrades for portfolios with large trading volume. This may be because in case of firms with high liquidity of stocks, more information in the form of voluntary disclosures and transparency is expected. Thus, the market is able to anticipate the rating change in advance and starts responding to this information even before actual announcement. The relationship was positive indicating importance of the information being conveyed through the upgrade.
The second case where the firm characteristic based portfolio showed significant results was in case of upgrades of portfolio with small proportion of intangibles. Here, a significant positive relationship was observed between business cycle and post – event returns. This implies that during a downward trend in business cycle, the firms with small proportion of intangibles give better returns after upgrade. It may be because these companies have more tangible assets whose value does not erode when the business cycle takes a downturn. Further, the investors may shift from companies which have more intangibles as the value of these intangible assets gets eroded during adverse conditions making such investments more risky. Thus, the firms with small proportion of intangibles become more attractive. Moreover, during adverse economic conditions investors expect ratings to be downgraded whereas upgrades are less common. As a result, the investors respond more strongly to an upgrade than a downgrade (which is a common occurrence during such periods).
Table 4. Results of Regression Between Post – event CAR and Pre – event CAR, Magnitude of Rating Change, Business Cycle Dummy for Bond Rating Changes of Characteristic – based Portfolios@
Panel A: Results for Size – Based Portfolios
Downgrades Upgrades
Large Small Large Small**
Beta t Beta t Beta t Beta t
Constant 0.254 2.191 0.001 0.013 0.220 1.070 0.036 0.294
CARi -0.523 -2.258 0.510 0.867 0.962 1.266 0.729 1.180
NUM_GRADE -0.143 -1.607 0.030 0.681 -0.174 -1.053 -- --
BUSINESS_CYCLE 0.139 1.166 -0.028 -0.285 -0.027 -0.291 -0.004 -0.031
Adjusted R Square 0.605 0.077 0.112 0.256
Panel B: Results for Price to Book Value – Based Portfolios
Downgrades Upgrades High*** Low High Low
Beta t Beta t Beta t Beta t
Constant -0.966 - 0.033 0.443 0.232 2.117 0.215 0.804
CARi -3.360 - -0.285 -1.025 0.737 1.704 1.106 1.401
NUM_GRADE 0.139 - -0.005 -0.149 -0.187 -1.950 -0.157 -0.659
BUSINESS_CYCLE 0.678 - 0.088 1.291 -0.082 -1.569 -0.029 -0.157
Adjusted R Square -- 0.136 0.046 0.173
Panel C : Results for Stock Liquidity – Based Portfolios
Downgrades Upgrades High Low High Low
Beta t Beta t Beta t Beta t
Constant -0.047 -0.432 0.118 0.894 0.171 1.445 0.229 0.712
CARi -0.340 -1.353 0.505 0.674 0.733* 2.304 0.773 0.926
NUM_GRADE 0.009 0.142 0.025 0.451 -0.157 -1.647 -0.151 -0.587
BUSINESS_CYCLE 0.160 2.040 -0.114 -0.796 -0.071 -1.573 -0.019 -0.135
Panel D: Results for Leverage – Based Portfolios
Downgrades Upgrades High Low High Low**
Beta t Beta t Beta t Beta t
Constant 0.086 1.247 -0.119 -0.754 0.192 1.320 0.052 0.405
CARi -0.605 -2.067 -0.807 -1.120 0.756 2.161 0.770 0.686
Num_grade -0.040 -1.283 0.541 1.412 -0.169 -1.522 -- --
BUSINESS_CYCLE 0.140 1.857 0.184 0.916 -0.062 -1.094 0.011 0.077
Adjusted R Square 0.444 0.601 0.405 0.045
Panel E: Results for Intangibles – Based Portfolios
Downgrades Upgrades
High Low High** Low
Beta t Beta t Beta t Beta t
Constant 0.013 0.099 0.040 0.158 0.038 0.471 0.005 0.114
CARi -0.410 -0.560 -0.660 -1.582 0.366 0.371 0.372 1.648
NUM_GRADE -0.009 -0.170 0.005 0.025 -- -- -0.038 -0.965
BUSINESS_CYCLE 0.079 0.609 0.082 0.635 0.053 0.443 0.132* 2.304
Adjusted R Square 0.106 0.476 0.038 0.808
Panel F: Results for Profitability – Based Portfolios
Downgrades Upgrades High Low High Low
Beta t Beta t Beta t Beta t
Constant 0.013 0.404 0.08 0.721 0.132 0.914 0.339 0.576
CARi -0.238 -4.371 -0.622 -1.492 0.565 1.679 2.059 0.926
NUM_GRADE -0.020 -1.102 -0.023 -0.509 -0.128 -1.055 -0.258 -0.594
BUSINESS_CYCLE 0.016 0.852 0.063 0.587 -0.019 -0.355 0.059 0.214
Adjusted R Square 0.956 0.209 0.168 0.277
* Value significant at 5% level of significance
** NUM_GRADE had constant value of 1 in the data set, therefore, it was not included in regression. *** Results could not be tested because of problem of micronumerosity.
@ The number of cases in each portfolio are the same as mentioned in Exhibit A
5. Summary and Conclusions
In case of upgrades, no pre –event abnormal returns were observed. This implies that investors were able to anticipate downgrades but not upgrades, thus, investors seem to track bad news more than good news. On post upgrades basis, there were significantly positive abnormal returns. Signalling effect dominates the post – upgrade investor behaviour. This also indicates that rating upgrades have informational content.
The stock price reaction to bond rating changes varies for companies with different financial characteristics. The differential response is also seen on comparing upgrades with downgrades.
The firms with low P/B ratios and low profitability respond more strongly to the announcement of bond rating changes than their counterparts.
Results show that after the announcement of downgrade, all the companies with possible information problems namely - small in size, low p/b, less liquid, high leverage, high proportion of intangibles in total assets and low profitability displayed positive significant abnormal returns. This indicates that wealth redistribution effect is dominant in case of bond rating downgrade for firms which are expected to have less transparency, information problems and earnings management. The investors and traders can thus, earn positive payoffs after downgrades of such firms.
For firms which may have information problems, response differed after upgrades. While most of these portfolios showed signalling effect (low P/B, less liquid stocks, high intangibles and low profitability) and exhibited positive returns in the post - event period, wealth redistribution effect was found to be strong in case of high leverage companies as shown by negative post – event returns. Small sized companies had insignificant returns in the post upgrade period.
For companies which are expected to have transparency and better disclosures, the post rating change results are not as strong as their counterparts. There is mixed response to downgrade announcements. In case of downgrades, the wealth redistribution effect dominates in case of only large size, highly liquid and low intangibles companies. Again in case of such firms, the results after upgrade announcement support the signalling effect in only three cases (large size, high P/B, and low leverage).
Analysing the factors that influence post –rating performance, it is observed that pre – event CAR negatively affects the post - event CAR. The negative sign implies that where the downgrade is anticipated by the investors, the post – event abnormal returns are low, whereas, the post – event abnormal returns are larger in cases where the downgrade is a surprise. The results also confirm that there is a significantly negative relationship between post – event abnormal returns and magnitude of rating change in case of downgrades which is contrary to prior research. A possible explanation could be that investors generally track troubled companies which may experience a higher magnitude of downgrade. Thus, reducing the surprise element which is reflected in lower post – event abnormal returns.
returns was found to be significantly positive in case of upgrades for portfolios with large trading volume indicating importance of the information being conveyed.
Again in case of portfolio with small proportion of intangibles a significantly positive relationship was observed between business cycle and post – event returns for upgrades. This indicates that in companies with low intangibility the value does not get eroded to a large extent in the downturn of business cycle.
The study shall be useful for regulators, rating agencies, investors, analysts, bankers and academicians.
The research has implications for the regulators like SEBI because the pre – emption of rating change may imply leakages of information and insider trading in case of companies undergoing rating change. The same can be examined by the regulators.
The study is useful for credit rating agencies. The role of credit rating agencies as information providers seems to be over-stated in the system. This is evident from the presence of pre – announcement stock price reaction in a number of cases indicating that the investors are able to gauge the financial position of the firm from indicators other than the rating change announcements. There seems to be a need for closer monitoring of assigned ratings.
The investors and traders can apply the results of the research to form profitable trading strategies.
The banks and other creditors may also find the study helpful in ascertaining how their returns and risk of default varies around rating change. The study is helpful particularly where, a bond rating downgrade is leading to positive returns. Assuming that the overall value of the firm remains constant it implies that the shareholders are gaining at the cost of bondholders owing to redistribution of wealth.
From academic point of view study contributes to the bond rating and market efficiency literature from the emerging market’s perspective.
Notes
1. In case of intangibles, all companies which had no intangible assets were put in the low intangibles category irrespective of where they fell in equal division of companies during classification.
2. This study differs from the work by Goh and Ederington, 1999 in respect of post – event window. While the above mentioned researchers used a 2 day post - event window, this study uses a longer window consisting of 21 days. This has been done due to the reason that impact of rating change is usually lagged and is spread over a longer period of time. Thus, a longer window is used to understand how the impact of bond rating change continues over time.
4. For calculating NUMGRADE, ICRA as well as CRISIL’s rating scale is converted into numerical form with the highest rating (CRISIL AAA of CRISIL and [ICRA]AAA of ICRA) being given a score of 20, and lowest rating (CRISIL D of CRISIL and [ICRA]D of ICRA)being given a score of 1. The approach of converting the scale of rating change has been followed by a number of researchers like Barron, Clare and Thomas (1997); Goh and Ederington (1999) and Avramov et al. (2009).
5. In September 2008 Lehmann Brothers Holdings Inc. filed for bankruptcy. This was followed by the fall of several other financial corporations. Thus, after this period the global financial crisis became explicit. Hence the period after September, 2008 has been considered as the period of downturn in the business cycle.
6. Fama and French (1995) show that low P/B firms exhibit weaker sales and earnings growth rate historically viz a viz high P/B firms and hence can be classified as fundamentally distressed.
7. The measurement of trading volume is in line with Lee and Swaminathan (2000).
References
Avramov, D., Chordia, T., Jostova, G., & Philipov, A. (2009). Credit Ratings and the Cross-section
of Stock Returns. Journal of Financial Markets, 12(3), 469-499.
http://dx.doi.org/10.1016/j.finmar.2009.01.005
Bajaj, K. (1998). A Study of Credit Rating in India. Ph.D. Thesis, Submitted to the Department of Commerce, Delhi School of Economics, University of Delhi.
Bannier, C. E., & Hirsch, C. (2010). The Economic Function of Credit Rating Agencies – What Does the Watchlist Tell Us? Journal of Banking and Finance, 34, 3037–3049.
http://dx.doi.org/10.1016/j.jbankfin.2010.07.002
Barron, M. J., Clare, A. D., & Thomas, S. H. (1997). The Effect of Bond Rating Changes and New Ratings on UK Stock Returns. Journal of Business Finance and Accounting, 24,
497–509. http://dx.doi.org/10.1111/1468-5957.00117
Benjamin, E. E. B. C. (2008). The Impact of Credit Watch and Bond Rating Changes on Abnormal Stock Returns for Non-USA Domiciled Corporations. Dissertations and Theses Collection (Open Access). Paper 44. Retrieved from http://ink.library.smu.edu.sg/etd_coll/44
Bhoot, G. (1995). Corporate Credit Rating in India: An Overview. M.Phil Dissertation, Submitted to the Department of Commerce, Delhi School of Economics, University of Delhi.
Brown, S., & Warner, J. (1985). Using Daily Stock Returns: The Case of Event Studies.
Journal of Financial Economics, 14, 3-31. http://dx.doi.org/10.1016/0304-405X(85)90042-X
Campbell, J. Y., Lo, A. W., MacKinlay, A. C., & Lo, A.Y. (1997). The Econometrics of
Financial Markets. Princeton, NJ: Princeton University Press.
Large Firms. Journal of Finance, 46, 1467–84.
http://dx.doi.org/10.1111/j.1540-6261.1991.tb04626.x
Chakravarty, S., Chiyachantana, C., & Lee, Y. T. (2009). Does the Early Bird Get the Worm? The Informativeness of Credit Watch Placements. Presented at the Annual Meetings of the Financial Management Association European Conference, Turin, 2009. Retrieved from http://www.efmaefm.org/0EFMAMEETINGS/EFMA%20ANNUAL%20MEETINGS/2009-milan/EFMA2009_0136_fullpaper.pdf
Choy, E., Gray, S., & Ragunathan, V. (2006). Effect of Credit Rating Changes on Australian
Stock Returns. Accounting and Finance, 46(5), 755-769.
http://dx.doi.org/10.1111/j.1467-629X.2006.00192.x
Cornell, B., Landsman, W., & Shapiro, A. C. (1989). Cross-Sectional Regularities in the Response of Stock Prices to Bond Rating Changes. Journal of Accounting, Auditing and Finance, 4 (Fall), 460 – 479.
Creighton, A., Gower, L., & Richards, A. J. (2007). The Impact of Rating Changes in
Australian Financial Markets. Pacific – Basin Finance Journal, 15, 1-17.
http://dx.doi.org/10.1016/j.pacfin.2006.04.003
Dichev, I. D., & Piotroski, J. D. (2001). The Long-run Stock Returns Following Bond Ratings Changes. Journal of Finance, 56, 173-203. http://dx.doi.org/10.1111/0022-1082.00322
Duggal, S. (1992). Credit Rating in India – An Emerging Financial Service. M.Phil Dissertation, Submitted to the Department of Commerce, Delhi School of Economics, University of Delhi.
Ederington, L. H., & Yawitz, J. B. (1987). The Bond Rating Process. In Altman, E. edition.
Handbook of financial Markets and Institutions, 6th edition, John Wiley and Sons, New York,
NY, 49 – 51.
Elayan, F. A., Maris, B. A., & Young, P. J. (1996). The Effect of Commercial Paper Rating Changes and Credit-Watch Placement on Common Stock Prices. Financial Review, 31,
149–167. http://dx.doi.org/10.1111/j.1540-6288.1996.tb00868.x
Fama, E. F., Fisher, L., Jensen, M., & Roll, R. (1969). The Adjustment of Stock Prices to
New Information. International Economic Review, 10(February), 1–21.
http://dx.doi.org/10.2307/2525569
Fama, E. F., & French, K.R. (1995). Size and Book-to-Market Factors in Earnings and
Returns. Journal of Finance, 50, 131-155.
http://dx.doi.org/10.1111/j.1540-6261.1995.tb05169.x
Goh, J. C., & Ederington, L. H. (1993). Is a Bond Rating Downgrade Bad News, Good News,
or No News for Stockholders? Journal of Finance, 48 (5), 2001–2008.
http://dx.doi.org/10.1111/j.1540-6261.1993.tb05139.x
Reaction to Bond Rating Changes. Quarterly Review of Economics and Finance, 39(1),
101–112. http://dx.doi.org/10.1016/S1062-9769(99)80006-4
Goswami, R., & Venkatesh, S. (1999). Understanding and Use of Credit Rating in India: A Survey of Individual and Institutional Investors. Working Paper No. 134. Indian Institute of
Management, Bangalore, India. Retrieved from http://www.iimb.ernet.in/research/sites/default/files/WP.IIMB_.134.pdf
Gropp, R., & Richards, A. J. (2001). Rating Agency Actions and the Pricing of Debt and Equity of European Banks: What Can We Infer About Private Sector Monitoring of Bank Soundness? Economic Notes,30(3), 373–398. http://dx.doi.org/10.1111/1468-0300.00064
Hand, J. R. M., Holthausen, R. W., & Leftwich, R. W. (1992). The Effect of Bond Rating Agency Announcements on Bond and Stock Prices. Journal of Finance, 47(2), 733–752.
http://dx.doi.org/10.1111/j.1540-6261.1992.tb04407.x
Hite, G., & Warga, A. (1997). The Effect of Bond-rating Changes on Bond Price Performance.
Financial Analysts Journal,53(3), 35–51. http://dx.doi.org/10.2469/faj.v53.n3.2083
Holthausen, R. W., & Leftwich, R. W. (1986). The Effect of Bond Rating Changes on Common Stock Prices. Journal of Financial Economics, 1(September), 57-89.
http://dx.doi.org/10.1016/0304-405X(86)90006-1
Kaur, K., & Kaur, R. (2011). Credit Rating in India: A Study of Rating Methodology of Rating Agencies. Global Journal of Management and Business Research, 11(December),
62-68.
Kliger, D., & Sarig, O. (2000). The Information Value of Bond Ratings. Journal of Finance, 55, 2879–2902. http://dx.doi.org/10.1111/0022-1082.00311
Lal, J., & Mitra, M. (2011). Effect of Bond Rating on Share Prices: A Study of Select Indian
Companies. Vision: The Journal of Business Perspective, 15(3), 231–238.
http://dx.doi.org/10.1177/097226291101500303
Lee, C. M. C., & Swaminathan, B. (2000). Price Momentum and Trading Volume. The
Journal of Finance,55, 2017–2069. http://dx.doi.org/10.1111/0022-1082.00280
Mohindroo, A. (2008). The Quality Of Credit Rating By ICRA And CRISIL. Doctoral Thesis, submitted to Panjab University, Chandigarh.
Pinches, G. E., & Singleton, J. C. (1978). The Adjustment of Stock Prices to Bond Ratings
Changes. The Journal of Finance, 33, 29–44.
http://dx.doi.org/10.1111/j.1540-6261.1978.tb03387.x
Romero, P. A., & Fernández, M. D. R. (2007). Bond Rating Changes And Stock Returns: Evidence
From The Spanish Stock Market, Spanish Economic Review, 9 (2), 79-103.
http://dx.doi.org/10.1007/s10108-006-9020-0
Sehgal, S., & Arora, M. (2004). Bond Rating Variability Over Time and Consistency of Bond Rating Methodology: Evidence from the Indian Bond Market, IIMB Management Review,
16(3), 16-24.
Sharpe, W. F. (1963). A Simplified Model for Portfolio Analysis, Management Science,
January, 227-293.
Wakeman, L. M. (1990). The Real Function of Bond Rating Agencies. In C. Smith, ed: The
Modern Theory of Corporate Finance, 2nd ed., McGraw Hill, New York, 391-396.
PMCid:PMC1292652
Zaima, J. K., & McCarthy, J. E., (1988). The Impact of Bond Rating Changes on Common Stocks and Bonds: Tests of the Wealth Redistribution Hypothesis, The Financial Review, 23,