RESEARCH
13
C metabolic flux analysis-guided metabolic
engineering of
Escherichia coli
for improved
acetol production from glycerol
Ruilian Yao
1, Jiawei Li
1, Lei Feng
2, Xuehong Zhang
1and Hongbo Hu
1*Abstract
Background: Bioprocessing offers a sustainable and green approach to manufacture various chemicals and materi-als. Development of bioprocesses requires transforming common producer strains to cell factories. 13C metabolic flux analysis (13C-MFA) can be applied to identify relevant targets to accomplish the desired phenotype, which has become one of the major tools to support systems metabolic engineering. In this research, we applied 13C-MFA to identify bottlenecks in the bioconversion of glycerol into acetol by Escherichia coli. Valorization of glycerol, the main by-product of biodiesel, has contributed to the viability of biofuel economy.
Results: We performed 13C-MFA and measured intracellular pyridine nucleotide pools in a first-generation acetol producer strain (HJ06) and a non-producer strain (HJ06C), and identified that engineering the NADPH regenera-tion is a promising target. Based on this finding, we overexpressed nadK encoding NAD kinase or pntAB encoding membrane-bound transhydrogenase either individually or in combination with HJ06, obtaining HJ06N, HJ06P and HJ06PN. The step-wise approach resulted in increasing the acetol titer from 0.91 g/L (HJ06) to 2.81 g/L (HJ06PN). To systematically characterize and the effect of mutation(s) on the metabolism, we also examined the metabolomics and transcriptional levels of key genes in four strains. The pool sizes of NADPH, NADP+ and the NADPH/NADP+ ratio were progressively increased from HJ06 to HJ06PN, demonstrating that the sufficient NADPH supply is critical for acetol production. Flux distribution was optimized towards acetol formation from HJ06 to HJ06PN: (1) The carbon partition-ing at the DHAP node directed gradually more carbon from the lower glycolytic pathway through the acetol biosyn-thetic pathway; (2) The transhydrogenation flux was constantly increased. In addition, 13C-MFA showed the rigidity of upper glycolytic pathway, PP pathway and the TCA cycle to support growth. The flux patterns were supported by most metabolomics data and gene expression profiles.
Conclusions: This research demonstrated how 13C-MFA can be applied to drive the cycles of design, build, test and learn implementation for strain development. This succeeding engineering strategy can also be applicable for rational design of other microbial cell factories.
Keywords: 13C metabolic flux analysis, Metabolomics, Acetol, Glycerol, NADPH, Escherichia coli
© The Author(s) 2019. This article is distributed under the terms of the Creative Commons Attribution 4.0 International License (http://creat iveco mmons .org/licen ses/by/4.0/), which permits unrestricted use, distribution, and reproduction in any medium, provided you give appropriate credit to the original author(s) and the source, provide a link to the Creative Commons license,
and indicate if changes were made. The Creative Commons Public Domain Dedication waiver (http://creat iveco mmons .org/
publi cdoma in/zero/1.0/) applies to the data made available in this article, unless otherwise stated.
Open Access
*Correspondence: hbhu@sjtu.edu.cn
1 State Key Laboratory of Microbial Metabolism, and School of Life Sciences and Biotechnology, Shanghai Jiao Tong University, 800 Dongchuan Road, Shanghai 200240, China
Background
The shortage of non-renewable energy sources and their negative impacts on the environment have inspired inter-ests in the field of bio-based economy [1]. The use of microbial systems for manufacturing different kinds of chemicals offers a sustainable and promising approach [2]. To transform commercial producer strains to cell fac-tories, systems metabolic engineering is required to max-imize the overall production yield, titer, and productivity [3, 4].
Systems biology aims at acquiring a comprehensive and holistic understanding of cellular mechanisms by employing multi-omics data and computational simu-lations [3, 5]. It plays important roles in the design and optimization of the cell factories and bioprocess for years [6, 7]. Recently, fluxomics, reflecting the integrated out-puts of gene–protein–metabolite interactions [8], has attracted significant attentions since the ultimate pur-pose of metabolic engineering is to reroute flux towards chemical production [4]. 13C-MFA can accurately deter-mine the flux configuration with the help of isotope trac-ers, providing information on relative contributions of different metabolic routes, in particular, for the genera-tion of energy and cofactors [9–12]. 13C-MFA has been effectively applied to identify relevant targets to accom-plish the desired phenotype [11, 13–16]. Jazmin et al. [13] used isotopically nonstationary 13C metabolic flux analysis to identify the pyruvate kinase (PK) and enzymes in the PK bypass pathway as overexpression targets to debottleneck isobutyraldehyde production in cyanobac-teria. Okahashi et al. [11] performed 13C-MFA in isopro-pyl alcohol (IPA)-producing E. coli strains and identified NADPH regeneration as a target. To debottleneck IPA production, the authors successfully engineered E. coli strains under nitrogen-starved culture conditions that produced 41.6 mM IPA at a yield of 0.55 (mol/mol) from glucose.
Acetol is mainly used as an important organic inter-mediate to produce polyols and acrolein [17]. It is also utilized as a reducing agent in the textile industry [18]. Chemical and biological approaches have been explored to produce acetol [19–22]. However, chemical pro-cesses are petroleum based. Bioconversion of renewable feedstocks into acetol is more competitive owing to its economically attractive and environmentally friendly properties. Soucaille et al. [23] reported the development of a metabolic engineered E. coli strain that produced 1.63 g/L of acetol from 9.6 g/L glucose in the minimal medium. Valorization of glycerol, the waste stream of biodiesel production, has contributed to the viability of biofuel economy [24, 25]. The metabolic pathways for acetol biosynthesis in E. coli using glycerol as the carbon source are shown in Additional file 1. Acetol is formed
from DHAP in the two reaction steps catalyzed by meth-ylglyoxal synthase (MgsA) and NADPH-dependent alde-hyde oxidoreductase (YqhD).
In our previous work, we facilitated the biosynthesis of acetol in the HJ02 strain derived from E. coli BW25113 by replacing the native glpK gene with the allele from E. coli Lin43 and overexpressing yqhD [22]. In addition, derivatives of HJ02 strain were constructed and the final strain produced 1.82 g/L of acetol. However, the titer was suboptimal and improvable. In this study, we performed 13C-MFA and measured intracellular pyridine nucleotide pools in a first-generation acetol producer strain and a non-producer strain to interrogate mechanisms behind acetol production, and to identify possible targets for genetic modifications. The results revealed that engi-neering the NADPH regeneration is a promising target. Based on this finding, we employed cofactor engineering to increase acetol production. To systematically charac-terize and understand the effect of mutation(s) on the metabolism, we also examined the metabolomics and transcriptional levels of key genes in optimized strains and the parental strain.
Results
13C metabolic flux analysis in first‑generation acetol producer and non‑producer strains
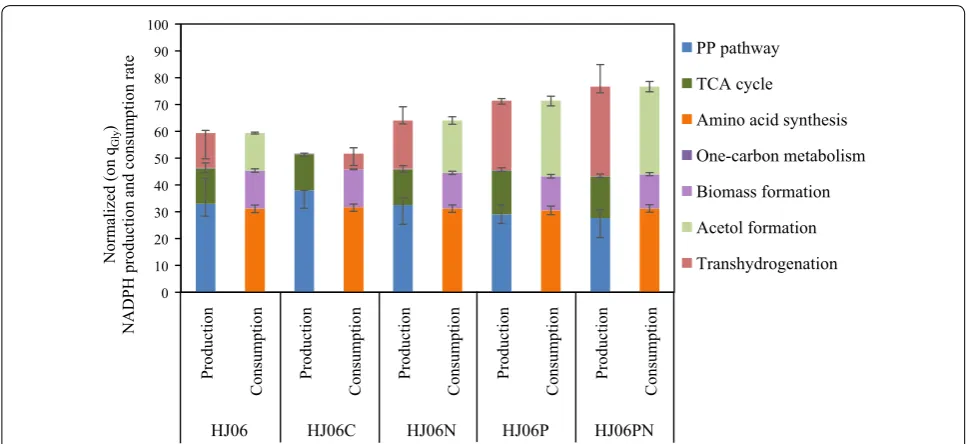
Metabolism-wide NADPH production and consump-tion in HJ06 and HJ06C were then estimated based on metabolic fluxes (Fig. 3). The major NADPH-generating reactions are glucose-6-phosphate dehydrogenase and 6-phosphogluconate dehydrogenase in the oxidative PP pathway, isocitrate dehydrogenase in the TCA cycle, and transhydrogenase (PntAB and UdhA) [27]. Since the NADPH was only required for anabolic demand in HJ06C, excess NADPH was converted to NADH by the
transhydrogenase flux. In HJ06, the fluxes through the PP pathway and the TCA cycle produced less NADPH than was required for biomass and acetol biosynthesis. There was a 21.9% gap to be filled to fulfill the demand for NADPH.
The aforementioned results indicated that the supply of NADPH was a bottleneck for the acetol overproduction. To confirm this hypothesis, we measured intracellular pyridine nucleotide pools in both strains and calculated
0 8 16 24 32 40 48 56 64 720
1 2 3 4 5
Biomass Acetol Acetate
Time (h)
Biomass,
Acetate
,A
cetol
(g/L)
0 2 4 6 8 10 12
Glycerol
Glycerol
(g/L)
a HJ06
0 8 16 24 32 40 48 56 64 720
1 2 3 4 5
Time (h)
Biomass,
Acetate
,A
cetol
(g/L)
0 2 4 6 8 10 12
Glycerol
(g/L
)
b HJ06C
0 8 16 24 32 40 48 56 64 720
1 2 3 4 5
Biomass,
Acetate
,A
cetol
(g/L)
Time (h)
0 2 4 6 8 10 12
Glycerol
(g/L)
c HJ06N
Biomass,
Acetate,
Acetol
(g/L)
0 8 16 24 32 40 48 56 64 720
1 2 3 4 5
Time (h)
Glycerol
(g/L)
0 2 4 6 8 10 12
d HJ06P
Biomass,
Acetate
,A
cetol
(g/L
)
0 8 16 24 32 40 48 56 64 720
1 2 3 4 5
Time (h)
Glycerol
(g/L
)
0 2 4 6 8 10 12
e HJ06PN
the NADPH/NADP+ ratio (Fig. 4a, b; Additional file 5). Compared with HJ06, the NADPH and NADP+ concen-trations, and the NADPH/NADP+ ratio were higher in HJ06C. Taken together, these data allowed us to identify that engineering the NADPH regeneration is a promising target for the acetol overproduction.
Overexpressing nadK to improve acetol production
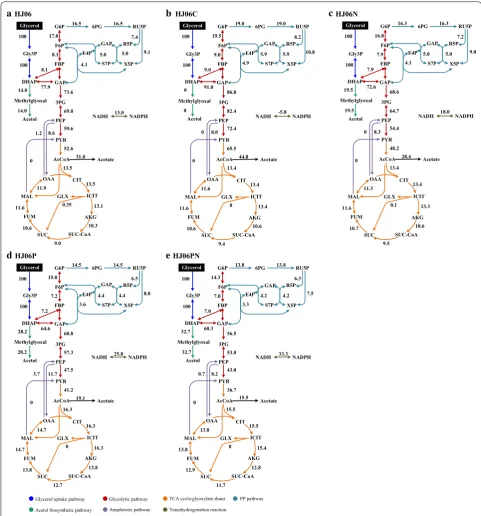
In E. coli, ATP-dependent NAD kinase encoded by nadK converts NAD+ to NADP+ [28]. Overexpression of nadK increased NADPH supply, which is beneficial for NADPH-dependent biosynthetic pathways, such as thymidine in E. coli [29], l-arginine in C. crenatum [30], F6P FBP GAP 3PG PEP 6PG RU5P X5P E4P S7P R5P AcCoA GAP DHAP Acetate Glycerol Gly3P G6P Methylglyoxal Acetol 14.0 17.0 100 16.5 16.5 5.0 5.0 4.1 OAA MAL CIT ICIT AKG SUC-CoA SUC FUM GLX PYR 13.5 13.5 13.1 10.3 9.0 10.6 11.6 11.9 0.35 NADPH NADH 13.0 100 14.0 77.9 8.1 8.1 7.4 9.1 73.6 69.0 59.6 52.6 31.0 0 8.6 1.2 F6P FBP GAP 3PG PEP 6PG RU5P X5P E4P S7P R5P AcCoA GAP DHAP Acetate Gly3P G6P 19.5 100 19.0 19.0 5.9 5.9 4.9 PYR 13.4 -5.8 100 91.0 9.0 9.0 8.2 10.8 86.8 82.4 72.4 65.5 44.8 0 0 8.0 F6P FBP GAP 3PG PEP 6PG RU5P X5P E4P S7P R5P AcCoA GAP DHAP Acetate Gly3P G6P Methylglyoxal Acetol 28.2 15.0 100 14.5 14.5 4.4 4.4 3.6 PYR 16.3 25.8 100 28.2 64.6 7.2 7.2 6.5 8.0 60.8 57.3 47.5 41.2 19.1 0 11.7 3.7 F6P FBP GAP 3PG PEP 6PG RU5P X5P E4P S7P R5P AcCoA GAP DHAP Acetate Gly3P G6P Methylglyoxal Acetol 32.7 14.3 100 13.8 13.8 4.2 4.2 3.3 PYR 15.5 33.3 100 32.7 60.3 7.0 7.0 6.3 7.5 56.5 53.0 43.0 36.7 15.5 0 8.2 0.7 NADPH NADH NADPH
NADH NADH NADPH
OAA MAL CIT ICIT AKG SUC-CoA SUC FUM GLX 13.4 13.4 10.6 9.4 10.6 11.6 11.6 0 OAA MAL CIT ICIT AKG SUC-CoA SUC FUM GLX 16.3 16.3 13.8 12.7 13.8 14.7 14.7 0 OAA MAL CIT ICIT AKG SUC-CoA SUC FUM GLX 15.5 15.4 12.8 11.7 12.9 13.8 13.8 0 Glycerol Glycerol Glycerol
a HJ06 b HJ06C
dHJ06P eHJ06PN
Glycolytic pathway PP pathway
Glycerol uptake pathway
Acetol biosynthetic pathway Anaplerotic pathway Transhydrogenation reaction TCA cycle/glyoxylate shunt
F6P FBP GAP 3PG PEP 6PG RU5P X5P E4P S7P R5P AcCoA GAP DHAP Acetate Gly3P G6P Methylglyoxal Acetol 19.5 16.8 100 16.3 16.3 5.0 5.0 4.1 PYR 13.4 18.0 100 19.5 72.6 7.9 7.9 7.2 9.0 68.6 64.7 54.4 48.2 28.4 0 0 8.3 NADPH NADH OAA MAL CIT ICIT AKG SUC-CoA SUC FUM GLX 13.4 13.3 10.6 10.7 11.6 11.3 0.1 Glycerol cHJ06N 9.5 Acetol 0 0 Methylglyoxal
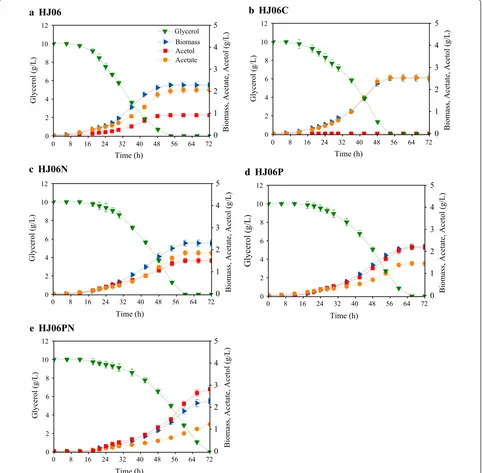
and l-isoleucine in C. glutamicum [31]. In this work, the effect of overexpressing nadK on acetol produc-tion was investigated by introducing the expressing vec-tor pBbB5K-nadK into HJ06. The resulting strain was named HJ06N. HJ06N had a 6-h longer delay for grow-ing in the mineral media than the base strain, HJ06. Once adapted, the specific growth rate and the specific glycerol consumption rate were comparable in HJ06 and HJ06N (Table 1). HJ06N produced 1.50 g/L of acetol (Fig. 1c), a 65% higher value as compared to HJ06. This strain showed slight decreases (~ 10%) in both acetate concen-tration and the specific acetate production rate when compared to HJ06 (Fig. 1c, Table 1).
To study the relationship between the NADPH regen-eration and the activation of acetol production in HJ06N, a metabolic flux distribution was determined by 13 C-MFA (Fig. 2c). The strain HJ06N exhibited a slight higher flux shift from the lower glycolytic pathway to the ace-tol biosynthetic pathway. The flux through the PP path-way and the TCA cycle was very similar in HJ06 and HJ06N. The transhydrogenation flux converting NADH to NADPH increased 1.4-fold compared to HJ06 (Figs. 2c and 3).
Overexpressing pntAB to improve acetol production
The membrane-bound transhydrogenase PntAB transfers a hydride from NADH to NADP+ with the concurrent production of NADPH and NAD+ in an energy-depend-ent manner [27]. Overexpressing pntAB has been used to improve NADPH availability for improving
NADPH-derived products, such as shikimate [32] and poly-(3-hydroxybutyrate) [33]. We hypothesized that overexpressing pntAB in HJ06 would increase the tran-shydrogenase flux and subsequently increase acetol pro-duction. Thus, we generated the pntAB-overexpressing strain called HJ06P. The specific growth rate and the specific glycerol consumption rate were not substantially affected in HJ06P (Table 1). The acetol production in HJ06P was increased to 2.20 g/L, 2.4 times higher than that in HJ06 (Fig. 1d). The amount of acetate formed was reduced about 29% when compared to HJ06.
13C-MFA revealed that the strain HJ06P channeled sig-nificantly more carbon flux from lower glycolysis to the acetol biosynthetic pathway (Fig. 2d). Compared with HJ06, the fluxes through the PP pathway and the TCA cycle were slightly changed in HJ06P. The transhydroge-nase flux was further increased, accounting for 36.2% of the NADPH supply (Figs. 2d and 3).
Co‑overexpressing nadK and pntAB to further improve acetol production
Considering the increased production in the single-gene overexpression strains, we hypothesized that combinato-rial overexpression of pntAB and nadK could have a syn-ergetic effect. To test this hypothesis, the HJ06PN strain harboring the recombinant plasmid pBbB5K-pntAB -nadK carrying the expression cassettes for pntAB and nadK was cultivated to study the effect of overexpres-sion of these genes on acetol production. HJ06PN did not substantially modify the specific growth rate and the
0 10 20 30 40 50 60 70 80 90 100
Production
Consumptio
n
Production
Consumptio
n
Production
Consumptio
n
Pro
ducti
on
Consumptio
n
Production
Consumptio
n
Norm
alized (on
qGly
)
NADPH
production
and consum
ptio
nr
ate PP pathway
TCA cycle
Amino acid synthesis One-carbon metabolism Biomass formation Acetol formation Transhydrogenation
HJ06 HJ06C HJ06N HJ06P HJ06PN
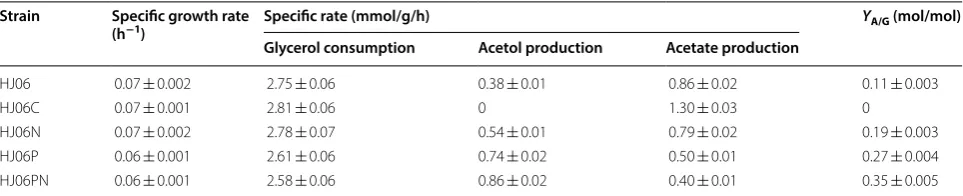
specific glycerol consumption rate (Table 1). The best producing strain HJ06PN accumulated up to 2.81 g/L of acetol (Fig. 1e), which was 3.1 times of that in the original strain, HJ06. Concomitantly, the resulting yield of acetol on glycerol (YA/G) and the specific acetol production rate in HJ06PN were superior to other three strains (Table 1). It is also important to emphasize that the lowest acetate
production and rate occurred in HJ06PN, which were 41% and 53% lower than the values obtained from HJ06 (Fig. 1e, Table 1).
13C-MFA was performed to determine the flux distri-bution in strain HJ06PN (Fig. 2e). In HJ06PN, the distri-butions of key fluxes through the PP and TCA cycle were almost identical to HJ06P. The transhydrogenase reaction a
c
b
d
e
NADPH NADP+
NADH NAD+
HJ06N HJ06P HJ06PN
HJ06C
became a major pathway of NADPH formation that contributed to 43.5% of the total demand for NADPH (Figs. 2e and 3).
Metabolome analysis of acetol‑producing strains
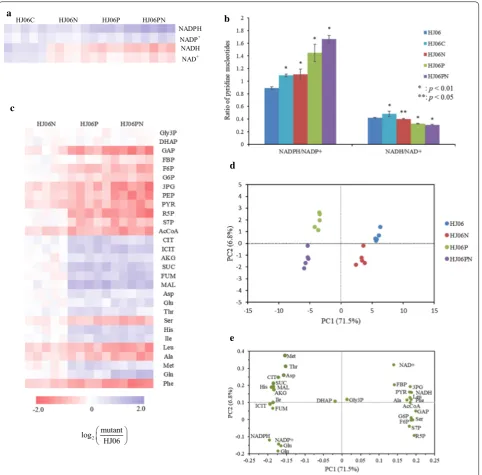
To further evaluate the systematic alterations that con-tribute to acetol production, we performed isotope-assisted LC–MS-based metabolome analysis in all strains. Four sets of the metabolomics profiles each with 33 key metabolites were detected and the datasets were subjected to principle component analysis (PCA) (Fig. 4, Additional file 5). Strains were clearly separated based on their pntAB genotype in the first component and also on their nadK genotype in the second component (Fig. 4d). HJ06N displayed milder metabolic changes, and HJ0P and HJ06PN displayed strong metabolic changes. The most striking and global change in the metabolic state was induced by the combinatorial overexpression strat-egy. Then, metabolites contributing to the separation of samples were examined in the loading plot (Fig. 4e). Sep-aration between strains was greater along PC1 (71.5%), where NADH, NAD+, metabolites in the glycolytic path-way and PP pathpath-way, and amino acids synthesized from these precursors showed positive loadings, NADPH, NADP+, and metabolites involved in the TCA cycle, and their derived amino acids showed negative loadings. PC2 explained 6.8% of the variability, where metabolites with higher contributions to this component were Met, NAD+ and Thr in the positive direction.
A t test was performed comparing optimized strains and the first-generation producer strain, aiming to iden-tify which metabolites have significant differences. Over-expression of nadK and pntAB had a profound influence on the cellular redox status as expected (Fig. 4; Additional file 5). The NADPH and NADP+ concentration as well as the NADPH/NADP+ ratio was most significantly ele-vated in HJ06PN, while NADH and NAD+ levels as well as the NADH/NAD+ ratio showed an opposite trend in this strain. The changes in the metabolites in the central carbon metabolism and amino acids were only moderate
(up to 2.6-fold). Gly3P and DHAP in the glycerol uptake pathway did not show differences between all strains. The levels of upper glycolytic pathway intermediates (F6P and G6P) and PP pathway intermediates (R5P and S7P) were not significantly altered in HJ06N when compared with HJ06, but their levels were lower in HJ06P and HJ06PN than in HJ06. The FBP pool was similar in HJ06, HJ06N and HJ06P, but was present in lower amount in HJ06PN. The upper glycolytic pathway intermediate GAP and the lower glycolytic pathway intermediates (3PG, PEP and PYR) and the TCA cycle metabolite (AcCoA) were less abundant in the optimized strains than in HJ06. Other TCA cycle metabolites, including CIT, ICIT, AKG, SUC, FUM, MAL in HJ06N, were not significantly different from that in HJ06, but were present in higher concentra-tions in HJ06P and HJ06PN than in HJ06. The changing patterns of amino acids might be associated with their precursors.
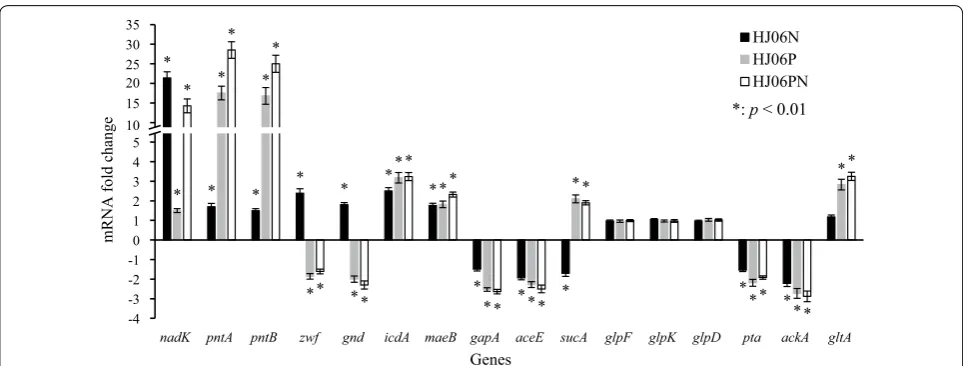
Transcriptional analysis of acetol‑producing strains
To gain a deeper insight of metabolic changes caused by redox equivalent, we measured the transcriptional levels of selected genes in optimized strains by qRT-PCR and normalized the data against the values measured from HJ06 (Fig. 5). Expression analysis also demonstrates that the above modifications indeed enhanced the tran-scription levels of the nadK and pntAB genes. Com-pared with HJ06, the expression levels of genes encoding NADP+-dependent dehydrogenases, zwf, gnd, icdA, and maeB, and pntA were upregulated in HJ06N, thereby reducing excess NADP+ to overproduce NADPH. In contrast, genes encoding NAD+-dependent dehydro-genases, gapA, aceE, and sucA, were transcriptionally attenuated in HJ06N. In addition, the transcript levels of the glycerol uptake pathway genes, glpF, glpK, and glpD, were not significantly altered, and the acetate produc-tion pathway genes, pta and ackA, were downregulated in HJ06N, which correlate to the constant glycerol con-sumption rate and decreased acetate production rate. Moreover, the expression level of gltA in the TCA cycle
Table 1 Growth kinetic parameters of acetol-producing and non-producing E. coli strains
YA/G, acetol yield on glycerol
Strain Specific growth rate
(h−1) Specific rate (mmol/g/h) YA/G (mol/mol)
Glycerol consumption Acetol production Acetate production
HJ06 0.07 ± 0.002 2.75 ± 0.06 0.38 ± 0.01 0.86 ± 0.02 0.11 ± 0.003
HJ06C 0.07 ± 0.001 2.81 ± 0.06 0 1.30 ± 0.03 0
HJ06N 0.07 ± 0.002 2.78 ± 0.07 0.54 ± 0.01 0.79 ± 0.02 0.19 ± 0.003
HJ06P 0.06 ± 0.001 2.61 ± 0.06 0.74 ± 0.02 0.50 ± 0.01 0.27 ± 0.004
was not modified in HJ06N, consistent with the flux dis-tribution. In contrast to the HJ06N/HJ06 comparison, zwf and gnd were found to be downregulated, and sucA and gltA were found to be upregulated during the HJ06P/ HJ06 and HJ06PN/HJ06 comparisons, which agreed with changes of fluxes. Expression profiles between HJ06N/ HJ06, HJ06P/HJ06 and HJ06PN/HJ06 showed no signifi-cant differences in the regulation of other genes.
Discussion
Cofactor engineering and metabolism
Systems biology has proven valuable to uncover the tar-get selection in metabolic engineering [34]. The pre-sent study is a good example of using 13C-MFA to guide rational engineering for strain development. 13C-MFA together with analysis of redox states revealed that NADPH regeneration is a limiting step, and the NADPH availability and well redox balance status are crucial for efficient acetol biosynthesis. We tested our hypothesis by overexpressing nadK and pntAB either individually or in combination in HJ06, an engineered strain in our previous work [22]. The step-wise approach resulted in increasing the acetol titer from 0.91 to 2.81 g/L and the transhydrogenation flux from 13.0 to 33.3%. These find-ings suggested that the supply of NADPH for acetol pro-duction was clearly improved by our strategies.
In addition to the direct genetic modifications for maximizing target metabolite pathway flux, cofactor engineering is an effective tool to improve redox status and finally promoted the product biosynthesis [29, 32,
33, 35]. Several groups tried to increase NADPH sup-ply through the engineering of the PP pathway [36–38]. However, the PP pathway releases one carbon as CO2,
leading to the decreased production yield. In addition, the enhancement of the PP pathway could influence the flux of the central metabolic pathway as well as the pro-duction of certain compounds. Overexpressing NAD+ kinase or transhydrogenase is an alternative way to improve NADPH supply, in turn increasing the produc-tion of thymidine [29], l-arginine [30], l-isoleucine [31], shikimate [32], and poly-(3-hydroxybutyrate) [33]. In our approach, the strain with pntAB overexpression showed better performance than nadK overexpression, indicat-ing that PntAB is more advantageous to enhance acetol production compared with NAD kinase. In addition, the double gene overexpression strain (HJ06PN) had higher acetol production than the best single-gene overexpres-sion strain (HJ06P). The strategy of co-overexpresoverexpres-sion of pntAB and nadK was also useful for improving the pro-duction of isobutanol and fatty acid [35, 39].
The intracellular levels of redox equivalents were measured to evaluate the effect of cellular status on the acetol biosynthesis. NAD kinase represents itself a key enzyme for controlling NAD(H) and NADP(H) bal-ance [40]. PntAB generates NAD+, which can be phos-phorylated to NADP+ by NAD kinase. Thus, combining NAD+ kinase and PntAB can push the reaction direction towards NADPH biosynthesis. The pool sizes of NADPH, NADP+ and the NADPH/NADP+ ratio were progres-sively increased from first-generation producer strain to final highest-producer strain, accompanied by the enhanced transhydrogenase flux, demonstrating that the sufficient NADPH supply and well redox balance status are critical for the acetol production. Similar results were also observed in the nadK-overexpressing E. coli [29] and C. glutamicum [31], and pntAB-overexpressing B. subtilis *
* * * * * *
* * * *
* *
* *
* *
* *
* *
*
* *
* *
* *
* *
* *
* *
*
* *
*
-4 -3 -2 -1 0 1 2 3 4 5
nadK pntA pntB zwf gnd icdA maeB gapA aceE sucA glpF glpK glpD pta ackA gltA
mRNA fold change
Genes
HJ06N HJ06P HJ06PN
10 15 25 20 30 35
*:p< 0.01
[36]. The manipulations improved NADPH supply as well as the production of NADPH-dependent thymidine, l-isoleucine, and isobutanol, respectively. The NADH and NAD+ pools and the NADH/NAD+ ratio were grad-ually decreased from HJ06 to HJ06PN. Acetate formation was linked to the NADH/NAD+ ratio [41], which can explain the constantly reduction in this by-product for-mation from HJ06 to HJ06PN.
Central carbon metabolism
Integration of gene expression profiles, metabolomics and fluxomics enabled a detailed picture of central car-bon metabolism in acetol-producing strains. In the glyc-erol utilization pathway, concentrations of intracellular metabolites, and flux distribution were not differed in four strains, which are responsible for the similar glycerol consumption rate. This revealed the robustness of the metabolic network against genetic perturbations [42].
It is further seen that the flux values through the upper glycolytic pathway, the NADPH-generating PP path-way and the TCA cycle are nearly the same for HJ06 and HJ06N, and slightly changed in HJ06P and HJ06PN. This rigidity is not surprising, since the strains primarily use the carbon source for biosynthetic needs [43]. Sauer’s group [44] demonstrated that the relative flux into the PP pathway remained stable in 91 transcriptional regula-tor E. coli mutants on glucose and galactose. In addition, metabolites changes support the proposed flux scheme (Figs. 2 and 4). Furthermore, the rise in expression of genes zwf and gnd during the HJ06N/HJ06 comparison indicated that NADPH was limited under this condition (Fig. 5). Previous study found that S. cerevisiae responded to increasing NADPH requirement by the upregulation of genes in the oxidative PP pathway [45, 46]. The down-regulation of these two genes during the HJ06P/HJ06 and HJ06PN/HJ06 comparisons was in agreement with the flux change (Figs. 2 and 5). This might be an indica-tive for enough NADPH supply, since transhydrogenase reaction was more activated to serve this role in pntAB overexpression strains. AcCoA diverges to the TCA cycle and the formation of acetate. Although the flux of car-bon fueled to AcCoA from glycolysis differed among four strains, the end result was that optimized strains reduced acetate formation to keep the TCA cycle fluxes similar to HJ06. The flux pattern was consistent with transcrip-tional analysis of gltA (Figs. 2 and 5). The cells used the carbon for growth and energy, not for by-product forma-tion, indicating the global flux flexibility towards growth and optimal flux distributions by resource allocation [47].
13C-MFA revealed the flexibility of the central metab-olism at the DHAP node to accommodate acetol over-production (Fig. 2). The carbon partitioning at this node directed gradually more carbon from the lower
glycolytic pathway through the acetol biosynthetic path-way from HJ06 to HJ06PN. Since optimized strains can maintain similar fluxes through the upper glycolytic pathway as HJ06, the minority of the flux was diverted to the lower glycolytic pathway with less production of NADH (Fig. 4). The repression of gapA and aceE during the HJ06N/HJ06, HJ06P/HJ06 and HJ06PN/HJ06 com-parisons (Fig. 5) correlated well with the decreased flux through these NADH-generating reactions (Fig. 2). The patterns of calculated flux through lower glycolysis were supported by measured changes in levels of GAP, 3PG, PEP, PYR and AcCoA (Fig. 4).
Conclusions
13C-MFA-guided cofactor engineering combined with experimental validations provided useful information about the relevant targets for improving acetol produc-tion by engineered acetol-producing E. coli strains. Over-expression of nadK and pntAB either individually or in combination led to improvements in the acetol produc-tion. 13C-MFA illustrated that metabolism was rewired to reroute flux towards acetol production in optimized strains, which was supported by the most metabolomics data and gene expression profiles. This research demon-strated how 13C-MFA can be applied to drive the cycles of design, build, test and learn implementation for strain development.
Methods
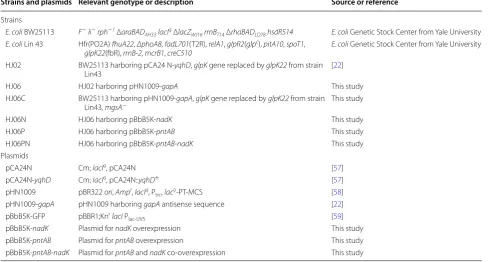
Strains and culture conditions
Escherichia coli strains and plasmids are listed in Table 2. PCR was performed using the PrimeSTAR ® GXL DNA Polymerase (TaKaRa, Japan) and the appropriate primer pairs (Additional file 6). Each gene was assembled with the respective plasmid using In-Fusion Kit (TaKaRa, Japan). Plasmids were transformed into bacterial strains using electrotransformation. Where applicable, 50 µg/mL kanamycin was added to the media for selection.
The pBbB5K-nadK and pBbB5K-pntAB were con-structed as follows. The nadK and pntAB genes were amplified by PCR using the genome of E. coli BL21 as the template with the primer pairs nadk-F/nadk-R and pntAB-F/pntAB-R, respectively. The amplified fragments were cloned into the EcoRI/BamHI site of pBbB5K, and the resulting plasmids were designated pBbB5K-nadK and pBbB5K-pntAB, respectively.
corresponding transformants. The mgsA gene was dis-rupted by P1 phage transduction [48].
The acetol-producing and non-producing E. coli strains were first precultured in LB medium for 8 h and then inoculated to (1% v/v) M9 minimal medium with 10 g/L glycerol. The cells were harvested at 12,000 rpm for 5 min, washed and inoculated into the main culture. The main culture containing 100 mL M9 with 10 g/L glyc-erol was incubated at 37 °C and shaken at 220 rpm in a 500 mL shake flask. For each strain, 11 flasks were used: three flasks were used for measurements of cell growth and extracellular metabolites, five flasks were used for intracellular metabolome analysis and qRT-PCR analy-sis at the mid-exponential growth phase, and three flasks were used for 13C-MFA at the mid-exponential growth phase. For 13C-labeling experiments, glycerol was added entirely as the [1,3-13C]-labeled isotope isomer (99%; Cambridge Isotope Laboratories, Andover, MA). If nec-essary, 50 µg/mL kanamycin was added to the media.
Analytical methods
Cell density was monitored by measuring the optical density at 600 nm (OD600) of E. coli cultures. Glycerol, acetate, and acetol concentrations were determined by high-performance liquid chromatography (HPLC) (model 1260, Agilent, Santa Clara, USA) equipped with a refractive index detector as described previously [22].
Sampling procedures for intracellular metabolome analysis and 13C‑MFA
The quenching and extraction procedures for metabo-lome analysis and 13C-MFA were similar to the method described previously [49–51]. 10 mL culture was quenched in 5 mL 0.9% NaCl solution held at 0 °C in a liquid nitrogen bath. The mixtures were manually agitated to freeze the cells near 0 °C and centrifuged to remove the culture medium. To improve the preci-sion of intracellular metabolite concentration measure-ments, we prepared uniformly 13C-labeled cell extract, which was used as internal standards (IS). The method was adapted from the studies of Wu et al. [52] and Weiner et al. [53] with slight modifications. For metab-olite extraction, the cell pellets were suspended in 5 mL cold methanol containing IS. For 13C-MFA, IS was not added to the methanol. After sonication and vortexing with chloroform and Milli-Q water (72:28), the mixture was centrifuged for 5 min at 4600×g and 4 °C. The top layer was transferred into 5-kDa cutoff filters (Merck Millipore Ltd., Darmstadt, Germany) and then centri-fuged to improve the extraction efficiency. The samples were completely lyophilized (FreeZone 6 Liter, Lab-conco, USA) and stored at − 80 °C.
Table 2 Strains and plasmids used in this study
Strains and plasmids Relevant genotype or description Source or reference
Strains
E. coli BW25113 F− λ− rph−1 ΔaraBAD
AH33 lacIq ΔlacZWJ16 rrnBT14 ΔrhaBADLD78 hsdR514 E. coli Genetic Stock Center from Yale University
E. coli Lin 43 Hfr(PO2A) fhuA22, ΔphoA8, fadL701(T2R), relA1, glpR2(glpc), pitA10, spoT1,
glpK22(fbR), rrnB-2, mcrB1, creC510 E. coli Genetic Stock Center from Yale University HJ02 BW25113 harboring pCA24 N-yqhD, glpK gene replaced by glpK22 from strain
Lin43 [22]
HJ06 HJ02 harboring pHN1009-gapA This study
HJ06C BW25113 harboring pHN1009-gapA, glpK gene replaced by glpK22 from strain
Lin43, mgsA− This study
HJ06N HJ06 harboring pBbB5K-nadK This study
HJ06P HJ06 harboring pBbB5K-pntAB This study
HJ06PN HJ06 harboring pBbB5K-pntAB-nadK This study
Plasmids
pCA24N Cm; lacIq, pCA24N [57]
pCA24N-yqhD Cm; lacIq, pCA24N::yqhD+ [57]
pHN1009 pBR322 ori, Ampr, lacIq, P
trc, laco-PT-MCS [58]
pHN1009-gapA pHN1009 harboring gapA antisense sequence [22] pBbB5K-GFP pBBR1;Knr lacI P
lac-UV5 [59]
pBbB5K-nadK Plasmid for nadK overexpression This study
pBbB5K-pntAB Plasmid for pntAB overexpression This study
LC–MS analysis
Dried metabolite extracts were resuspended in 50 μL of methanol–water (1:1, v/v) and analyzed using a method as described previously [51]. Metabolite sepa-ration was achieved by a SeQuant ZIC-HILIC column (100 mm × 2.1 mm i.d., 3.5 µm) (Merck, Germany) using a Waters I-Class Acquity UPLC system (Waters, UK). The UPLC system was coupled to a Vion IMS QToF sys-tem (Waters, UK) [51].
Significant differences were analyzed by a two-tailed Student’s t test with Microsoft Excel 2016. The principal component analysis plots were generated using SIMCA 14.1 (Umetrics, Umea, Sweden). PCA was applied to the data after mean centering and UV scaling.
13C-MFA
The network model used for flux calculation was modi-fied from our previous research [10] by excluding glu-cose metabolism and including the acetol biosynthetic pathway (Additional file 7). 13C-MFA was performed using the elementary metabolite unit (EMU)-based soft-ware, INCA [54, 55]. Fluxes were estimated by minimiz-ing the lack-of-fit between experimentally measured and simulated mass isotopomer distributions of intracellular metabolites and the measured external rates, using least-squares regression. Each flux estimation was repeated a minimum of 100 times from random initial values to find a global solution. A χ2-statistical test for goodness-of-fit was performed. The nonlinear 95% confidence intervals were computed for all estimated fluxes by computing the sensitivity of the minimized variance-weighted sum of squared residuals to flux variations [56].
qRT‑PCR
RNA was extracted from mid-exponential growing cells to perform qRT-PCR as previously described [10]. The sequences of primer pairs are listed in Additional file 6. Significant differences were analyzed by one-way ANOVA using Microsoft Excel 2016.
Additional files
Additional file 1. Metabolic pathways for acetol biosynthesis in E. coli.
Additional file 2. Measured and simulated mass isotopomer distributions of intracellular metabolites.
Additional file 3. Best fit-fluxes and flux confidence intervals.
Additional file 4. Goodness-of-fit analysis for 13C-MFA.
Additional file 5. Metabolomic data corresponding to the heat map in Fig. 4.
Additional file 6. Primers used in this study.
Additional file 7. Metabolic network model used for 13C-MFA.
Abbreviations
AcCoA: acetyl-CoA; AKG: α-ketoglutarate; CIT: citrate; DHAP: dihydroxyacetone phosphate; E4P: erythrose 4-phosphate; F6P: fructose 6-phosphate; FBP: fruc-tose 1,6-bisphosphate; FUM: fumarate; G6P: glucose-6-phosphate; GAP: glyc-eraldehyde 3-phosphate; GLX: glyoxylate; Gly3P: glycerol-3-phosphate; ICIT: isocitrate; MAL: malate; OAA: oxaloacetate; 3PG: 3-phosphoglyceric acid; 6PG: 6-phosphogluconate; PEP: phosphoenolpyruvate; PYR: pyruvate; R5P: ribose 5-phosphate; RU5P: ribulose 5-phosphate; S7P: sedoheptulose 7-phosphate; SUCCoA: succinyl-CoA; SUC: succinate; X5P: xylulose 5-phosphate.
Authors’ contributions
RY designed and performed most of the experiments, analyzed the result, and wrote the manuscript. JL assisted with experiments. LF performed LC–MS analysis. XZ and HH revised manuscript. All authors read and approved the final manuscript.
Author details
1 State Key Laboratory of Microbial Metabolism, and School of Life Sciences and Biotechnology, Shanghai Jiao Tong University, 800 Dongchuan Road, Shanghai 200240, China. 2 Instrumental Analysis Center, Shanghai Jiao Tong University, 800 Dongchuan Road, Shanghai 200240, China.
Acknowledgements
None.
Competing interests
The authors declare that they have no competing interests.
Availability of data and materials
The datasets supporting the conclusions of this article are included within the article and its additional files.
Consent for publication
Not applicable.
Ethics approval and consent to participate
Not applicable.
Funding
This work was supported by the National Natural Science Foundation of China (21878184 and 31670033).
Publisher’s Note
Springer Nature remains neutral with regard to jurisdictional claims in pub-lished maps and institutional affiliations.
Received: 6 November 2018 Accepted: 6 February 2019
References
1. Fortman JL, Chhabra S, Mukhopadhyay A, Chou H, Lee TS, Steen E, Keas-ling JD. Biofuel alternatives to ethanol. Trends Biotechnol. 2008;19:553–66. 2. Burk MJ, Dien VS. Biotechnology for chemical production: challenges and
oppportunities. Trends Biotechnol. 2016;34:187–90.
3. Chae TU, Choi SY, Kim JW, Ko YS, Lee SY. Recent advances in systems metabolic engineering tools and strategies. Curr Opin Biotechnol. 2017;47:67–82.
4. Schwechheimer SK, Becker J, Wittmann C. Towards better understand-ing of industrial cell factories: novel approaches for 13C metabolic flux analysis in complex nutrient environments. Curr Opin Biotechnol. 2018;54:128–37.
6. Brunk E, George KW, Alonso-Gutierrez J, Thompson M, Baidoo E, Wang G, Petzold CJ, Mccloskey D, Monk J, Yang L. Characterizing strain variation in engineered E.coli using a multi-omics-based workflow. Cell Syst. 2016;2:335–46.
7. Wang Y, Chen L, Zhang W. Proteomic and metabolomic analyses reveal metabolic responses to 3-hydroxypropionic acid synthesized internally in cyanobacterium Synechocystis sp. PCC 6803. Biotechnol Biofuels. 2016;9:209.
8. Sauer U. Metabolic networks in motion. 13C-based flux analysis. Mol Syst Biol. 2006;2:62.
9. He L, Xiao Y, Gebreselassie N, Zhang F, Antoniewiez MR, Tang YJ, Peng L. Central metabolic responses to the overproduction of fatty acids in
Escherichia coli based on 13C-metabolic flux analysis. Biotechnol Bioeng. 2014;111:575–85.
10. Yao R, Xiong D, Hu H, Masataka W, Yu W, Zhang X, Kazuyuki S. Elucida-tion of the co-metabolism of glycerol and glucose in Escherichia coli
by genetic engineering, transcription profiling, and 13C metabolic flux analysis. Biotechnol Biofuels. 2016;9:175.
11. Okahashi N, Matsuda F, Yoshikawa K, Shirai T, Matsumoto Y, Wada M, Shimizu H. Metabolic engineering of isopropyl alcohol-producing
Escherichia coli strains with 13C-metabolic flux analysis. Biotechnol Bioeng. 2017;114:2782–93.
12. Wasylenko TM, Ahn WS, Stephanopoulos G. The oxidative pentose phos-phate pathway is the primary source of NADPH for lipid overproduction from glucose in Yarrowia lipolytica. Metab Eng. 2015;30:27–39. 13. Jazmin LJ, Xu Y, Cheah YE, Adebiyi AO, Johnson CH, Young JD.
Isotopi-cally nonstationary 13C flux analysis of cyanobacterial isobutyraldehyde production. Metab Eng. 2017;42:9–18.
14. D’Espaux L, Ghosh A, Runguphan W, Wehrs M, Xu F, Konzock O, Dev I, Nhan M, Gin J, Apel AR. Engineering high-level production of fatty alco-hols by Saccharomyces cerevisiae from lignocellulosic feedstocks. Metab Eng. 2017;42:115–25.
15. Toya Y, Hirasawa T, Morimoto T, Masuda K, Kageyama Y, Ozaki K, Ogasa-wara N, Shimizu H. 13C-metabolic flux analysis in heterologous cellulase production by Bacillus subtilis genome-reduced strain. J Biotechnol. 2014;179:42–9.
16. Klein T, Lange S, Wilhelm N, Bureik M, Yang TH, Heinzle E, Schneider K. Overcoming the metabolic burden of protein secretion in Schizosaccha-romyces pombe-a quantitative approach using 13C-based metabolic flux analysis. Metab Eng. 2014;21:34–45.
17. Mohamad MH, Awang R, Yunus WMZW. A review of acetol: application and production. Am J Appl Sci. 2011;8:1135–9.
18. Soucaille Philippe, Voelker Francois, Figge Rainer. Metabolically engineered microorganism useful for the production of acetol. WO 2008/116851.
19. Chiu CW, Tekeei A, Sutterlin WR, Ronco JM, Suppes GJ. Low-pressure packed-bed gas phase conversion of glycerol to acetol. AIChE J. 2010;54:2456–63.
20. Yamaguchi A, Hiyoshi N, Sato O, Shirai M. Dehydration of triol com-pounds in high-temperature liquid water under high-pressure carbon dioxide. Top Catal. 2010;53:487–91.
21. Zhu H, Yi X, Liu Y, Hu H, Wood TK, Zhang X. Production of acetol from glycerol using engineered Escherichia coli. Bioresour Technol. 2013;149:238–43.
22. Yao R, Liu Q, Hu H, Wood TK, Zhang X. Metabolic engineering of Escheri-chia coli to enhance acetol production from glycerol. Appl Microbiol Biotechnol. 2015;99:7945–52.
23. Soucaille P, Voelker F, Figge R. 2008. Metabolically engineered microor-ganism useful for the production of acetol. WO 2008/116851.
24. Saini M, Wang ZW, Chiang C, Chao Y. Metabolic engineering of Escherichia coli for production of n-butanol from crude glycerol. Biotechnol Biofuels. 2017;10:173.
25. Lee JH, Jung MY, Oh MK. High-yield production of 1,3-propanediol from glycerol by metabolically engineered Klebsiella pneumoniae. Biotechnol Biofuels. 2018;11:104.
26. Toya Y, Ohashi S, Shimizu H. Optimal 13C-labeling of glycerol carbon source for precise flux estimation in Escherichia coli. J Biosci Bioeng. 2018;125:301–5.
27. Sauer U, Canonaco F, Heri S, Perrenoud A, Fischer E. The soluble and membrane-bound transhydrogenases UdhA and PntAB have divergent
functions in NADPH metabolism of Escherichia coli. J Biol Chem. 2004;279:6613–9.
28. Kawai S, Mori S, Mukai T, Hashimoto W, Murata K. Molecular characteriza-tion of Escherichia coli NAD kinase. Eur J Biochem. 2010;268:4359–65. 29. Lee HC, Kim JS, Jang W, Kim SY. High NADPH/NADP+ ratio improves
thy-midine production by a metabolically engineered Escherichia coli strain. J Biotechnol. 2010;149:24–32.
30. Xu M, Qin J, Rao Z, You H, Zhang X, Yang T, Wang X, Xu Z. Effect of Poly-hydroxybutyrate (PHB) storage on l-arginine production in recombinant
Corynebacterium crenatum using coenzyme regulation. Microb Cell Fact. 2016;15:15.
31. Shi F, Huan X, Wang X, Ning J. Overexpression of NAD kinases improves the l-isoleucine biosynthesis in Corynebacterium glutamicum ssp.
lactofer-mentum. Enzyme Microb Technol. 2012;51:73–80.
32. Cui YY, Ling C, Zhang YY, Huang J, Liu JZ. Production of shikimic acid from
Escherichia coli through chemically inducible chromosomal evolution and cofactor metabolic engineering. Microb Cell Fact. 2014;13:21. 33. Zheng Y, Yuan Q, Yang X, Ma H. Engineering Escherichia coli for poly-(3
hydroxybutyrate) production guided by genome-scale metabolic net-work analysis. Enzyme Microb Technol. 2017;106:60–6.
34. Chen PW, Theisen MK, Liao JC. Metabolic systems modeling for cell factories improvement. Curr Opin Biotechnol. 2017;46:114–9. 35. Li W, Wu H, Li M, San KY. Effect of NADPH availability on free fatty acid
production in E coli. Biotechnol Bioeng. 2018;115:444–52.
36. Qi H, Li S, Zhao S, Huang D, Xia M, Wen J. Model-driven redox pathway manipulation for improved isobutanol production in Bacillus subtilis com-plemented with experimental validation and metabolic profiling analysis. PLoS ONE. 2014;9:e93815.
37. Partow S, Hyland PB, Mahadevan R. Synthetic rescue couples NADPH generation to metabolite overproduction in Saccharomyces cerevisiae. Metab Eng. 2017;43:64–70.
38. Seol E, Sekar BS, Raj SM, Park S. Co-production of hydrogen and ethanol from glucose by modification of glycolytic pathways in Escherichia coli -from Embden-Meyerhof-Parnas pathway to pentose phosphate pathway. Biotechnol J. 2016;11:249–56.
39. Shi A, Zhu X, Lu J, Zhang X, Ma Y. Activating transhydrogenase and NAD kinase in combination for improving isobutanol production. Metab Eng. 2013;16:1–10.
40. Shi F, Li Y, Li Y, Wang X. Molecular properties, functions, and potential applications of NAD kinases. Acta Biochim Biophys Sin. 2009;41:352–61. 41. Vemuri GN, Altman E, Sangurdekar DP, Khodursky AB, Eiteman MA.
Overflow metabolism in Escherichia coli during steady-state growth: transcriptional regulation and effect of the redox ratio. Appl Environ Microbiol. 2006;72:3653–61.
42. Ishii Nobuyoshi, Nakahigashi Kenji, Baba Tomoya, Robert Martin, Soga Tomoyoshi, Kanai Akio, Hirasawa Takashi, Naba Miki, Hirai Kenta, et al. Multiple high-throughput analyses monitor the response of E. coli to perturbations. Science. 2007;316:593–7.
43. Liu N, Qiao K, Stephanopoulos G. 13C metabolic Flux analysis of acetate conversion to lipids by Yarrowia lipolytica. Metab Eng. 2016;38:86–97. 44. Haverkon van Rijsewijk B, Nanchen A, Nallet S, Kleijn RJ, Sauer U.
Large-scale 13C-flux analysis reveals distinct transcriptional control of respiratory and fermentative metabolism in Escherichia coli. Mol Syst Biol. 2011;7:12. 45. Varela C, Schmidt SA, Borneman AR, Pang CNI, Kromerx JO, Khan A, Song
X, Hodson MP, Solomon M, Mayr CM, et al. Systems-based approaches enable identification of gene targets which improve the flavour profile of low-ethanol wine yeast strains. Metab Eng. 2018;49:178–91.
46. Magalie C, Isabelle S, Anne G, Vincent F, Carole C, Sylvie D. A comparative transcriptomic, fluxomic and metabolomic analysis of the response of
Saccharomyces cerevisiae to increases in NADPH oxidation. BMC Genom-ics. 2012;13:317.
47. Taymaznikerel H, De MM, Baart G, Maertens J, Heijnen JJ, Van GW. Changes in substrate availability in Escherichia coli lead to rapid metabo-lite, flux and growth rate responses. Metab Eng. 2013;16:115–29. 48. Cherepanov PP, Wackernagel W. Gene disruption in Escherichia coli:
TcR and KmR cassettes with the option of Flp-catalyzed excision of the antibiotic-resistance determinant. Gene. 1995;158:9–14.
•fast, convenient online submission •
thorough peer review by experienced researchers in your field • rapid publication on acceptance
• support for research data, including large and complex data types •
gold Open Access which fosters wider collaboration and increased citations maximum visibility for your research: over 100M website views per year •
At BMC, research is always in progress.
Learn more biomedcentral.com/submissions
Ready to submit your research? Choose BMC and benefit from:
50. Toya Y, Nakahigashi K, Tomita M, Shimizu K. Metabolic regulation analysis of wild-type and arcA mutant Escherichia coli under nitrate conditions using different levels of omics data. Mol BioSyst. 2012;8:2593–604. 51. Yao R, Pan K, Peng H, Feng L, Hu H, Zhang X. Engineering and
systems-level analysis of Pseudomonas chlororaphis for production of phenazine-1-carboxamide using glycerol as the cost-effective carbon source. Biotechnol Biofuels. 2018;11:130.
52. Wu L, Mashego MR, van Dam JC, Proell AM, Vinke JL, Ras C, van Winden WA, van Gulik WM, Heijnen JJ. Quantitative analysis of the microbial metabolome by isotope dilution mass spectrometry using uniformly 13C-labeled cell extracts as internal standards. Anal Biochem. 2005;336:164–71.
53. Weiner M, Tröndle J, Schmideder A, Albermann C, Binder K, Sprenger GA, Weuster-Botz D. Parallelized small-scale production of uniformly 13C-labeled cell extract for quantitative metabolome analysis. Anal Bio-chem. 2015;478:134–40.
54. Young JD. INCA: a computational platform for isotopically non-stationary metabolic flux analysis. Bioinformatics. 2014;30:1333–5.
55. Antoniewicz MR, Kelleher JK, Stephanopoulos G. Elementary metabolite units (EMU): a novel framework for modeling isotopic distributions. Metab Eng. 2007;9:68–86.
56. Antoniewicz MR, Kelleher JK, Stephanopoulos G. Determination of confidence intervals of metabolic fluxes estimated from stable isotope measurements. Metab Eng. 2006;8:324–37.
57. Kitagawa M, Ara T, Arifuzzaman M, Ioka-Nakamichi T, Inamoto E, Toyonaga H, Mori H. Complete set of ORF clones of Escherichia coli ASKA library (a complete set of E. coli K-12 ORF archive): unique resources for biological research. DNA Res. 2005;12:291–9.
58. Nakashima N, Tamura T. Conditional gene silencing of multiple genes with antisense RNAs and generation of a mutator strain of Escherichia coli. Nucleic Acids Res. 2009;37(15):e103.