ISSN 2324-805X E-ISSN 2324-8068 Published by Redfame Publishing URL: http://jets.redfame.com
Portable Intelligent Oscilloscope Based on Innovative Education
Yu Zeng1, Long-Hua Ma1, Fei-Qing Wu1, Ze-Xi Huang11College of Information Science and Engineering, Ningbo Institute of Technology, Zhejiang University, Ningbo, China
Correspondence: Long-Hua Ma, College of Information Science and Engineering, Ningbo Institute of Technology, Zhejiang University, Ningbo, China. E-mail: hma_zju@zju.edu.cn
Received: October 29, 2019 Accepted: December 11, 2019 Online Published: December 17, 2019 doi:10.11114/jets.v8i2.4660 URL: https://doi.org/10.11114/jets.v8i2.4660
Abstract
Based on the innovative education idea that students in various universities can do experiments anytime and anywhere without being limited by the course time, a portable oscilloscope suitable for students' experiment and teaching practice is designed by using Arduino, Android and Bluetooth Technology. This oscilloscope not only realizes the basic functions of an oscilloscope, but also makes the measurement images of low-frequency signals more clear and impressive. In addition, the design based on the mobile App is more user-friendly, which enhances the user's sense of use and facilitates the sorting and query of experimental data. The application test shows that the oscilloscope has stable performance, clear waveform, satisfies students' learning and teaching practice to a large extent, and has a good development prospect.
Keywords: innovative education, portable oscilloscope, arduino, android, bluetooth technology, app 1.Introduction
In the information age, although many schools have benefited from the laboratory construction, they still lag behind in the humanization of experimental equipment. However, oscilloscope occupies a very important position in the laboratory and electronic electrical experiments almost all use oscilloscope (Zhang li & Yao ruizhan & Guo jianlin & Zhang jiaquan, 2019).
Oscilloscope is a kind of widely used electronic measuring instrument. Oscilloscope can be used to observe the waveforms of different signal amplitudes varying with time. According to statistics, Analog Oscilloscope accounts for 75 percent and Digital Oscilloscope accounts for 25 percent in nearly 20 electronic and electrical laboratories in our university. However, the oscilloscope is large in size, easily damaged, costly and inconvenient to carry and other disadvantages, which are difficult to meet the timeliness and convenience of the experiment. Moreover, because of the limitation of course time, it is difficult for students to complete all experiments during class time. Therefore, if students are allowed to bring the laboratory board and equipment back to their dormitory or classroom, they can overcome the weakness of short class hours. For this situation, the laboratory has improved the opening time, but it is still unable to fundamentally solve this phenomenon. However, the appearance of portable oscilloscope has substantially improved this phenomenon, making it convenient for students to learn experimental courses. But most of the emerging portable oscilloscopes use LCD (Liquid Crystal Display) screen to display data (Zhang huazhong, 2017), which has high cost and cannot effectively operate waveform. In addition, most MCU (Micro Control Unit) used in portable oscilloscopes are expensive and difficult to program (Guo hongwu & Ma dongji & Jin jincheng & Liu mingxue & Xiao han, 2018). Arduino is conducive to the programming of electronic amateurs and its price is low (Zhang haohua & Zhang mengyao & Zhao xiaoshu & Pan qingchao & Ma shijun, 2018). Although the oscilloscope using mobile App for waveform display saves cost (Cao jingsheng & Shi jing & Wang dongxia & Xu xiao & Duan min, 2019), it lacks humanized functional design and universal application.
2. Working Principle
The system, shown in Figure 1, is composed of three parts, namely, Signal Acquisition Module, Control System and App. The Signal Acquisition Module is mainly composed of voltage and current sensors and their peripheral circuits. The Control System is mainly composed of Arduino microcontroller and its peripheral circuit. Signal transmission is completed by HC-05 Bluetooth Module. The main functions of the App include searching Bluetooth devices, pairing Bluetooth devices, receiving and displaying Bluetooth data, drawing real-time graphs, zooming in and out of waveform, inquiring historical data and waveform.
The oscilloscope collects the data of voltage and current sensors in real time, processes and analyzes the data with the Arduino master controller, and transmits the real-time data to the self-made App through the Bluetooth Module. The App performs functions such as waveform display, data receiving display, historical data query, image curve dragging, magnification and minification.
Figure 1. Overall block diagram of portable oscilloscope
3. Hardware System Design
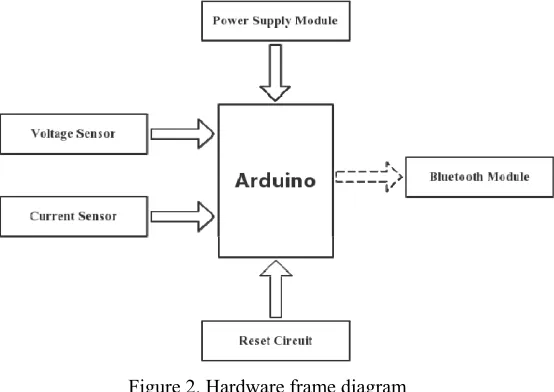
The hardware part of arduino-based portable oscilloscope is shown in Figure 2, mainly including Signal Acquisition Module, Control System and Signal Transmission Module.
The working principle is that the current and voltage sensor in the Signal Acquisition Module will send the current and voltage collected in real time to the Arduino microcontroller in the control system for A/D conversion through serial communication, and then sends it to the App through HC-05 Bluetooth Module.
Figure 2. Hardware frame diagram
This system adopts the Arduino UNO development board for the design of circuit connection, the development board processor core is ATmega328p that contains 14 digital input/output (six of them can be used for PWM output), 6-channel analog input, a 16 MHz crystal oscillator, a USB interface, a DC interface, a ICSP interface and a reset button. This system mainly uses the analog input of the development board to accept the data of the voltage and current sensor and serial port to communicate with Bluetooth. ATmega328p Hardware Diagram is showed in Figure 3.
complex register configuration process with the API. Enhance the readability of the program, reduce the difficulty of software development, and facilitate the development of hardware.
Figure 3. ATmega328p Hardware Diagram
The voltage sensor is RB-02S009A Voltage Detection Module. Based on the design of voltage divider, the input voltage can be reduced by 5 times, the accuracy is set as 0.1V, the sampling time is 1ms, and the voltage output range is 0~25V. Current sensor TA12-200 Current Sensor, based on electromagnetic induction principle, the detection current range is 0~5A, the intensive reading is set as 0.1mA, and the sampling time is 1ms. The voltage and current sensors all adopt analog input, and make use of the 10-bit AD conversion built by Arduino. The simulation resolution is up to 0.00489V, and the current and voltage data are of high accuracy, so as to achieve the effect of collecting and processing real-time voltage and current.
The reason for choosing HC-05 Bluetooth Module is that the connection distance between portable oscilloscope and mobile phone is short, and Bluetooth can completely carry out effective data transmission. In addition, for WiFi, ZigBee, NFC and other communication technologies, the outstanding advantages of Bluetooth Module are lower cost, better transmission distance, low power consumption, high response, and simpler networking. HC-05 Bluetooth Module connects with Arduino through UART protocol, and the RX and TX serial ports of Arduino microcontroller connect with the TX and RX of Bluetooth module, so as to send and receive data.
4. Software System Design
Software System Design mainly includes programming of Arduino master controller and programming of App. The programming of Arduino master controller mainly includes the programming of voltage and current sensor and the programming of Bluetooth. The program design of App mainly includes the function design of App and the interface design of App.
4.1 Arduino Programming for the Master Controller
For Arduino programming, the simulation resolution of the Voltage Sensor Module is 0.00489V, so it is concluded that the minimum input voltage of the Voltage Detection Module is 0.02445V. Using the Arduino-specific function analogRead() to read the values of analog ports and calculate the voltage values by using the val1 variable. the process takes about 60μs.The signal type of the Current Sensor Module is also an analog signal. Similarly, the analogRead() function can be used to read the data. In the program design, the maximum current should be obtained in 1000ms first, that is, getMaxVaule() function should be created to calculate the maximum sensor max, and then the maximum current should be calculated.
4.2 Mobile Phone App Design
4.2.1 Mobile Phone Interface Design
The overall interface of the system adopts Linear Layout overall layout design. The advantage of the LinearLayout is that each element is connected to each other without leaving space in the middle, which is conducive to the clear and beautiful interface. When using Android Studio to design the App interface, it mainly uses XML language for programming. XML language is extensible markup language, which is used to mark electronic files and make them have structure, similar to HTML language. This App is based on Bluetooth data detection App, so the interface design is mainly simple and generous interface, which is mainly divided into two interfaces: one is search Bluetooth interface, the other is the interface composed of curve chart and receiving data.
In the specific implementation of the system interface, activity_control is used for controlling process display, activity_main is used for main process display, Bluetooth device display is Bluetooth_device_item, component_item is part of dividing line, control_line is control line,message_component is digital receiving display, chart_component is curve display control.
The file called activity_main, namely the main process display, mainly realizes the interface transformation in the click process. RecyclerView control is used to list the searched Bluetooth device and display its address. Component_item, namely the partition line, is used to divide each Bluetooth device, making the interface clearer and clearer. RecyclerView control is an upgrade and optimization of the ListView compared to the traditional ListView. It uses the viewholder in a less coupling way, which is more concise. In addition, RecyclerView provides a similar rendering method for any adapter-based view and is more extendable. chart_component, namely graph display control part, using MPAndriodChart graph display, MPAndriodChart is a powerful graphics library for Andriod, compared with Canvas drawing method, the drawing curve more gentle and beautiful, but also has strong animation effects, the waveform diagram, taking advantage of the library MPAndriodChart icon in the system, the dynamic coordinate data display, each sample point data identification, the grid figure drawing, waveform amplification and the narrowing the drag and other functions. App is committed to creating beautiful and user-friendly dynamic real-time waveform display.
4.2.2 Realization of System Functions
In the portable oscilloscope, the main functions of the mobile phone App terminal are divided into three categories, so as to realize the convenience and humanized function display of the mobile phone terminal. One is the result of the voltage, current sensor collected real-time data needs to be transmitted to mobile phone App to display via Bluetooth module, so mobile phone App needs to open close the Bluetooth device, search the Bluetooth devices, the functions of paired Bluetooth devices, the second is the Bluetooth transmission of data format you need to do to byte parsing, receiving data effectively, and by receiving the window display, need to be equipped with display function, three is the ac signal it receives in the form of a graph display, requires some graph window now, then connect all the points with lines, The original rough and uneven image is smoothed by using the smoothing curve drawing principle, and approximately displayed as waveform. In addition, based on the humanization design of mobile App, controls and prompt windows are designed to enhance the sense of user experience, including reminding whether the Bluetooth is allowed to open and close the window, the clear button for receiving data and drawing window, the pause button for receiving data and drawing, the function of drawing window waveform dragging, zooming in and out, and the function of adapting to the screen.
Aiming at the effective realization of each function and the later development and modification, the design principle of UI Layer - Business Logic Layer - Network Layer is adopted to decompose the realization of each function, so as to make the code more clear and considerable and reduce the coupling of each module.
The Network Layer mainly includes opening and closing Bluetooth, searching Bluetooth devices, connecting Bluetooth devices, and receiving Bluetooth data. The Business Logic Layer is the processing of information and data related to your business, which is mainly divided into control process processing of Bluetooth data bytes and data processing of graphs. The UI Layer to achieve data display output, mainly including receiving window display, curve drawing, search Bluetooth window prompt display.
4.2.3 System Logic Interaction Design
HEX and ASCLL code options are designed in the receiving window for decimal and hexadecimal display. In addition, START/PAUSE buttons and CLEAR buttons are designed. The App is also equipped with adaptive screen, free scale zoom in and out, dragging and other functions for the user to view. The following is a brief introduction to each window.
When the receiving window is clicked on the on/off button, the window reads real-time data from Bluetooth. The user selects HEX or ASCLL code selection button according to the demand to display the data, then clicks the START/PAUSE button again to receive the stop data of the receiving window, and clicks the clear button to clear the window data.
Figure 4. System function flow chart
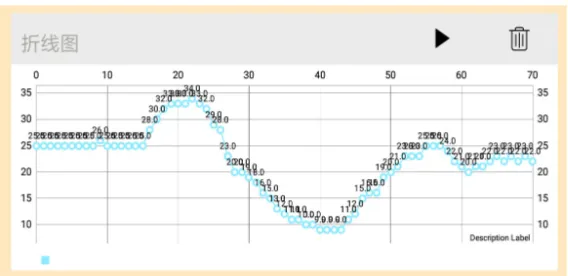
For the curve chart display window, click on the ON/OFF button to start real-time drawing. Click on the ON/OFF button again and the drawing will be suspended. The waveform records each sample point and records its data above the point. When using the drag and zoom function, each point can display the value, the horizontal and vertical coordinate will be adjusted according to the position of the horizontal and vertical coordinate data, the accuracy is set to two decimal points. For the coordinate axis, the dynamic coordinate axis can be used to automatically adjust the data of the horizontal and vertical coordinate axis according to the size of the data. Grid lines are used for drawing. The x-coordinate unit of the voltage waveform is ms, the y-coordinate unit is V, the x-coordinate unit of the current waveform is ms, and the y-coordinate unit is mA. Click the CLEAR button to clear the window data.
5. System Test and Error
5.1 System Voltage and Frequency Error Test
The voltage value and frequency of the portable oscilloscope are provided by the signal generator, set the frequency, voltage and waveform of the signal generator, and then connect the signal generator to the signal acquisition module to receive the data and display the waveform through the mobile App, so as to compare the accuracy of voltage and frequency. The experimental results are shown in Table 1 and Table 2.
Table 1. Experimental Data of Voltage Value
Waveform Standard Voltage/V Actual Voltage/V Error/%
Triangle Wave 5.0 5.0 0%
Square Wave 12.0 12.0 0%
According to the experimental results in Table 1, it is found that the error of reading voltage value of the system is completely consistent with the voltage set by the signal generator, and this oscilloscope has high accuracy for voltage measurement.
Table 2. Experimental Data of Frequency
Waveform Standard Frequency/Hz Actual Frequency/Hz Error/%
Triangle Wave 500 496.3 -0.74%
Square Wave 100 97.5 -2.5%
Square Wave 35 33.4 -4.57%
Sine Wave 20 19.1 -4.50%
By the experimental results of Table 2, for frequency, have certain error, error is negative, after analysis, found that because of the Bluetooth Module Transmission delay for a period of time, lead to the error of the time, the other is large when the lower frequency error, but the overall error within the plus or minus 5 percent, has the high accuracy, used in electronic electrician experiment can completely, the measurement of experimental data and waveform display. According to the measurement, the delay time of bluetooth is around 8ms, and the total delay time of this oscilloscope is around 9.5ms.
5.2 App Interface Display
The design of App adheres to the characteristics of simplicity, clarity and humanization, and is no longer confined to the learning and teaching in the laboratory at a fixed time and place, providing good convenience for students' learning and teaching display.
The display of App achievements mainly includes two interfaces, Bluetooth Pairing Interface and Display Interface. The Bluetooth Display Interface is shown in Figure 5, the Data Receiving Interface is shown in Figure 6, and the Waveform Display Interface is shown in Figure 7 and Figure 8.
5.2.1 Bluetooth Interface Display Figure
5.2.2 Data Display Window Display Diagram
Figure 6. Data display window display diagram 5.2.3 Waveform Drawing Window Diagram
Figure 7. Triangular wave display diagram
Figure 8. Current display diagram
6. Conclusion
Acknowledgements
This work is supported by National Students’ Project for Innovation and Entrepreneurship Training Program (Grant No. 201813022009 and No. 201913022015) and Applied Technology Undergraduate Automation Professional Theory Course Group Construction (Grant No. 2014A05).
References
Cao, J. S., Shi, J., Wang, D. X., Xu, X., & Duan, M. (2019). Design of experimental oscilloscope for vehicle engineering based on STM32, Instrumentation and Analysis Monitoring, 2019(02), 27-30.
Du, C. (2017). Application development research based on android platform, Information Communication, 2017(02), 285-286. https://doi.org/10.1002/jid.3249
Guo, H. W., Ma, D. J., Jin, J. C., Liu, M. X., & Xiao, H. (2018). Design of portable digital oscilloscope based on ARM,
Science and Technology Vision, 2018(12), 243-244.
Huang, L. L. (2018). Discussion on flipped classroom based Andriod software development course, Computer Products and Circulation, 2018(10), 28.
Li, C. Y., & Wang, J. X. (2019). Intelligent obstacle avoidance car based on Arduino hardware, Light Industry Science and Technology, 35(07), 74-79.
Wang, X. Y., Lv, D. Z., Jiang, W. Y., Zhu, Y. H., & Lu, X. (2019). Design of automatic attendance and management system for college mobile phones based on Bluetooth technology, Science and Technology Innovation and Application, 2019(30), 21-23.
Zhang, H. H., Zhang, M. Y., Zhao, X. S., Pan, Q. C., & Ma, S. J. (2018). Arduino-based campus environment monitoring system, Journal of Shenyang Normal University (Natural Science Edition), 36(06), 562-566.
Zhang, H. Z. (2017). Design and implementation of portable digital oscilloscope based on STM32, Modern Computer (Professional Edition), 2017(19), 45-47.
Zhang, L., Yao, R. Z., Guo, J. L., & Zhang, J. Q. (2019). Exploration on the opening mode of key laboratories of local undergraduate universities, Education & Teaching BBS, 2019(38), 270-271.
Copyrights
Copyright for this article is retained by the author(s), with first publication rights granted to the journal.