Influence of soil texture and total organic matter content on soil hydraulic conductivity of some selected Tea growing soils in Dibrugarh district of Assam,
Influence of soil texture and total organic matter
content on soil hydraulic conductivity of some
selected Tea growing soils in Dibrugarh district of
Assam, India
*Nath Tara Nath
1and Bhattacharyya Krishna G
2*1Department of Chemistry, Moran College, P.O. Moranhat-785670, Dist-Sivasagar, Assam, India
E-mail: taranathnath@yahoo.co.in, Tel.: 09954477485
2Professor, Department in Chemistry, Guwahati University, Gauhati, Assam, India
Hydraulic conductivity of a tea growing soil depends on the soil structure. The principal objective of this work was to investigate the influences of soil texture and total organic matter content on hydraulic conductivity for the tea growing soils of Dibrugarh district. Thirty composite soil samples were randomly collected from the top soil (0-20 cm) from the ten tea estates. The samples were analysed for texture, total organic matter content and hydraulic conductivity. The texture of the soil samples found to be sandy clay loam, sandy loam and sandy clay. The total organic matter content varied from 2.28 to 3.72 % with mean value of 3.04 %. The hydraulic conductivity varied from 0.234 to 0.386 cm/min with mean value of 0.311cm/min.The results showed that the soil samples have sufficient amount of total organic matter. It was concluded that soil texture and soil organic matter content had influenced on hydraulic conductivity of the tea growing soil. It was suggested that high concentration of organic matter on soil should be incorporated to the soils with improving hydraulic conductivity. A significance positive relationship was observed between hydraulic conductivity with organic matter content and sand, while, a negative relationship was found with clay content.
Key words: Hydraulic conductivity, clay content, silt content, sand content and total organic matter content.
INTRODUCTION
Tea is an important crop of commerce and a major foreign exchange earner. Agro-climatic conditions and other eco-biological factors largely determine the growth and yield of tea. Being a rain fed crop, it depends largely on rains. There is no upper limit of rainfall. It has been recorded that tea plants can grow even if annual rainfall reaches up to 508 cm and the lower limit of rainfall for its growth is 127 cm. Tea plant is the part of human life and a cheap drink. It is the most preferred drink after water and has been increasing all over the world because tea is a healthy drink (Adilogu and Adilogu, 2006). Tea is the agricultural product of leaves, leaves buds and internodes of Camellia sinensis plant, prepared and cured by various methods. After water, tea is the most widely consumed beverage in the world (Macfarlane and Macfarlane, 2007). Tea is one of the most popular
Influence of soil texture and total organic matter content on soil hydraulic conductivity of some selected Tea growing soils in Dibrugarh district of Assam, vitamins, minerals, and trace elements (Jha et al.,
2006). Among the minerals and essential trace elements, Ca, Na, K, Mg, and Mn are present in tea leaves at g/kg level, while Cr, Fe, Co, Ni, Cu, Zn are present at mg/kg level (Cao et al., 1998). The total metal components in tea plants depend on many factors, primarily the age of tea leaves, the soil conditions, rainfall, altitude, genetic makeup of the plant (Street et al., 2006). The quality of tea leaf is highly important and the contents of the nutrients in tea soil and tea plant affect the leaf quality (Kasar, 1984). To produce economic and quality tea production, it needs best management practices particularly fertilization (Ozyazici et al., 2011).
Tea growing soils of the world are of different origin. Tea grows on soils ranging from the lightest of sand to heavily silt loam or even silt clay loam types. However, medium or light textured soils of acidic character are found to be suitable for the best growth of tea irrespective of countries (Harler, 1966). In North –East India, most of the soils under tea are alluvial in origin and tea crop is grown on fairly flat or gently sloping valley beds reaching up to the foothills (Mann and Gokhale, 1960). According to modern concept, soil is a three dimensional, dynamic, natural body occurring on the surface of the earth that is a medium for plant growth and whose characteristics have resulted from the integrated effect of climate and living matter acting upon parent material, as modified by relief over periods of time. According to a soil scientist, soil as a solid earth material that has been altered by physical, chemical and organic processes such that it can support rooted plants. Soil is the natural body of animal, mineral and organic constituents differentiated into horizons of variable depth, which differ from the material below in morphology, physical make up, chemical properties and composition and biological characteristics (Waugh, 1995). Therefore, soil performs the natural medium for plant growth, provides mechanical support to plant and supplies essential nutrients and water to plants.
Soil texture refers to the sizes that make up the soil and proportion of particle sizes determines a soil texture (Gabler et al., 2009). The relative proportion of different soil particles i.e. sand, clay and silt is known as soil texture. Soil texture is one of the most stable properties and a useful index of several other properties that determine the agricultural potential of soil. It affects the properties of soil including its water supplying power, rate of water infiltration, aeration, soil fertility, ease of tillage and susceptibility to erosion. Sandy soils are porous, have high infiltration rates, and retain little water, but clays have low infiltration rates, retain much water and may be poorly drained. Aeration is good in sandy soils but poor in clays. Roots penetrate sand more easily than clays. The fine and medium textural soils, such as the loam, clay loam, sandy clay loam, silt clay loam and sandy silt loams are generally more desirable because of their superior retention of nutrients and water (White, 1987).
Soil organic matter, the organic fraction of the soil, is a complex mixture of plant and animal products in various
stages of decomposition (Chan et al., 2001). Organic carbon influences the soil compactibility (Soane et al., 1972). Soil organic carbon and soil organic matter maintains a ratio of 1:1.724. The presence of organic matter is of great importance in the formation and stabilization of soil structure. Soil organic matter is any material produced originally by living organisms is returned to the soil and goes through the decomposition process. Organic matter within the soil serves several functions. It is important for two main reasons – (i) as a “revolving nutrient fund”; and (ii) as an agent to improve soil structure, maintain tilth and minimize erosion (Alexandra and Jose, 2005). When plant residues are returned to the soil, various organic compounds undergo decomposition. Decomposition is a biological process that includes the physical breakdown and biochemical transformation of complex organic molecules of dead material into simpler organic and inorganic molecules. Decomposition of organic matter is largely a biological process that occurs naturally. Successive decomposition of dead material and modified organic matter results in the formation of a more complex organic matter called humus (Juma, 1998). This process is called humification. Humus affects soil properties. Humus supplies nutrients to the soil and improves its ability to retain moisture (Adanu and Aliyu, 2012).
Hydraulic conductivity depends upon the soil texture. Since sand particles are loosely bound and water molecules could pass through them easily and rapidly, sandy soils have high values of hydraulic conductivity. On the other hand, high clay content decreases hydraulic conductivity as the clay has a strong affinity towards water. The organic matter present in the soil also influences the hydraulic conductivity. According to Darcy, the velocity of water (V) in a soil or other porous medium is directly proportional to the hydraulic gradient (i). Here K is the proportionality factor and is known as hydraulic conductivity (Darcy, 1956).
V=K i
Hydraulic conductivity is defined as the height of water column that passes through a soil column at a definite time. It reflects the ability of sample to conduct water. Darcy stated that the rate of flow was increased with an increase in depth of water above the bottom of the soil through which it flowed. The flow was decreased with an increased in depth of the soil through which the water flowed. Each soil has different pore sizes and number of pores, therefore, each soil has different flow rate and different hydraulic conductivity. Sandy textured soils have high rates of infiltration which lead to high hydraulic conductivity. The simplest technique to measure hydraulic conductivity is to take an “undisturbed” cylindrical sample of soil, saturated with water and allowing water to flow through it in the laboratory (Bouwer and Jaction, 1974).
Influence of soil texture and total organic matter content on soil hydraulic conductivity of some selected Tea growing soils in Dibrugarh district of Assam, textured soils (Jury et al., 1991). Sandy loam soil
characterised by a relatively high saturated hydraulic conductivity and loamy clay soils with a low saturated hydraulic conductivity (Hultine et al., 2005).The addition of organic matter to the soil usually increases the hydraulic conductivity of soil. This is because the addition of organic matter increases the number of micropores and macropores in the soil by gluing soil particles together or by creating favourable living conditions for soil organisms. Soil organic matter plays an important role in stabilizing soil aggregates. Aggregate stability may influence soil aggregation, hydraulic conductivity and soil water retention (Benzamin et al., 2008). It was showed that more stable soil macroaggregates decreased swelling and staking of the soil aggregates under saturated conditions and so maintained greater saturated hydraulic conductivity (Lado et al., 2004). Improved soil structure can lead to better macroporosity and improved aeration (Stepniewski et al., 1994). Increasing organic matter in soil has the potential to improve soil hydraulic properties by increasing macroporosity, improving water holding capacity and increasing saturated hydraulic conductivity. It was reported that lower bulk density, increased volume of soil pore and greater saturated hydraulic conductivity (Pikul and Allmaras, 1986) .This study aim to investigate the influence of soil texture and organic matter on soil hydraulic conductivity of some selected tea growing soils in Dibrugarh district of Assam.
MATERIALS AND METHODS
Study Area
This study was conducted in tea plantation areas with high tea productivity. Ten tea estates selected for study in the Dibrugarh district of Assam. Dibrugarh district is situated in the eastern part of Assam. The district extends from 27005.38/ N to 27042.30/ N Latitudes and
94033.46/ E to 95029.80/ E Longitudes. The
geographical area covered by Dibrugarh district is 3381 sq km. The area of the Dibrugarh district experiences subtropical monsoon climate with mild winter, warm and humid summer. Rainfall decreases from south to north and east to west in the area. The average annual rainfall in this district is 276 cm with a total number of 193 rainy days.
Physico-chemical properties of soil
The soils of the area are basically the products of the fluvial processes of the Brahmaputra and its tributaries. The plains are composed of alluvium which may be classified as new and old. The new alluvium varies mostly from clayey to sandy loam in texture and is slightly acidic in reaction. In certain parts, both the old and new alluvium are so combined that it is difficult to distinguish them. The pH ranges between 4.2 and 5.5. The new alluvium is less acidic as compared to the old alluvium. Its pH value varies from 5.5 to 9.9. Tea is
abundantly grown in the old alluvium as it has high percentage of acid. The tea estates are located over relatively high lands with discernible slopes containing both old and new alluvium.
Soil sampling and Laboratory analyses
This research was conducted in the tea cultivated soil in Dibrugarh district in the year 2013. Thirty soil samples were collected from the ten tea estates in the month of December, because no fertilization or compost was applied in this month in the tea estates. Composite soil samples were taken from 0 to 20 cm depth and prepared for necessary analysis in the laboratory (Jackson, 1995; Gupta, 2007). The locations of sampling stations were determined by using Global Positioning System (GPS) shown in Figure 1.Texture in the present experiment was determined by the Hydrometer method (Bouyoucos, 1962). Organic matter was determined by the procedure (Walkey and Black, 1974). The hydraulic conductivity was determined by using the procedure (Gupta, 2007).
Soil Texture
Texture in the present experiment is determined by the Hydrometer method (Bouyoucos, 1962). The standard hydrometer is used in aqueous suspension of the pre-measured and pre-treated soil. Hydrometer method is more rapid and gives appropriate reading. A triangular diagram is commonly used to set the limits for each texture class. Soil texture is determined by relative percentage of sand, silt and clay. The procedure adopted for its determination was as follows:
50 g of air dry soil sample was taken in a 500 ml beaker to which 100 ml distilled water was added followed by 10 ml of 30% H2O2 solution to destroy the organic
matter. The beaker, covered with a watch glass, was placed on a water bath at 700C. After 15 minutes, the
beaker was removed and allowed to cool. The above process was repeated three times and finally the beaker was put on a water bath again for two hours to remove the excess H2O2.The content was then
transferred to a 1 L measuring cylinder, 50 ml of 10% calgon (Sodium Hexameataphosphate) solution was added and stirred for 15 minutes and the volume was made up to 1 L with distilled water. The mixture was agitated mechanically for one minute. After 4 minutes, the first hydrometer reading was taken. The temperature of the suspension (to C) was measured.
The hydrometer was calibrated at 670 C. The
suspension was kept undisturbed for two hours and hydrometer reading was taken again by dipping it in the suspension. Simultaneously a blank was also run (i.e. without soil). The following equations were used to find out the sand, silt and clay percentage of the experimental samples:
(Silt + clay)% = {(S – B) + CF} × 100 / W Clay % = {(s – b) + CF} × 100 / W Sand % = 100 – (Silt +Clay)
Influence of soil texture and total organic matter content on soil hydraulic conductivity of some selected Tea growing soils in Dibrugarh district of Assam, B = Hydrometer reading of distilled water at 4
minutes (Blank)
S = Hydrometer reading of sample at 2 hours B = Hydrometer reading of distilled water at 2 hours
W = Air dry weight of soil sample (g ) CF = Temperature correction factor
= (Actual room temperature in 0F – 67) × 0.2
Hydraulic conductivity
Hydraulic conductivity of a soil sample was measured by passing a water column of constant height (2.5 cm) above the core of soil, which was taken as 15.4 cm column. The soil column was placed over a filter paper within a perforated cylinder. The volume of water passed through the soil column in 30 minutes was collected and measured. During this period the constant water supply was made to the water column to keep its height fixed. Mathematically,
Hydraulic conductivity (cm/min) = QL/HAT where Q= Volume of water passed through the column
in cubic centimeter (cm3), L= Length of the soil core in
cm, H=Total height of the water column (i.e. core height + water head) in cm, A = Cross-sectional area of the inner side of the column in cm2, where soil was taken, T
= Time of flow in minutes.
Soil organic matter
Soil organic matter is the seat of nitrogen in soil and its determination is carried out as an index of nitrogen availability. There are two methods generally followed for the purpose. These are (i) the titration method (Walkley and Black, 1974) and (ii) colorimetric method (Datta et al., 1962). In both the methods, organic matter is oxidized with potassium dichromate and concentrated H2SO4.
In the titration method, the excess potassium dichromate is determined by back titration with standard ferrous sulphate (FeSO4.7H2O) or ferrous
ammonium sulphate [Fe(NH4)2(SO4)2.6H2O]. Carbon
present in the soil sample is oxidized as follows:
{K2Cr2O7 + 4 H2SO4 → K2SO4 + Cr2(SO4)3 + 4H2O +
3[O]}×2
{C(organic carbon) + 2[O] → CO2}×3
2 K2Cr2O7 + 6H2SO4 + 3C → 2K2SO4 + 2Cr2(SO4)3 +
8H2O + 3CO2
From the stoichiometry of the above reactions, it is found that
1 ml of 1(N) K2Cr2O7 ≡ 0.003 g of C
In the present study, Walkley and Black method as given above is followed in determining organic carbon content of the soil samples.
In this method, 1 g of soil sample was taken in a 500 ml dry borosil conical flask to which 10 ml of 1(N) K2Cr2O7
solution and 20 ml of concentrated H2SO4 acid were
added followed by addition of 0.25 g of solid silver sulphate. After swirling a little, the mixture was kept on an asbestors sheet for 30 minutes. The contents were diluted to 200 ml with distilled water and then 10 ml of orthophosphoric acid and 1 ml of diphenylamine
indicator were added. The colour of the solution turns blue-violet. The solution was titrated with 0.5 (N) ferrous ammonium sulphate till the colour changes to brilliant green. A blank titration was also run simultaneously but without the soil sample. The amount of organic carbon in percentage and the total organic matter were calculated by using the following formulae:
Organic carbon, % = (N (B – S)/W) × 0.003 × 100 Total organic matter, % = Organic carbon % x 1.724 where N = Normality of ferrous ammonium sulphate, B
= Volume of ferrous ammonium sulphate required for blank (ml), S = Volume of ferrous ammonium sulphate required for soil sample (ml) and W = Mass of soil sample (g).
Statistical analysis
The relationship between soil texture, organic matter content and water holding capacity were determined using correlation coefficient “ r ”. The correlation co-efficient, r, between two variables, x and y is given by:
RESULT AND DISCUSSION
Soil texture
Three different kinds of soil were found in the tea estates viz., sandy clay loam, sandy loam and sandy clay. The texture of the soil samples are given in
Table1.The results showed that sand dominates over clay and silt, and the values could be arranged in the ranges of Clay: 15.12 to 30.64 %, Silt: 4.30 to 5.80 % and Sand: 65.06 to 79.08 %. Usually clay loam soil is considered as more preferable for agricultural crops (White, 1987), but it seems that good tea production can also take place in other types of soil. Soil texture is considered an important parameter. It influences the other properties like water holding capacity, bulk density and hydraulic conductivity that control the flow dynamics of water, nutrients and salts in soil.
Table 1
Soil organic matter
Influence of soil texture and total organic matter content on soil hydraulic conductivity of some selected Tea growing soils in Dibrugarh district of Assam, Figure 1. Locations of soil sampling stations.
Table 1. Soil texture of tea estate soil samples (Surface soil, 0-20 cm depth;each value is the mean of the values obtained for three sampling sites of each of the tea estates)
Sl. No Clay (%) Silt (%) Sand (%) Textural class
T1 24.28 4.83 70.89 Sandy clay loam
T2 20.14 5.38 74.48 Sandy clay loam
T3 20.86 5.22 73.92 Sandy clay loam
T4 22.68 5.02 72.30 Sandy clay loam
T5 25.06 4.62 70.32 Sandy clay loam
T6 28.38 4.48 67.14 Sandy clay loam
T7 16.56 5.68 77.76 Sandy loam
T8 15.12 5.80 79.08 Sandy loam
T9 30.64 4.30 65.06 Sandy clay
T10 18.42 5.54 76.04 Sandy loam
Min 15.12 4.30 65.06
Max 30.64 5.80 79.08
Mean 22.21 5.09 72.70
Laboratory work (2013)
Figure 2. Total organic matter (%) of the surface soil samples
value of the mean organic carbon from one site to another for the surface soil is shown in Figure 2. If the organic carbon content is < 0.50 %, the soil is
considered as low in carbon and if the same is > 0.75 %, the soil is considered very rich in carbon (Baruah and Barthakur, 1977). In the present study, the values
0 1 2 3 4
T1 T2 T3 T4 T5 T6 T7 T8 T9 T10
T O C %
Influence of soil texture and total organic matter content on soil hydraulic conductivity of some selected Tea growing soils in Dibrugarh district of Assam, Table 2. Total organic matter (%) and Hydraulic conductivity (cm/min) of tea estate soil samples
(Surface soil, 0-20 cm depth; each value is the mean of the values obtained for three sampling sites of each of the tea estates)
Sl. No Total organic matter (%)
Hydraulic conductivity (cm/min)
T1 2.78 0.282
T2 3.32 0.338
T3 3.15 0.318
T4 2.98 0.302
T5 2.60 0.264
T6 2.46 0.259
T7 3.65 0.372
T8 3.72 0.386
T9 2.28 0.234
T10 3.46 0.354
Min 2.28 0.234
Max 3.72 0.386
Mean 3.04 0.311
Laboratory work (2013)
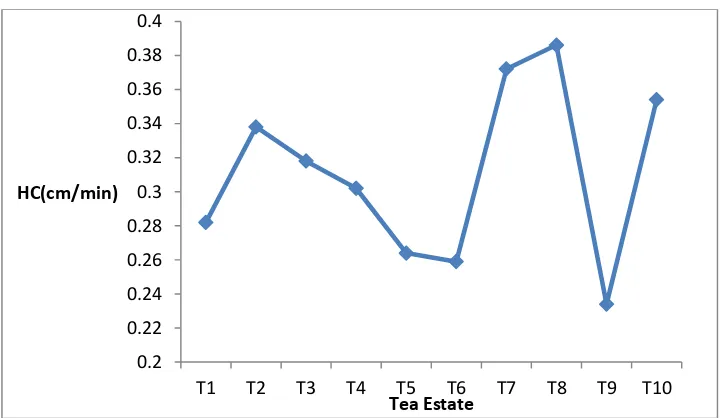
Figure 3. Hydraulic conductivities of the surface soil samples
of organic matter were in the ranged of 2.28 to 3.72 %. All the soil samples in the study area contains sufficient amount of organic carbon.
Soil hydraulic conductivity
The results of soil hydraulic conductivity (Table 2) were found to be 0.234 to 0.386 cm/min in the tea estate soil. The variation of the mean hydraulic conductivity from one site to another for the surface soil is shown in
Figure 3. It is also true that the soil texture will have certain influence on the hydraulic conductivity. As the percentage of clay increases in the soil, the hydraulic conductivity decreases as clay can bind the water molecules more effectively. Thus, soils possessing
higher amount of clay will have low value of hydraulic conductivity. In fact, a good negative correlation was observed between clay content and HC of tea estate soil. The results showed that as the percentage of sand increases the hydraulic conductivity of soil also increases. And as the organic matter increases the hydraulic conductivity of soil also increases. This clearly indicated that clay, sand and organic matter content influences the hydraulic conductivity of soil.
Relationship between soil texture and hydraulic conductivity of soil samples
According to the following workers (Gupta, 2007; Singanan, 1995) a good correlation is predicted if the
0.2 0.22 0.24 0.26 0.28 0.3 0.32 0.34 0.36 0.38 0.4
T1 T2 T3 T4 T5 T6 T7 T8 T9 T10
HC(cm/min)
Influence of soil texture and total organic matter content on soil hydraulic conductivity of some selected Tea growing soils in Dibrugarh district of Assam, Table 3. Simple correlation coefficient (r) between soil texture and total organic matter with soil hydraulic conductivity
Related soil parameters Correlation Coefficient ( r ) Level of Significance
Clay content (%)—HC (% ) -0.80 Strong negative
Sand content (%)—HC (% ) 0.78 Significance positive
Total organic matter (%)—HC (% ) 0.82 Strong positive
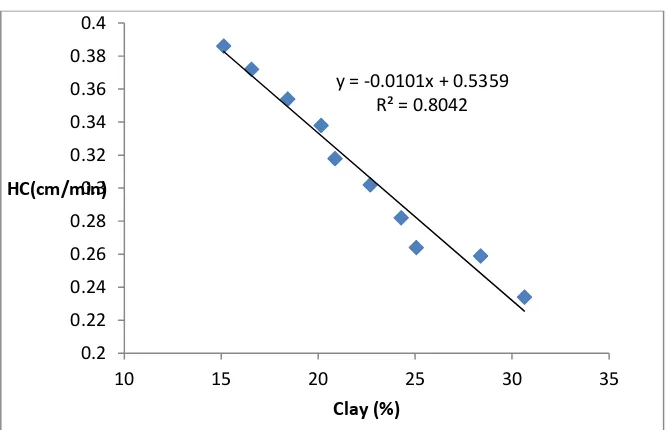
Figure 4. Linear correlation between Clay (%) and HC(cm/min)
Figure 5. Linear correlation between Sand (%) and HC(cm/min)
linear regression co-efficient “ r ” is > 7. The simple correlation coefficient (r) between soil texture and hydraulic conductivity of soil samples are given in
Table 3. It was observed that the hydraulic conductivity is dependent on texture of the soil. As the clay content of the soil sample increases the hydraulic conductivity decreases and as the sand content increases the hydraulic conductivity increases. The Several studies (Wang et al., 2008) showed that HC decreases with increasing the level of clay. It was observed strong negative correlation (r = -0.80) between clay content
and hydraulic conductivity (Figure 4 ) and positive correlation (r = 0.78) between sand content and hydraulic conductivity
(Figure 5).
Relationship between soil organic matter and hydraulic conductivity of soil samples
It was obtained strong positive correlation (Table 3and Figure 6) between total organic matter content and hydraulic conductivity of the soil samples ( r = 0.82),
y = -0.0101x + 0.5359 R² = 0.8042
0.2 0.22 0.24 0.26 0.28 0.3 0.32 0.34 0.36 0.38 0.4
10 15 20 25 30 35
HC(cm/min)
Clay (%)
y = 0.0113x - 0.5078 R² = 0.7834
0.2 0.22 0.24 0.26 0.28 0.3 0.32 0.34 0.36 0.38 0.4
60 65 70 75 80
HC(cm/min)
Influence of soil texture and total organic matter content on soil hydraulic conductivity of some selected Tea growing soils in Dibrugarh district of Assam, Figure 6. Linear correlation between TOC (%) and HC(cm/min)
which indicate that as the organic matter increases the hydraulic conductivity of soil increases. Several studies (Stepniewsky et al., 1994; Pikul and Allmaras, 1986; Rawls et al., 2005) showed that the hydraulic conductivity bears a positive relationship with the soil organic matter.
CONCLUSION
This work has established that levels of soil organic matter and soil hydraulic conductivity are within the accepted limits. Assessment of soil organic matter content and hydraulic conductivity in the ten tea estate soil samples (as listed table 2 ) can be summarized as follows : T8 > T7 > T10 > T2 > T3 > T4 > T1 > T5 > T6 > T9 .
It was seen that tea soils with high hydraulic conductivity have good yield and best quality of tea. A strong relationship exists between soil texture, soil organic matter and soil hydraulic conductivity. It was concluded that clay soil retain more water than the sandy soil and addition of soil organic matter could increase the hydraulic conductivity. Soil texture and organic matter are the key components that control the soil hydraulic conductivity.
REFERENCES
Adanu GK, Aliyu AK (2012). Determination of the Influence of Texture and Organic Matter on Soil Water Holding Capacity in and Around Tomas Irrigation Scheme, Dambatta Local Goverment Kano State. Research Journal of Environmental and Earth Sciences. 4(12): 1038-1044.
Adilogu A, Adilogu S ( 2006). An Investigation on Nutritional Status of Tea (Camellia sinensis L.) Grown
in Eastern Black Sea Region of Turkey. Pakistan Journal of Biological Sciences. 9(3): 365-370.
Alexadra B, Jose B (2005). The importance of soil organic matter key to drought resistance soil and sustained food production. FAO Soil Bulletin 80. FAO Soil Bulletin 80. Food and Agriculture Organization of the United Nations.
Baruah TC , Borthakur HP (1997). In: A textbook of soil chemical analysis, Vikash Publishing, New Delhi. Benzamin Joseph G, Mikha Maysoon M, Vigil Merle F( 2008). Organic carbon effects on soil physical and hydraulic properties in a Semiarid climate. Soil Sci. Soc. Am. J. 72: 1357-1362.
Bouwer H, Jaction RD (1974). Determining Soil Properties in J.Van Schil.
Bouyoucos GJ ( 1962). Hydrometer Method improved for making particle size Analysis of Soil-Agron. J, 54, pp 464.
Cao X, Zhao G, Yin M, Li J (1998). Determination of ultratrace rare earth elements by inductively coupled plasma mass spectroscopy with microwave digestion and AG50W-X8 cation exchange chromatography. Analyst, 123: 1115-1119.
Chan KY, Bawman A, Oates A (2001). Oxidizable Organic Carbon Fractions and Soil Quality changes in an Oxic Paleustalf under Different Pasture leys. Soil Sc. 166(1): 61-67.
Darcy (1956). Les Fontains Publishers de la Ville de Dijon. Paris :V.Dalmont, 590-594. Delhi.doi:10.1029/2008WR006865.
Gabler RE, Peter JF, Trapson M, Sack D (2009). Physical Geography: Brooks/Cole. Belmont, USA. Gupta PK ( 2007). Method in Environmental analysis of water, soil and air. Second Edition, Agrobios, India Hacke UG, Sperry JS, Ewers BE, Ellswoth DS, KVR Schafer, Oren R (2000a). Influence of soil porosity on water use in Pinus taeda, Oecologia. 124: 495-505.
y = 0.1018x + 0.0015 R² = 0.8202
0.2 0.22 0.24 0.26 0.28 0.3 0.32 0.34 0.36 0.38 0.4
2 2.5 3 3.5 4
HC(cm/min)
Influence of soil texture and total organic matter content on soil hydraulic conductivity of some selected Tea growing soils in Dibrugarh district of Assam, Harler CR ( 1966). Tea soils. In Tea Growing, 3rd Edn.
Oxford Univ. Press, Lonbdon, pp 34-40.
Hultine KR, Koepke DF, Pockman WT, Fravolini A, Sperry JS (2005). Influence of soil texture on hydraulic properties and water relations of a dominsnt warm-desert phreatophyte. Tree Physiology, 26: 313-323. Jackson ML (1995). In: Soil Chemical Analysis, Advanced Course .Prentice Hall (India), New Delhi. Jha A, Mann RS, Malachandran R ( 1996). Tea: A refreshing beverage. Indian Food Industry, 15: 22-29. Juma NG( 1998).The pedosphere and its dynamics: a systems approach to soil science. Volume 1. Edmonton, Canada, Quality Color Press Inc. P 315 Jury WA, Gardner WR, Gardner WH (1991). Soil Physics. John Wiley, New Work, pp 328.
Kasar Kasar ( 1984). General Directory of Tea Management, Ankara, 4: 356 .
Kotoy R, Nath SC, Kalia S ( 2013). Variation of metal contents in tea plants around oil installation ,Assam. International Journal of Scientific Research. 2(3): 189-191.
Lado M, Paz A, Ben-Hur M. (2004). Organic matter and aggregate size interaction in saturated hydraulic conductivity. Soil Sci. Soc. Am. J. 68: 234-242.
Macfarlane and Macfarlane, I. 2007.The Empire of Tea, The Overlook Press, 32 .
Mann HH, Gokhale NG ( 1960). Soils of tea growing tracts of India. J. Indian Society. Soil Sc. 8 (4):191-200 . Ostrowska J, Stankiewcz A, Skrzydlewska E (2001). Antioxidant properties of green tea. Bromotol, Toxicol, Chem. 2: 131.
Ozyazici MA, Ozyazici G, Dengiz O ( 2011). Determination of of micronutrients in tea plantations in the eastern Black Sea Region, Turkey. African Journal of Agricultural Research, 6 (22): 95-114.
Pikul JL Jr, Allmaras RR ( 1986). Physical and chemical properties of a Haploxeroll after fifty years of residue management. Soil Sc. Soc. Am.J. 50: 214-219. Rawls WJ, Nemes A, Pachepky YA ( 2005). Effect of soil organic matter on soil hydraulic properties, in Development of Pedotransfer Functions in Soil Hydrolog, edited by Y.A. Pachepsky and W.J.Rawls, Elsevier, Amsterdam, pp. 95-114.
Singanan MK, Somasekhara , Rambabu (1995). A correlation study on physicochemical characteristics of ground water in Rameswaram Island. Indian J. Environ. Protec. 15 (3):213-217.
Soane BD, Compell DJ , Herkes SM (1972). The characterisation of some scotish arable topsoil by agricultural and engineering methods. I. Bid. 23:93-104 Sperry JS, Hacke UG ( 2002). Desert shrub water relations with respect to soil characteristics and plant functional type. Funct. Ecol. 16: 367-378
Sperry JS, Adler FR, Campbell GS, Comstock JP (1998). Limitation of plant water use by rhizosphere and xylem conductance: result from a model .Plant Cell Environ. 21: 347-359
Srividhya B, Subramanium R, Raj V (2011). Determination of lead ,manganese, copper, zinc, cadmium, nickel and chromium in tea leaves. 3(4): 257-258.
Stepniewski W, Glinski J, Ball BC (1994). Effects of compaction on soil aeration properties, pp-167-189, eds. Soane BD, Ouwerkerk CV.
Street R, Szakova J, Drabek O, Mladkova L (2006). The status of micronutrients in tea and tea infusions in selected samples imported to the Czech Republic. Czech J. Food Sci. 24(2): 62-71.
Walkley A, Black CA (1974). Critical examination of rapid method of determining organic carbon in soil, Soil Sc. 63:251-164.
Wang T, Wedin D, Zlotnik VA (2009). Field evidence of a negative correlation between saturated hydraulic conductivity and soil carbon in a sandy soil. Water Resource Research, Vol 45, W07503,
doi:10.1029/2008WR006865.
Waugh D ( 1995). Geography: An Integrated Approach. 2nd Edn., Nelson. UK.
White RE (1987). In: Introduction to the Principles and Practice of Soil Science. English Language Book Society/Blackwell Scientific Publication. London.
Zhu QY, Hickman RM, Ensues JL, Holt RR, Keen CL ( 2002). Antioxidative activity of oolong tea. J. Agric. Food Chem, 50 : 6929-6934.
Accepted 01 August, 2014.
Citation: Nath TN, Krishna BG (2014). Influence of soil texture and total organic matter content on soil hydraulic conductivity of some selected Tea growing soils in Dibrugarh district of Assam. International Research Journal of Chemistry and Chemical Sciences, 1(1): 002-009.