Contents lists available at www.innovativejournal.in
Asian Journal of Computer Science And Information Technology
Journal Homepage: http://innovativejournal.in/ajcsit/index.php/ajcsit
FISH FRESHNESS CLASSIFICATION USING WAVELET TRANSFORMATION AND
FUZZY LOGIC TECHNOLOGY
M. Sornam1, A. Radhika2, M. Manisha3
Department of Computer Science, University of Madras, Chennai - 600 0051,2,3.
ARTICLE INFO
ABSTRACT
Corresponding Author:
Dr. M. Sornam1
Department of Computer Science, University of Madras, Chennai - 600 005.
Key Words: Image processing, Clustering, Wavelet, Coefficient, Haar, Fuzzy Logic, RGB, Mean, Median absolute deviation.
DOI:http://dx.doi.org/10.15520/
ajcsit.v7i2.54Freshness plays a vital role to measure the quality of fish by consumers. The quality of a fish may be affected by characteristic changes deeply which result in a progressive loss of food characteristic in terms of taste and a general concept of quality. The aim of this study is to classify fish freshness based on image processing by using clustering based methods and its features are extracted in the wavelet transformation domain using Haar filter. First and second level decomposition in the wavelet domain is performed and the coefficients obtained at each level have been used as input to fuzzy logic to achieve this objective. There are three types of fuzzy input methods that have been discussed which are Wavelet Mean values divided into 5 parts as per day, Median absolute deviation values are taken as the range of 3 and RGB Mean also has been taken as 3 ranges which are calculated separately. The experimental result indicates better performance based on fuzzy logic in terms of freshness percentage.
©2017, AJCSIT, All Right Reserved.
I. INTRODUCTION
Fish and shellfish are an important source of protein and other nutrients for humans and well-balanced healthful diet. To maximize its value, quality of freshness must be maintained. Most often "quality" refers to the aesthetic appearance and freshness or degree of spoilage which the fish has undergone. The characteristics of fresh fish are the pleasant and neutral smell, shiny and bulging eyes, bright red color gills, naturally metallic glow skin and so on. As with any type of food, however, it is important to handle seafood safely in order to reduce the risk of foodborne illness. It may also involve safety aspects such as being free from harmful bacteria, parasites or chemicals. Physical, chemical, biochemical and microbiological changes occurring post-mortem in fishes, resulting in a progressive loss of food characteristics in terms of taste and a general concept of quality. Human sensory assessment still remains the best and most accurate way of assessing fish freshness. Non-human techniques exist but these can be problematic. There is a number of methods have been used to detect the freshness of a fish.
Quality index method (QIM) is the best way to detect the freshness of the fish which use the characteristic of eyes, gills and skin of the fish. The scope of this work is to construct a method to test the freshness of the fish based on image processing, wavelets decomposition and fuzzy logic. Image analysis is a non-destructive, harmless common tool for evaluating data based on photography and analysis of its color variations through imaging software can be an important method to validate the quality of fish. Image processing can help to
increase the quality of products by relieving man of fatiguing visual check activities. Some work has already been reported in food processing sectors using the image processing.
In this paper, we propose an image processing based method to classify fish freshness. The digital image captured is considered for analysis. The rest of the paper is organized as follows. Section 2 describes the requirements of this paper. Section 3 discusses the proposed methodology and Section 4 provides the experimental result. Finally, the conclusion is presented in Section 5 of the paper.
II. REQUIREMENTS
A. Collection of Fish Samples
Various fresh fish samples of different fishes were collected and hence were analyzed. Five different fishes were taken into consideration and refrigerated to obtain sample for third and sixth day
B. Data Analysis
The digital images of the samples were obtained using the digital camera. The Five samples preserved were respectively captured on the third and sixth day for further analysis. Apart from that other fish images were also captured randomly for reference.
C. Lab space conversion
in jpeg images or images from digital cameras and scanner. It is better suited to many digital image manipulations than the RGB space. In this experiment, input images are partitioned into three segments.
E. ALGORITHM
K-means clustering algorithm
Let X = {x1,x2,x3,……..,xn} be the set of data points and V={v1,v2,…….,vc} be the set of centers.
1) Randomly select ‘c’ cluster centers.
2) Calculate the distance between each data point and cluster centers.
3) Assign the data point to the cluster center whose distance from the cluster center is the minimum of all the cluster centers.
4) Recalculate the new cluster center using:
Where ‘ci’ represents the number of data points in
the ith cluster.
5) Recalculate the distance between each data point and new obtained cluster centers.
6) If no data point was reassigned then stop, otherwise repeat from step 3.
Fuzzy C-means Algorithm
Let X = {x1, x2, x3 ..., xn} be the set of data points and V = {v1, v2, v3 ..., vc} be the set of centers.
1) Randomly select ‘c’ cluster centers. 2) Calculate the fuzzy membership 'µij' using:
3) Compute the fuzzy centers ‘vj’ using:
4) Repeat step 2 and 3 until the minimum 'J' value is achieved or ||U(k+1) - U(k)|| < β.
where,
‘k’ is the iteration step.
‘β’ is the termination criterion between [0,1].
‘U = (µij)n*c’ is the fuzzy membership matrix.
‘J’ is the objective function.
III. PROPOSED METHODOLOGY
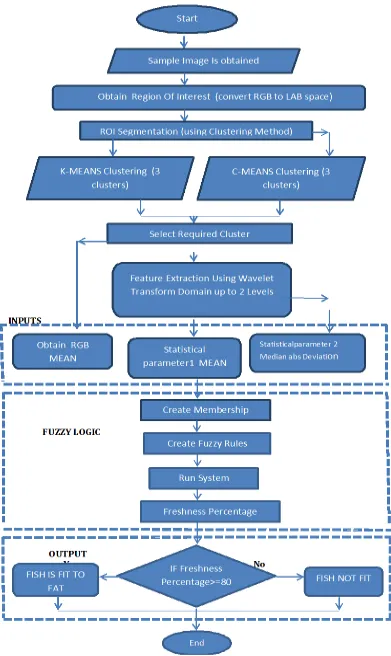
The processes involved in this paper are shown in figure 1.
Fig 1: Process used in Fish Freshness Detection
A. ROI SEGMENTATION
The obtained image is converted from RGB to Lab space (L*a*b). The Lab color space model is matched with our retina perceives colors. Using k-means and fuzzy c-means clustering algorithm, the range of ROI intensity value is obtained. The image is divided into 3 clusters. The desired cluster is selected by the user from obtained clusters and hence RGB mean is also obtained. The cluster containing the gills region may contain some objects other than the gills. These objects are considered as noise and need to be removed. The noise is removed from the selected cluster.
B. WAVELET DECOMPOSITION
Once the cluster is selected the wavelet transformation domain is performed on the true color image or the selected cluster. The decomposition is done up to 2 levels once the decomposition is done respective approximation coefficients of the features are extracted. As wavelet transform domain coefficients have distinct discriminatory features for establishing the freshness levels of the fish as it captures both the spatial and frequency information of an image. Here we consider coefficients of Mean and Median absolute deviation as parameters for freshness detection
C. FUZZY LOGIC
The corresponding member function was created for the inputs there were three inputs and one output for which Gaussian member function and triangular member function was used respectively.
A set of 25 rules were designed to set the criteria to obtain freshness of the given input values. Table1 shows details of all the inputs and output and table2 shows membership function details and table3 shows range of inputs
Table1: Details of inputs and output
TYPE LEVEL
INPUT: Mean Low, High
Median abs Deviation Low, High
RGB Mean Low, High
OUTPUT: Freshness Excellent, good, bad
Table2: Membership function details
Type Name Membership
Function Number Of MFs
Input Median abs dev Wavelet Mean Gaussian Gaussian 5 3
RGB Mean Gaussian 3
Output Freshness Triangular 3
Table3: Membership function Range of inputs
INPUT RANGE
LOW HIGH
Mean 30 160
Median Abs deviation 0 90
RGB Mean 0 40
The flowchart in figure 2 explains the sequence of steps involved in the freshness of fish classification. The user must provide a digital image of fish gill.
IV. EXPERIMENTAL RESULT
Fig 2: Flow chart for proposed methodology
Fig2 represents the sample data that were collected and observed for six days. The Five samples and the image for first third and sixth day are shown day wise.
Fig3 represents the segmented image that has been segmented using clustering methods K-means and C-means algorithm. The same sample has been used to in both methods.
Fig4 represents the wavelet decomposition of the clustered image and the corresponding features of approximation coefficient is obtained
such that difference of K-means and Fuzzy C-means is easily obtained.
Apart from the features the RGB mean of the segmented image is also tabulated this tabulation hence represents the set of inputs we need for further Analysis. Table 6 represents the Range of the output used in the fuzzy logic whereas Fig5 represents the input details of fuzzy logic and also represents the set of 25 rules used in the fuzzy logic also the surface and representation of rules are also represented
Fig3: Segmented Image Using Clustering Method
K-means clustering SELECTED Cluster1
Cluster2 Cluster 3
C-Means Clustering
Cluster1 Cluster 3
SELECTED Cluster 2
We can see that required Region Of Interest is obtained in cluster 1 with respect to K-means clustering algorithm whereas we obtain Region Of Interest in cluster 2 with respect to Fuzzy C-means algorithm.
K-means algorithm is a hard clustering algorithm and on the other hand, Fuzzy C-means is a soft clustering algorithm i.e. K-means algorithm does not allow elements to be overlapped and Fuzzy C-means allows overlapping of elements
Fig 2: Day wise degradation of the fish samples under observation
SAMPLE SAMPLE1 SAMPLE2 SAMPLE3 SAMPLE 4 SAMPLE 5
DAYS
DAY1
DAY3
Fig4: Statistical Features of second level wavelet decomposition in Approximation of fish samples.
Table4: Statistical Features of second level wavelet decomposition in Approximation of 5 fish samples Table4.1: First-day fish samples
SAMPLE C-Means MEAN K-Means C-Means MEDIAN ABS DEV K-Means C-Means STANDARD DEVIATION K-Means C-Means MAX NORM K-Means
1 58.8 59.07 0 0 121.2 121.6 785.3 785.8
2 49.48 54.28 0 0 86.76 90.14 535.5 550
3 45.02 43.13 0 0 80.45 80.06 471 470.5
4 35.19 35.29 1.75 1.75 64.89 64.98 361.5 361.5
5 51.03 58.34 0.75 2.25 96.29 101.7 589 594.3
Table4.2: Third-day fish samples
SAMPLE C-Means MEAN K-Means C-Means MEDIAN ABS DEV K-Means C-Means STANDARD DEVIATION K-Means C-Means MAX NORM K-Means
1 101.4 102.3 0 0 193 194.3 979.5 981.5
2 96 95.48 0 0 180.4 180.7 950.3 941
3 90.89 90 0 0 178.7 178 957.8 957.8
4 64 63.5 0 0 151.4 143 988 989.3
5 88.9 90.2 0 0 165 160 967 975
Table4.3: Sixth-day fish samples
Table5: RGB Mean of fish samples for six days
Sample Day 1 Day 3 Day 6
C-Means K-Means C-Means K-Means C-Means K-Means
1 14.92 14.84 24.22 25.5 39.59 36.31
2 12.35 13.54 24.25 24.09 54.95 53.42
3 11.14 10.77 22.7 22.57 32.25 33.82
4 8.79 8.82 25.87 26.63 25.89 26.21
5 12.85 13.29 25.79 25.92 29.09 28.04
Table6: Output Range
OUTPUT RANGE
Excellent 86-100
Good 61-85
Bad 20-60
Fig5: Fuzzy Inputs and Rules Fig5.1 Fuzzy Input Mean
SAMPLE MEAN MEDIAN ABS DEV STANDARD DEVIATION MAX NORM
C-Means K-Means C-Means K-Means C-Means K-Means C-Means K-Means
1 122.6 127.2 11.25 13.5 178.8 181.1 881.3 881.3
2 159 145.8 19 14.5 211.1 201.4 837.3 841
3 80 83 6.5 7.1 109.8 111.3 446 501
4 126.9 137.4 40 67.5 158.9 163.5 847.5 853.4
Fig5.2Fuzzy Input Median
Fig5.3 Fuzzy Input RGB Mean
Fig5.5 Fuzzy Surface
V. CONCLUSION
In this paper, we have analyzed freshness of the Fish on the basis of features extracted from wavelet domain. We also infer that we find Fuzzy C-Means clustering more suitable than that of K-Means Clustering. We have also put in a relationship between wavelet features and fuzzy logic for analysis of freshness As future work many other criteria can also be included for more accuracy in freshness classification and also this can be implemented for large amount of data sets which will also include error bars for good accuracy
REFERENCES
[1] Image processing based method to assess fish quality and freshness Malay Kishore Dutta, *, AshishIssaca, NavrojMinhasa, BiplabSarkarb a Department of Electronics & Communication Engineering, Amity University, Noida, India b National Institute Abiotic Stress 2.Management, Baramati, Pune 413115, Maharashtra, India
[2] Muhamad F, Hashim H, Jarmin R, Ahmad A, Fish freshness classification based on image processing and fuzzy logic, Proceedings of the 8th WSEAS International
Conference on Circuits, Systems, Electronics, Control &; Signal Processing, World Scientific and Engineering Academy and Society (WSEAS), Stevens Point, Wisconsin, USA, CSECS’09, pp 109e115.
[3] Band, Sowmya, Sheelarani, B., 2009. Colour image segmentation using soft computing techniques. Int. J. Soft Comput.Appl. 4, 69e80. Das, T., Pal, A.K., Chakraborty, S.K., Manush, S. M. , Sahu, N.P., Mukherjee, S.C., 2005.
Thermal tolerance, growth and oxygen consumption of Labeorohita fry (Hamilton, 1822) acclimated to four temperatures. J. Therm. Biol. 30 (2005),
[4] Dubey, Shiv Ram, Jalal, Anand Singh, 2014. Fruit disease recognition using improved sum and difference histogram from images. Int. J. Appl. Pattern Recognit. 1 (2), 199 - 220.