Vol.7 (2017) No. 6
ISSN: 2088-5334
Comparison of the Methods to Estimate Missing Values in Monthly
Precipitation Data
Wahidah Sanusi
#, Wan Zawiah Wan Zin
*, Usman Mulbar
#, Muhammad Danial
$, Syafruddin Side
# #Department of Mathematics, Universitas Negeri Makassar, Parangtambung, Makassar, 90224, Indonesia E-mail: [email protected], [email protected], [email protected]
*
School of Mathematical Sciences, Universiti Kebangsaan Malaysia, Bangi, Selangor DE, 43600, Malaysia E-mail: [email protected]
$
Department of Chemistry, Universitas Negeri Makassar, Parangtambung, Makassar, 90224, Indonesia E-mail: [email protected]
Abstract— Estimation of missing data is essential in the meteorological, climatologically and hydrology analyses. This study employed
the arithmetic mean method, normal ratio method, the modified normal ratio method, and correlation coefficient weighting method. The performance of these methods are then compared using correlation coefficient, the S-index, the root mean squared error and mean absolute error methods. The objective of this study is to determine the best estimation method for missing data for four precipitation stations in Makassar city. The results show that the modified usual ratio method is suitable to estimate the missing precipitation data in Makassar city. This study result could be useful information for climate research to complete the missing precipitation data, especially for rain gauge stations in Makassar city.
Keywords— correlation coefficient; missing values; normal ratio method; precipitation data; S-index
I. INTRODUCTION
Researchers have widely studied issues on climate change. One of the essential indicators of climate change is rainfall pattern. Rainfall patterns changes affect the humidity and aridity events of an area. These can cause problems for the survival of humans and other living creatures. The impacts can lead to the declining in agricultural production such as crop failures, forest fire and decreasing biomass productivity [1]. The other effects are health risks, water availability, and decreasing agri-ecotourism [2]. One of the efforts can be made to anticipate the impact of the rainfall pattern change is through the detecting and monitoring methods for extreme rainfall events. One of the indices has been developed to detect and monitor for extreme rainfall events and to evaluate water supply is Standardized Precipitation Index (SPI) [3], [4]. However, the SPI needs the completeness of data.
An ideal climatic analysis requires the availability of data which covers not only sufficient period but also complete period. Precipitation data is frequently deficient. These can arise because of a diversity of reasons such as the failure of the rain gauge to record a measurement, human error or the rain gauge station closed temporarily. Furthermore, missing
data is one of the major problems in various hydrological researches as it may affect the variable estimation. Procedures for handling missing data can be done by several methods such as imputation, weighting, and modeling [5]. Available precipitation data from neighboring stations often used in estimation methods.
correlation weighting method is superior to the inverse distance weighting method to the missing rainfall values.
Estimating daily missing rainfall data, research in Peninsular Malaysia applied the normal ratio, the different remoteness, and the correlation coefficient weighting methods too. The research also modified both the normal ratio and the inverse distance weighting methods and then applied both modified methods to estimate the missing rainfall values at several rain gauge stations in the peninsula. The methods have been tested using different percentages of missing rainfall data and also within 75 km to 200 km radius. The findings indicated that the performance of the modified methods improved the estimation of missing rainfall values at target stations based on the similarity index, mean absolute error and correlation coefficient methods.
The performances of the estimation methods evaluated at six different percentages of missing data to propose three normal ratio estimation methods to overcome missing data[9]. Forty years daily rainfall data from four meteorology stations considered. For the analysis purpose, Johor Bahru station selected as the target station. The findings revealed that all estimation methods that implemented using proposed approach provided the most accurate estimation results for all percentages of missing data.
Meanwhile, a generalized linear model with gamma and Fourier series was utilized to estimate the missing values in daily rainfall data [10]. In this analysis, forty years daily rainfall data for the period from 1975 to 2014 for seven stations at Kelantan region selected. The results showed the imputation could afford new precise assessment values derived from the smallest amount mean absolute error, root mean squared error, and coefficient of variation root mean squared.
Nine single imputation techniques were employed to determine the best technique for estimating missing values when fitting Weibull distributions [11]. Simulation technique used to attain random variables for this distributions. Samples of sizes 30, 50, 200 and 300 were used to simulate the Weibull distribution. Presentation of the best attribution technique based on four error measures including the normalized absolute error, root mean square error, index of agreement and root mean square error.
In this paper, the arithmetic mean method, the normal ratio method, the modified normal ratio method, and the coefficient of correlation weighting method will be used to estimate missing data at four rain gauge stations in Makassar city. The performances of these methods evaluated by calculating the correlation coefficient (R), the similarity index (S-index), the root mean squared error (RMSE) and the mean absolute error (MAE) values, respectively.
II. MATERIAL AND METHOD
A. Study Area and Data
Indonesia climates are influenced by tropical monsoons. In general, the dry season occurs from May to September and the rainy season extends about six months, i.e., from November to April. The annual precipitation of Indonesia is 2000 mm, which is more than 80% occur in rainy season
Makassar is the capital of South Sulawesi, Indonesia, and located between 5º 8' 6'' South and 119º 24' 17'' East. Makassar is located in the sub-tropical humid region and covers an area of about 199.26 km2. Makassar’s climate is tropical with an average temperature ranging from 26.2º C to 29.3º C as well as the annual average of monthly rainfall is about 256.08 mm [13].
In this study, the monthly precipitation amount data (in mm) from four rain gauge stations in Makassar city used. The data were obtained from Department of Water Resources Management of South Sulawesi province and the Meteorological, Climatological, and Geophysical Agency (BMKG) Region IV of Makassar from 1985 to 2014. The stations chose not only based on the completeness of data but also on the period of records available. All of the stations have missing data less than 15% (Table 1).
TABLEI
THE RAIN GAUGE STATIONS,GEOGRAPHIC COORDINATES, AND THE
PERCENTAGE OF MISSING DATA
Name of Stations Latitude
(South) Longitude (East) Missing (%) Maritime Meteorological of Paotere (MMP) 9.4
Biring Romang of Panaikang (BRP) 13.9 BBMKG Region IV (BBMKG) 13.3 Ujung Pandang (UP) 12.8
B. Estimation Methods
Several methods used to estimate the missing precipitation data, among others, the arithmetic mean method (M), the normal ratio method (NR), the modified normal ratio method (MNR), and the coefficient of correlation weighting method (CCW). The M method substitutes the missing value with arithmetic mean value of adjacent stations where the parallel data are available.
The arithmetic mean method is expressed by
==
N j j xP
N
P
11
(1)where is the estimated value of the missing data for the
station , is precipitation data of the adjacent station. Further, the NR method is recommended to estimate the missing data from the mean ratio between station with missing value and other stations where corresponding data are available [14], [15]. The missing value is calculated by
j N j j x x
P
N
P
=
=
11
µ
µ
(2)where is the estimated value of the missing data for the station , is precipitation data of the adjacent station, and are the mean annual precipitation value of the station and the adjacent station respectively, while is a number of adjacent stations.
coefficient between the station with missing data and the adjacent station ([16], [8]). The equation for this method is given as j N x j j N x j j jx jx j jx jx j x
P
r
r
m
r
r
m
P
≠ = ≠ = − −
−
−
−
−
=
1 1 1 2 2 1 2 2)
1
(
)
2
(
)
1
(
)
2
(
(3)• is the estimated value of the missing data for the station.
• , is precipitation data of the adjacent station.
• is the correlation coefficient of monthly time series
data between station with the missing data and the adjacent station.
• is the length of data series that are used to compute the coefficient of correlation,.
• Is the number of adjacent stations.
Another method is the coefficient of correlation weighting method. When estimating the missing data, this method takes into account the correlation coefficient between the station with the missing data and the adjacent station [8]. The equation of this method given as follows j N x j j N x j j jx jx x
P
r
r
P
≠ = ≠ =
=
1 1 2 2 (4)where is the estimated value of the missing data for the station , is the precipitation data of the adjacent station, is the correlation coefficient of monthly time series data between the station with the missing data and the adjacent station, while is the number of adjacent stations
C. Comparison of Estimation Methods
The steps to compare the estimation methods for missing data begun by step one by the selection of one station to represent station with the missing value. Step two comprises a pace to remove 5% of data from selected stations. Step three used the remaining data and data from neighboring stations to estimate the missing values using M method, NR method, MNR method, and CCW method followed. Step four was the performances of each estimation method are compared using the correlation coefficient (R), the similarity index (S-index), the root mean squared error (RMSE) and mean absolute error (MAE). Finally, step two and four repeated for 10% and 15% missing values.
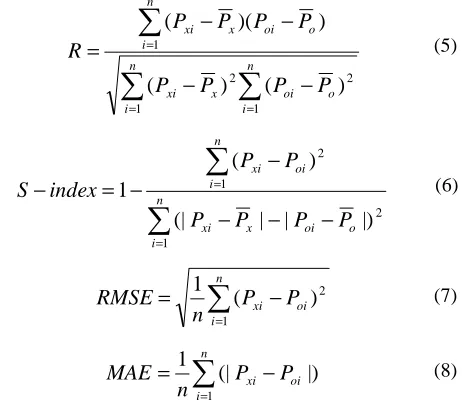
The formula of the indicators is given by
= = =−
−
−
−
=
n i n i o oi x xi n i o oi x xiP
P
P
P
P
P
P
P
R
1 1 2 2 1)
(
)
(
)
)(
(
(5)
= =−
−
−
−
−
=
−
n i o oi x xi n i oi xiP
P
P
P
P
P
index
S
1 2 1 2|)
|
|
(|
)
(
1
(6)
=−
=
n i oi xiP
P
n
RMSE
1 2)
(
1
(7)
=−
=
n i oi xiP
P
n
MAE
1|)
(|
1
(8)where and represent the estimated value and the actual value of the observation respectively, and are the mean of and respectively, and is the number of observations.
The performances of four indicators are used to find out the best estimation methods for each station. The correlation coefficient represents the relationship between the estimated values with the actual values. The R-value ranges from -1 to 1. The best estimation method gives the highest R-value. Meanwhile, the S-index represents the percentage of agreement between the estimation values with the observed values. It takes on values between 0 and 1 with values closer to 0 implying complete disagreement, whereas value 1 for perfect agreement [8], [17]. Furthermore, the RMSE and MAE indicators measure the average error between the estimated and the observed value. The lowest RMSE and MAE values considered as a better model.
III.RESULTS AND DISCUSSION
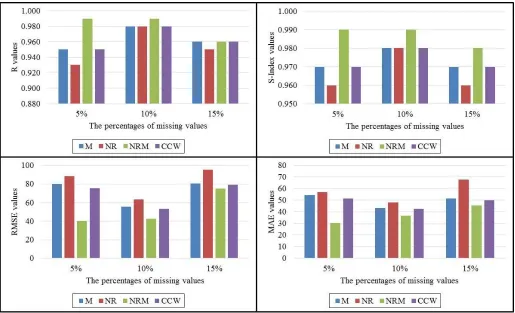
Table 2 and Fig. 1 show that for 5% missing precipitation values at the MMP station, the M, MNR, and CCW methods have the highest R-value in which these methods have the same values. For 10% missing values, the M, NR, and CCW methods have the highest R-value. For 5% and 15% missing values, all methods give the same S-index values and the same R values, respectively. Likewise, the CCW method gives the lowest RMSE value, respectively, for 5% and 15%. Meanwhile, the lowest MAE values are given by the MNR method for all percentages of missing values, and also for 10%, the highest S-index value and the lowest RMSE value respectively.
three achieved through the MNR method, except for 15%, the M, MNR and CCW methods have the same R-value.
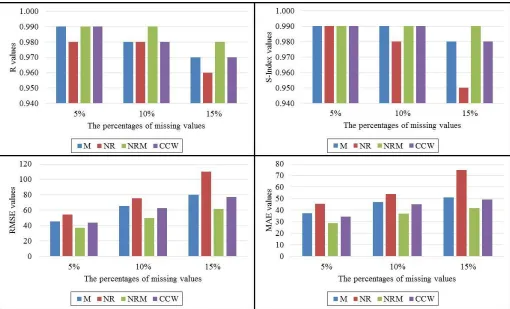
Table 2 and Fig. 4 also displays that for 5% at UP station, the M, MNR, and CCW methods give the same R-value. Meanwhile, the MNR method gives the highest R-value for 10% and 15%. For 10%, the highest S-index was given by the M, MNR, and CCW methods, while MNR method for 15%. Meantime, the MNR method also has the lowest
RMSE and MAE values for all percentages of missing values.
Based on Table 2 and Fig.1 – Fig.4, briefly, Table 3 displays performance of the best estimation methods for each station based on the four indicators with various percentages of missing values. This table shows that in general, the modified normal ratio method is suitable for estimating missing data in Makassar city.
TABLEII
PERFORMANCE INDICATORS OF THE FOUR METHODS WITH VARIOUS PERCENTAGES OF MISSING VALUES FOR EACH STATION
Stations Methods Indicators
R S-index RMSE MAE
5% 10% 15% 5% 10% 15% 5% 10% 15% 5% 10% 15%
MMP
M 0.97 0.98 0.97 0.98 0.98 0.99 66.40 88.56 70.59 48.33 57.50 52.31
NR 0.96 0.98 0.97 0.98 0.97 0.97 68.13 119.71 98.86 49.51 82.85 67.18
MNR 0.97 0.97 0.97 0.98 0.99 0.99 67.40 82.83 70.10 45.60 48.60 49.08
CCW 0.97 0.98 0.97 0.98 0.98 0.99 65.67 87.03 69.87 47.39 55.33 51.38
BRP
M 0.99 0.98 0.97 0.99 0.98 0.97 44.44 84.25 99.63 34.00 60.29 75.14
NR 0.99 0.98 0.97 0.99 0.98 0.96 47.16 88.87 122.33 32.57 63.92 92.31
MNR 0.99 0.98 0.97 0.99 0.99 0.98 42.93 71.75 94.12 30.59 52.44 60.65
CCW 0.99 0.98 0.97 0.99 0.98 0.97 43.03 82.25 98.18 32.94 58.53 72.35
BBMKG
M 0.95 0.98 0.96 0.97 0.98 0.97 79.92 55.50 80.63 54.42 43.36 51.47 NR 0.93 0.98 0.95 0.96 0.98 0.96 88.27 63.39 95.19 56.98 48.00 67.58
MNR 0.99 0.99 0.96 0.99 0.99 0.98 40.17 42.38 74.75 30.34 36.56 45.50
CCW 0.95 0.98 0.96 0.97 0.98 0.97 75.37 53.23 79.32 51.46 42.51 49.82 UP
M 0.99 0.98 0.97 0.99 0.99 0.98 45.56 65.70 80.17 37.23 47.07 51.10
NR 0.98 0.98 0.96 0.99 0.98 0.95 54.28 75.56 109.80 45.42 54.14 74.73
MNR 0.99 0.99 0.98 0.99 0.99 0.99 37.16 49.80 61.52 28.94 36.90 41.71
CCW 0.99 0.98 0.97 0.99 0.99 0.98 43.58 62.66 77.18 34.24 45.33 49.20
The bold indicates the highest R and S-index values and the lowest RMSE and MAE values
Fig. 2 Comparison of each indicator for various percentages of missing values by the four estimation methods for BRP station
Fig. 4. Comparison of each indicator for various percentages of missing values by the four estimation methods for UP station
TABLEIII
THE BEST ESTIMATION METHODS FOR EACH STATION
Stations Percentage of
missing values
Indicators
R S-Index RMSE MAE
MMP 5% M, MNR, CCW M, NR, MNR, CCW CCW MNR
10% M, NR, CCW MNR MNR MNR
15% M, NR, MNR, CCW M, MNR, CCW CCW MNR
BRP 5% M, NR, MNR, CCW M, NR, MNR, CCW MNR MNR
10% M, NR, MNR, CCW MNR MNR MNR
15% M, NR, MNR, CCW MNR MNR MNR
BBMKG 5% MNR MNR MNR MNR
10% MNR MNR MNR MNR
15% M, MNR, CCW MNR MNR MNR
UP 5% M, MNR, CCW M, NR, MNR, CCW MNR MNR
10% MNR M, MNR, CCW MNR MNR
15% MNR MNR MNR MNR
IV.CONCLUSION
The arithmetic mean method, the normal ratio method, the modified normal ratio method, and coefficient of the correlation weighting method have been used to estimate the missing data at four precipitation stations in Makassar city. These methods tested with various percentages of missing data, i.e., 5%, 10% and 15%. The correlation coefficient determines the best estimation method, the similarity index, the root mean squared error and the mean absolute error.
The study reveals that for all percentages of missing data, the modified normal ratio method is more suitable for estimating missing precipitation data in Makassar city as
precipitation data, apart from the selection of the best estimation method, we should also consider the determination of the neighboring stations, so that the estimated value has the higher level of accuracy and precision.
ACKNOWLEDGMENT
REFERENCES
[1] R. Herdianto, E.R. Syofyan, S. Hanwar, B. Istijono, Dalrino, “The investigation of 1997 and 2015 El Nino events in West Sumatera, Indonesia”, IJASEIT, vol. 7, no. 2, pp. 418 – 423, 2017.
[2] H.A. Hidalgo, “Vulnerability assessment of agri-ecoturism communities as influenced by climate change”, IJASEIT, vol. 5, no. 6, pp. 418 – 423, 2015.
[3] W. Sanusi, K. Ibrahim, “Application of loglinear models in estimating wet category in monthly rainfall”, Sains Malaysiana, vol. 41, no. 11, pp. 1345 – 1353, 2012.
[4] W. Sanusi, A. A. Jemain, W. Z. W. Zin, M. Zahari, “The drought characteristics using the first-order homogeneous Markov chain of monthly rainfall data in Peninsular Malaysia”, Water Resources
Management, vol. 29, no. 5, pp. 1523 – 1539, 2015.
[5] R.J.A. Little, D.B. Rubin. Statistical Analysis with Missing Data. New York: Wiley, 2002
[6] R.P. De Silva, N. D. K. Dayawansa, D. Ratnasiri. A comparison of methods used in estimating missing rainfall data. Agricultural
Sciences, Vol. 3, no. 2, pp. 101-108, 2007.
[7] R. S. V. Teegavarapu, V. Chandramouli. Improved weighting methods, deterministic and stochastic data-driven models for estimation of missing precipitation records. J. Hydrol. Vol. 312 pp. 191-206, 2005.
[8] S. Jamaluddin, S. M. Deni, A. A. Jemain. Revised spatial weighting methods for estimation of missing rainfall data. Asia-Pacific Journal
of Atmospheric Sciences, Vol. 44, no. 2, pp. 93 – 104, 2008.
[9] S.N.Z.A. Burhanuddin, S. M. Deni, N. M. Ramli, “Normal ratio in multiple imputation based on Bootstrapped sample for rainfall data with Missingness ”, International Journal of GEOMATE, Vol.13, no. 36, pp.131-137, 2017.
[10] N. A. Rahman, S. M. Deni, N. M. Ramli, “Generalized linear model for estimation of missing daily rainfall data”, AIP Conference
Proceedings, Vol.1830, no. 1, 2017.
doi: http://dx.doi.org/10.1063/1.4981003
[11] A. S. Yahaya, N. A. Ramli, F. Ahmad, N. M. Nor, M. N. H. Bahrim, “Determination of the Best Imputation Technique for Estimating Missing Values when Fitting the Weibull Distribution”, International
Journal of Applied Science and Technology, Vol. 1, no. 6, pp. 278 –
285, 2011.
[12] N. Bafdal, “Rainfall harvesting as resources of self watering fertigation system with various growing medias”, IJASEIT, vol. 6, no. 5, pp. 787 – 792, 2016.
[13] Central Agency on Statistics of Makassar city. Makassar in Figure
2010. Makassar: UD Areso, 2010.
[14] J.L.H. Paulhus, M. A. Kohler. Interpolation of missing precipitation data. Mon. Wea. Rev. Vol. 80, pp. 129 – 133, 1952.
[15] J. D. Salas. Precipitation. Department of Civil and Environmental Engineering, Colorado State University, CE 322, 2006.
[16] K. C. Young. A three way model for interpolating monthly precipitation values. Mon. Wea. Rev. Vol. 120, pp. 2561 – 2569, 1992.