Published online December 20, 2013 (http://www.sciencepublishinggroup.com/j/jfa) doi: 10.11648/j.jfa.20130104.11
Evolution of accounting equation: evidence of companies
quoted on Dar es Salaam stock exchange-Tanzania
NTUI Ponsian Prot
St. Augustine university of Tanzania, Mwanza, Tanzania
Email address:
ponsianproti@yahoo.comTo cite this article:
NTUI Ponsian Prot. Evolution of Accounting Equation: Evidence of Companies Quoted on Dar es Salaam Stock Exchange-Tanzania. Journal of Finance and Accounting, Vol. 1, No. 4, 2013, pp. 55-63, doi: 10.11648/j.jfa.20130104.11
Abstract:
This paper attempts to explain how an accounting equation evolves overtime. The paper looks at the accounting equation by using trade off theory and positive accounting theory lenses. The accounting equation is viewed as living or dynamic and changes according to human behavior or managers of company’s behavior. Regression model and descriptive statistics are used to show the relationship between total assets, liabilities and owners’ equity. The model is then used to show new form of accounting equation, rates of change of liabilities and owners’ equity. In this paper the writer finds new approaches or looks at accounting equation, the rates of change of liabilities and capital in relation to assets and shows the proportion of the two components of assets i.e. liability 64% and capital 36% to the asset. Finally the researcher explains the constant term which is not explained by authors of accounting field. This paper shows for the first time new form of accounting equation, different rates of change for the two components of assets and finally proportions of the owners’ equity/ capital and liabilities components on assets.Keywords:
Accounting Equation, Capital Structure, Assets, Liabilities, Capital, Rates, Proportions, Tanzania1. Introduction
The accounting equation is an equation which shows the equality or relationship between assets of the company, liabilities and the capital BPP Learning Media (2009). The accounting equation is highly applied as a balance sheet or in statement of financial position and is a basis for financial accounting, Strathmore (2009). The accountants and authors of accounting literature and the professional bodies both international and local simply give an accounting equation as A=L+C, where A equals to total assets of the company, L being total liabilities or obligations of the company and C is companies’ owners equity or capital. This equation implies that liabilities and capital change at the same rate to affect Assets and also a business owner or company’s assets are the function of liabilities and capital only.
The equation shows also that, assets are equally contributed by liabilities and capital at the ratio of: 1:1.This may not be the case since decisions made by managers to choose either liabilities or capital to finance the assets may be complex. The researcher suggests that accounting equation should have a different form expressed as, A = ƒ (L, C, β0) i.e. A = β0+ β1L + β2C+ε as shown in the
statistical results.
Where β0 is the constant term, β1 being the rate of change
of assets per unit change in liabilities and β2 is the rate of
change of assets per unit change in capital or owners equity. Here the constant term may explain so many business activities, for example, type of business, type of assets, loan and capital location and human capital. These make an important part of business and show that even when L is zero (no liability and C is zero (before obtaining capital or loan) a business man or woman may be having an idea, place to do business, skills and even how to get funds. These variables and more which are unexplained make an important part β0 which is ignored in traditional accounting
equation, professional bodies and literature.
The study aims to determine the way accounting equation evolve overtime due to complex behaviors of managers in decision making specifically capital structure decisions. The evolution of the accounting equation may result to different rates of change between liabilities and capital to affect assets and also the contribution of liabilities and capital to assets may be different in the company’s capital structure.
of this study the researcher would like to solve the following problems: what may be new accounting equation, what are rates of change of assets as liabilities and capital change and what are proportions of total liabilities and total capital to total assets.
1.1. Problem Statement
The study aims to find out how accounting equation changes from its origin due to many factors affecting managers in choosing either capital or debt to finance company’s assets. Motivation for this study is driven from the behavior of managers to maximize their utility (positive accounting theory) which result to ensure that they meet targets of debt finances they set (Trade off theory).These two theories focusing on the protection of the interests of the decision makers specifically managers may change the capital structure or accounting equation in different ways. The accounting equation may be different from the traditional one, the rates of change of assets may be different as liabilities change from capital change and finally the proportions of capital and liabilities may be different to meet managers’ interests.
The study is particularly interesting in Tanzanian environment where there are limited sources of funds and companies strive to obtain finances mostly from debts regarding the importance of banks in the firm’s external financing. The reliance heavily on a single source of finance may be due to weak capital markets in Tanzania and hence a heavy reliance on bank loans (DSE Handbook, 2008).The study therefore establishes how the accounting equation changes in the situation of limited sources of funds and managers behavior to protect their interests.
Studies done to date explain that more debt than capital is preferred but they don’t give specific figures, factors affecting choice of capital structure, unresolved in accounting profession, inclusion of human capital and skills in the balance sheet or statement of financial position, technical and conceptual ambiguity and how to translate foreign currencies. There is no study talking about how these variables change as well as the proportions of variables (i.e. liability and owners equity) and finally how accounting equation changes as time goes or as managers protect themselves.
This study bridges this gap by determining how the accounting equation changes from its traditional form to the new form as managers make decisions in this complex business world, proportions of total liabilities and total capital to total assets and finally rates on how assets change as liabilities and capital change as managers make decisions on choice between equity and liabilities.
2. Literature Review
The description of accounting equation in accounting literature is simply stated in its simplicity as Accounting equation: A = C + L. Accounting literature does not explain explicitly accounting equation but focuses on capital
structure. Since capital structure is the composition of firms’ liabilities and owners equity Karadeniz et al (2009), and accounting equation is the equation which show the relationships or equality among assets, liabilities and owners equity(BPP Learning media 2009,Strathmore 2009), the capital structure literature is used in this study to describe accounting equation.
2.1. How Accounting Equation Behave Overtime
Capital structure in any organization or company is determined by various factors. The following authors have found varying factors influencing capital structure: Al-Najjar Taylor (2008) determines profitability, firm size, growth rate, market to book value and liquidity. Karadeniz et al (2009) determines effective tax rate, tangibility of assets, and return on assets, Bokpin and Arko (2009) determines ownership structure and corporate governance as factors influencing capital structure decisions and Abor and Biekpe (2009) shows firm age, size, profitability and growth as factors influencing managers to choose capital structure. Bokpin and Arko (2009), explains volatility in earnings, assets tangibility, dividend payout ratio and profitability as factors affecting choice of capital structure.
These factors may make choice of capital structure to be complex not just a factor of debit-DR and credit-CR i.e. double entry action and hence change the accounting equation.
The literature or previous studies explain the relationship between capital structure and firms’ performance in that capital structure influences or affects firms’ performance. Though the study by Ebaid (2009) argues that capital structure choice decision has weak to no impact on firm’s performance and supported by Modigliani &Miller (M&M, 1958) who claim that the value of the firm is not affected by capital structure but rather its real assets it contradicts (Harris and Ravin 1991, Graham and Harvey 2001, Brav et al 2005, Rodden and Lewellen 1995, Chapion 1999, Ghosh et al 2000 and Hadlock and James 2002) who show positive relationship between capital structure and firms performance .In contrast (Fama and French 1998, Gleason et al 2000 and Simmerly and Li 2000) show that capital structure has negative influence in firm’s performance. Due to these mixed results, to find an optimal capital structure is not one way to go (Myers 2001 and Eldomiaty 2007).
question is what is acceptable level/proportion of capital and liabilities?
Capital structure debate is closely related to the work of Modigliani and Miller (1958) quoted in Al-Najjar and Taylor (2008) who suggest that in a world without friction, there is no difference between debt and equity financing as regards the value of the firm. In 1963, they maintained that the interest payments of debt decrease the tax base thus the cost of debt is less than the cost of equity. Although optimal capital is a widely investigated topic for years no model has been found to fully explain the optimal capital structure of the firm (Karadeniz et al (2009).
Capital structure decisions are largely influenced by corporate governance and ownership structure. Managerial shareholdings is positively and significantly influences choice of long term debt over equity and Board size significantly influence capital structure choice Bokpin and Arko (2009) though capital structure is voluntarily chosen by managers.
An ownership impact to capital structure was also confirmed by (Bajaj et al 1998, Mehram 1992 and Brailsford et al 2002) who show that managerial ownership is negatively related to debt ratio. Claessens et al (2002) maintains that better corporate governance framework benefit firms through greater access to financing, lower cost of capital, better performance and more favorable treatment of stakeholders and corporate governance correlates with financing decisions and capital structure of firms (Graham and Harvey 2001, Litov 2005, and Abor 2007)
To show that ownership structure and corporate governance have an impact to capital structure, Brailsford et al (2002) indicates that there is U-shaped relationship between leverage and managerial ownership, Pindado and la Torre 2005 states that insider ownership does not affect debt when interests of owners and managers (agents) are aligned. This means that where interests are not aligned insider ownership affects debt.
Anderson and Reeb (2003) show that family ownership reduces the cost of debt financing and Brailsford et al (2002)indicates that firms with external block holders have less debt while Cheng et al (2005) shows that leverage increases with ownership concentration.
The studies by Wen et al (2002), Anderson et al (2004) and Abor (2007) still insists that higher board is associated with larger debts. Other literatures show that there is negative relation between CEO tenure and leverage to reduce performance pressures as shown by (Wen et al 2002, Keyhan 2003, Bertrand and Mullainathan 2003).This is opposed by Forberg (2004) and Abor (2007) who show positive relation between capital structure and CEO duality and there is more debt as duality increases.
These studies show that the capital structure or accounting equation is affected by many factors which result to complex decisions in choosing either debt or equity to finance the total assets. This leads us to the hypothesis one, which states:
H1: The accounting equation overtime does not have the form of Assets = Capital + Liabilities.
2.2. The Rates of Change of Total Assets for Change in Total Liabilities and Capital
The question whether the companies manage their capital structure knowingly (trade off theory) or observed capital structure is a result of random process determined by historical profitability, investment options, dividend policy and capital market conditions (pecking order and market timing theories) is not answered as there is still no consensus reached Seppa (2008 ).
Neither of the two theories provide satisfactory description of capital structure choices in practice (Gaud et al 2004,Graham and Harvey 1999) and also companies do have a target leverage ratio which they pursue in long run since pecking order dominates in short run (Mayer and Sussman 2004,Tucker and Stoja 2004,and Fahal et al 2006).
The speeds of adjustment to attain a targeted level of leverage (trade off theory) vary from different studies as shown here under. Farhat et al (2006) show adjustment speed of 19-48 percent, Flannary et al (2004) 1/3 per year, Huang and Ritter (2007) speed of 11-21.1 percent per year (book value) and 16.1-22.3 percent per year market value.
The slow adjustment speed back pecking order theory than target leverage models.de Haas and Peeters (2004),had an average speed of 17% in 2000-2001,Nivorochkin (2004) had 19.4% in 1997-2001 all these studies including Sander 2003 support target leverage ratios or trade off theory.
Joeveer (2006), states that profitability of unlisted firms lead to lesser credit which is consistent with pecking order theory and finds that business size has positive impact on observed leverage. Also the younger firms are more leveraged than old ones (Klapper et al 2002, Joeveer 2006). The evidence showing that trade-off theory is followed is weak Seppa (2008). The reasons are high adjustment costs of capital restructuring which affect the capital structure choices or low level of specific knowledge of corporate finance which makes it difficult to sufficiently explain the investment projects to credit providers, (Leary and Roberts 2005, Gaud et al 2004 and Ju et al 2002).The management of capital structure in either way i.e. knowingly or randomly as well as adjustments speeds to attain a target level of leverage may result to different rates of change in liabilities and capital. This leads us to the second hypothesis stating,
H2: The rates of change of total assets due to change in total liabilities and capital or owners equity in accounting equation are different.
2.3. Proportion of Liabilities and Capital to Assets
and Harvey 2001, Litor 2005, and Abor 2007) show that, decision to choose capital structure is influenced by many factors like profitability, firm size, growth rate, market to book value and liquidity. The effective tax rate, tangibility of assets, and return on assets, ownership structure and corporate governance firm age and volatility in earnings, assets tangibility and dividend payout ratio are also factors affecting decision to choose capital structure. These factors therefore cause managers to choose either debt or owners equity to finance business assets. These decisions may result into different proportions of capital and liabilities to total assets.
The speeds of adjustment to attain a targeted level of leverage as shown in (Farhat et al 2006, Flannary et al 2004, Huang and Ritter 2007, de Haas and Peeters 2004, Nivorochkin 2004 Sander 2003) also cause more debt finance component than owners’ equity. Due to these mixed results, to find an optimal capital structure is not one way to go (Myers 2001 and Eldomiaty 2007).
Since these factors affect managers’ decisions in either to have more debt or owners equity in the capital structure, the two components i.e. capital and liabilities should have different proportions depending on managers’ interests. This leads us to the third hypothesis which says:
H3: Total liabilities and capital or owners equity in the accounting equation have different proportions to total assets.
3. Methodology
The study investigates how accounting equation changes overtime and the form of accounting equation after so many factors involved. The traditional accounting equation is so simplified and may not explain real world situations/ problems as it is complex with full of uncertainties and intangibles.
The study is quantitative in nature in which the regression analysis model is used to show how variables have evolved overtime. The Ordinary Least Square (OLS) regression model is chosen over other techniques to obtain computer output for statistical interpretations. The pie chart is used to show the proportions of liabilities and capital to total assets.
3.1. Sample
The study focuses on all (15) companies listed on Dar Salaam Stock Exchange (DSE) from the year 2005 to 2008 where Tanzania effectively adopted IFRSs. The adoption of IFRSs made financial statements to be comparable and also of high quality. Since the sample is small, the study uses panel data to ensure higher number of observations is attained. The total observation in this study is 60 which may give accuracy of the results obtained. Listed companies are selected due to the World Bank report (2005) that, they adhere to quality reporting IFRS’s and their wide base of inventors as well as the role they play in the national economy.
3.2. Data Collection
Annual reports of companies are used to obtain data from 2005 through 2008. The values of total assets, liabilities and owners equity or capital are obtained from the companies’ statements of financial position and regressed together. The financial statements of the years 2005 through 2008 are used because Tanzania effectively started to use International Financial Reporting Standards (IFRS’s) in 2005 and the annual reports of companies for 2009 and 2010 for some companies are not available.
3.3. Model
Due to lack of models used to describe the accounting equation, the researcher uses a regression analysis tool to achieve the objectives. This tool is justified by (Ntui, 2010, Missonier, 2004, Inoue and Thomas, 1996) who agree that regression equation is a measure of significance of the variables and also the power of the model.
A = ƒ (L, C), this statistically means that, total assets of the company is a function of owners equity and liabilities.
Where A is Total assets of the company 1. L is the total liability of the company 2. C is total owners Equity
According to Pandey (2007), Assets are company’s properties and resources which have future benefits for the company. Basing on accounting period concept, assets are classified as current and fixed assets. Liabilities are obligations to pay cash or provide goods or services in future and Capital is the investment of saving by owners of business.
3.4. Data Analysis
Minitab computer software is used to determine the relationship among variables and interpretation of data. Correlation matrix is used to show how variables correlate to one another, P values for each variable and model as well as F-test is also shown to reveal the significance of the model. The variables are also shown to indicate the power of presentation (of A by C and L) and VIF will be shown to show if the problem of multicollincarlity exists. The Pie chart is then drawn to show how the liabilities and capital share in financing companies assets.
4. Findings
The following are the findings of the study focusing on answering the research question:
4.1. Evolution of Accounting Equation
show that A has positive correlation with C and L as supported by (Strathmore 2009 and BPP LEARNING MEDIA 2009).
All the variables are statistically significant at 1%. The justification of the new form of accounting equation is evident as even the constant term is also highly significant at 1%. The VIF is then confirms that there is no multicollineality and hence variables are independent.
Table 1. Regression Analysis, the regression equation is A = 44802 + 1.10 L + 0.147 C S = 92698.2
Predictor Coef SE Coef T P VIF
Constant 44802 14182 3.16 0.003
L 1.10376 0.02260 48.84 0.000 1.1
C 0.14709 0.04727 3.11 0.003 1.1
R-Sq = 98.0% R-Sq (adj) = 97.9%
4.2. Rates of Change of Assets for Change in Liabilities and Capital
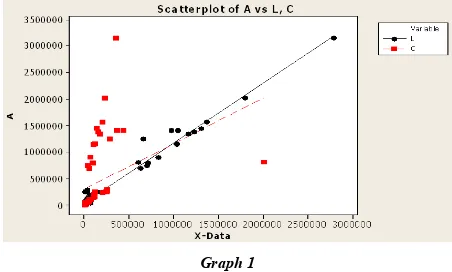
Results in Table 1 supported by graph 1 show that rates of change of liabilities are higher than rates of change of capital. These rates indicate that changes in either of the two variables affect assets differently. As shown in this result by the coefficients of L and C, for every single unit change in liability and capital assets change by 1.1 times and 0.147 times respectively. This also may be shown by the slopes of graph 1 and the trend also, the graphs show that capital increases at lower rates than liabilities.
The graph of Liabilities and Capital in Graph 1 indicates how they differ in the rates of changing Assets. Assets seem to increase at very high speed as Liabilities increase; this is proved by steeper slope of Liabilities as compared to Capitals slope.
The graph reveals that initially companies start with higher capital or owners’ equity than debt or liabilities. The change in time therefore shows how these two components vary. The results here support the trade off theory which states that managers choose capital structure to attain targeted level of leverage in the long run (Farhat et al 2006, Flannary et al 2004, Huang and Ritter 2007, de Haas and Peeters 2004, Nivorochkin 2004 Sander 2003).The higher levels of capital in the beginning and lower levels as time goes or company grows are in line with the conclusions that pecking order dominates in short run (Mayer and Sussman 2004,Tucker and Stoja 2004,and Fahal et al 2006).
The liabilities start to increase faster than capital and reaches a time where it becomes equal to capital or owners equity. There after the increase in liabilities dominates owners’ equity so as to attain the targeted level of leverage (trade off theory) .The important point discovered in this result is the point where owners’ equity equals to Liabilities. The question is what is this point and when is it reached?
Graph 1
4.3. Proportion of Liabilities and Capital to Assets
The researcher found that it is important to know the average proportion of L and C to the total assets in the accounting equation. This was simply done by computing total assets, total liabilities and total owners equity and use pie chart to determine out of 100% as total of L and C which means it is the total A what proportion each variable occupy?
According to (Farhat et al 2006, Flannary et al 2004, Huang and Ritter 2007, de Haas and Peeters 2004, Nivorochkin 2004 Sander 2003) businesses prefer more debt than debt equity. The findings below support more debt than owners’ equity on average by showing the proportions of total liabilities and total capital to total assets.
Pie chart 1
Basing on the concept of accounting equation that total assets equals to the sum of liabilities and capital and assuming the new accounting equation holds to include other elements in the accounting equation, the total assets forms 100% of the equation in the left hand and the other elements both included and un-included liabilities and capital form another 100% in the right hand of the equation.
Table 2. Analysis of Variance (ANOVA)
Source DF SS MS F P
Regressi
on 2 2.36088E+13 1.18044E+13 1373.73 0.00
Residual
Error 57 4.89799E+11 8592963201
Total 59 2.40986E+13
Durbin-Watson statistic = 1.30667
Table 2 measures the significance of the model. P value and F-test confirms that the model is statistically highly significant at 1% and hence explains significantly the research problem.
The correlation matrix in table 3 indicates that, there are low correlations (0.307) between liabilities and capital showing that the two variables are independent to one another. The two variables i.e. liabilities and capital are highly correlated with total assets (0.988) and (0.359) respectively meaning that, they are associated with, and this confirms that assets are the function of capital and liabilities.
Table 3. Correlation matrix
A L C
A 1
L 0.988 1
C 0.359 0.307 1
Cell Contents: Pearson correlation P-Value
Where A=Total Assets, L=Total Liabilities and C=Total Capital or Owners Equity
5. Discussions
The accounting equation changes overtime from the simple bookkeeping equation to complex one. The change in accounting equation may be due to managers’ complex decisions to maximize their own welfare. Though the accounting literature does not show a constant term, this paper indicates its existence. The accounting equation therefore takes a form of A = β0+ β1L + β2C instead of traditional accounting equation A = C + L. These results are in line with Sheedy-Gohil (1996) who finds that there are still things not involved in balance sheet and propose involvement of value of skills in the balance sheet. Sheedy-Gohil insists also if we cannot explain goodwill and potential goodwill in assets terms they do not make sense. Grojer, (1993) show clearly that there is a need to make development of balance sheet model. The study by Grojer found that the development of balance sheet model seems to make sense but still unclear if it makes a company better and seems to challenge the (elite) social order in organization.
This study proposes new approach to accounting equation as supported by Macintosh and Baker (2002) who calls for new approach for making accounting for an
enterprise an on-going conversation rather than a monologist process of closing down on a single meaning. New direction on looking accounting equation should be taken so as to present real world’s problems as also be stated in Carnegie and Napier (1996) and that recent research has begun to demonstrate a critical and interpretive tendency and suggest directions in which this research might develop as accounting and its history enters the 21st century.
Total liabilities and total owners’ equity change total assets at different rates as indicated in the regression results. Assets change at the rate of 1.1 units for each unit change in liability and at 0.147 for every unit change in owners’ equity. These different rates may be contributed by factors affecting choice of capital structure (Al-Najjar and Taylor 2008, Karadeniz 2009 , Bokpin and Arko 2009Abor 2009,Bajaj et al 1998, Mehram 1992 and Brailsford et al 2002) who show that managerial ownership is negatively related to debt ratio and (Pedersen 2000, Claessens et al 2002, Graham and Harvey 2001, Litov 2005, and Abor 2007) who indicate that, decision to choose capital structure is influenced by many factors like profitability, firm size, growth rate, market to book value and liquidity. The effective tax rate, tangibility of assets, and return on assets, ownership structure and corporate governance firm age and volatility in earnings, assets tangibility and dividend payout ratio are also factors affecting decision to choose capital structure and also by the speeds set to attain a targeted level of leverage (Farhat et al 2006, Flannary et al 2004, Huang and Ritter 2007, de Haas and Peeters 2004, Nivorochkin 2004 Sander 2003).
The accounting literature does not show clearly proportion of equity and liabilities in the capital structure but rather suggest that more debt is better to maximize firms’ value (M&M 1963). Other studies show how capital structure influences firms performance ,Ebaid (2009),M&M (1958) showing no impact , (Graham and Harvey 2001, Brav et al 2005, Rodden and Lewellen 1995, Champion 1999, Ghosh et al 2000 and Hadlock and James 2002) showing positive influence and (Fama and French 1998, Gleason et al 2000 and Simmerly and Li 2000) showing negative influence in firm’s performance, Kyereboah-Coleman (2007),Chiang et al 2002, Berger and Bonacorsi di Patti 2006 and (M&M 1963) but no explanation on how much should be in owners’ equity and liabilities or debt to ensure good company’s performance. This study specifically shows that on average the proportion of liabilities to total assets in the capital structure is 64% and capital covers the rest proportion of 36% to total assets.
assets. The small proportion of capital compared to liabilities is in line with BPP Learning media (2009) which defines capital or equity as the residual interest in the assets of the entity after reducing all its liabilities and hence this small percentage 36% indicates that C is just a residual not a large component in accounting equation.
The proportions of liabilities and capital to total assets can be compared with their T and P values. The L has T and P values of 48.84 and 0.000 respectively showing that it is highly statistically significant compared to C with T and P values of 3.11 and 0.003 respectively. The results of C are very close to those of the constant term β0 with T and P values of 3.16 and 0.003 respectively showing that β0 is statistically significant and hence should not be ignored in the presentation of accounting equation.
The constant term β0 is useful to this study as it indicates that before any businessman/woman takes loans or inject capital there are efforts and qualitative valuables. These may be an idea, strategic location, human capital, creativity and plans documented and undocumented. These valuables are there and build up as time goes in daily operations of the business. All these are not quantified in any statement in business reports. It is important to note that using the conservative equation, A = L+ C; where L=0, C= 0, then A = 0. This expression is not realistic as business is a combination of complex processes including human brain and efforts. In reality as proved by this study, when L=0, C=0, A = β0 meaning that an idea, human brain, form of business and other intangibles are there.
6. Conclusions
The accounting equation evolve overtime and changes from simple double entry or bookkeeping equation to the complex statistical equation .The new equation show that out of owners’ equity and liabilities assets are the function of other factors indicated by the constant term β0.These may be business ideas, strategic locations, human capital and skills and other intangibles which may have not been included or quantified in normal accounting equation, capital structure or statement of financial position/balance sheet. Therefore since the results reveal that the β0 is as significant as C it should be taken into consideration and not ignored. Though L seems to be more significant than C and β0, the two i.e. C and β0 are important to make accounting equation balanced.
Difference in rates of change between capital and liability may be caused by many factors and complex decisions made by managers to maximize their utility (welfare) or to meet their targets (trade off theory). Choice of one component is driven by its effect on managers interests. Managers prefer capital structure which reduces cost of capital and risks so as to ensure that they are protected in their jobs and increase their tenure. The study also shows how the optimal capital structure may be as perceived by managers or decision makers of capital structure. Liabilities cover the highest proportion 64%
while owners’ equity covers only 36%.This may be due to the benefits associated with debt financing like tax shield and risks of company failures.
These results therefore should help investors, managers and owners of companies to know the proportions of owners’ equity (36%) and liabilities (64%) in the company’s capital structure and in accounting equation. Future researchers should find out how accounting equation evolves, how L and C change in relation to total assets as well as proportion of L and C to the total assets in specific industries and should also define the point where capital equals to liabilities.
References
[1] Abor, J. and Biekpe, N. (2009). ‘How do we explain the capital structure of SMEs in sub-Saharan Africa? Evidence from Ghana’, Journal of Economic Studies, Vol. 36, Issue 1, pp. 83-97.
[2] Abor, J. (2007). ‘Corporate governance and financing decisions of Ghanaian listed firms’, Corporate Governance, Vol. 7, pp. 83-92.
[3] Al-Najjar, B. and Taylor, P. (2008). ‘The relationship between capital structure and ownership Structure new evidence from Jordanian panel data’, Managerial Finance, Vol. 34, Issue 12, pp. 919-933.
[4] Anderson, R. and Reeb, D. (2003). “Founding-family ownership, corporate diversification, and firm leverage”, Journal of Law & Economics, Vol. 46, pp. 653-84.
[5] Anderson, R., Mansi, S. and Reeb, D. (2004). ‘Board characteristics, accounting report integrity and the cost of debt’, Journal of Accounting and Economics, Vol. 37.Issue 3, pp. 315-42.
[6] Bajaj, M., Chan, Y. and Dasgupta, S. (1998). ‘The relationship between ownership, financing decisions and firm performance: a signaling model’, International Economic Review, Vol. 39, Issue 3, pp. 723-44.
[7] Berger, A.N. and Bonaccorsi di Patti, E. (2006). ‘Capital structure and firm performance: a new approach to testing agency theory and an application to the banking industry’, Journal of Banking & Finance, Vol. 30, Issue 4, pp. 1065-102. [8] Bertrand, M. and Mullainathan, S. (2003), ‘Enjoying the quiet life? Corporate governance and managerial preferences’, Journal of Political Economy, Vol. 111, pp. 1043-75.
[9] Bokpin, G. A. and Arko A. C. (2009). ‘Ownership structure, corporate governance and capital structure decisions of firms Empirical evidence from Ghana’, Studies in Economics and Finance, Vol. 26, Issue 4, pp. 246-256. [10] BPP Learning Media (2009). Financial accounting: ACCA
study text for exams in December 2009 to June 2010, BPP Learning media London.
[12] Brav, A., Graham, J., Harvey, C. and Michaely, R. (2005), ‘Payout policy in the 21st century’, Journal of Financial Economics, Vol. 77, pp. 483-527.
[13] Bruno, F. and Mateus C. (2009). ‘Firms’ capital structure and the bankruptcy law design’, Journal of Financial Economic Policy, Vol. 1, Issue 3, pp. 264-275.
[14] Carnegie, G. D., Napier C. J. (1996). ‘Critical and interpretive histories: insights into accounting’s present and future through its past’, Accounting, Auditing & Accountability Journal, Vol. 9 Issue: 3, pp.7 – 39.
[15] Champion, D. (1999). ‘Finance: the joy of leverage’, Harvard Business Review, Vol. 77, pp. 19-22.
[16] Chatzkel, J. (2003). ‘The collapse of Enron and the role of intellectual capital’, Journal of Intellectual Capital, Vol. 4, Issue 2, pp.127 – 143.
[17] Cheng, S., Nagar, V. and Rajan, M. (2005). ‘Identifying control motives in managerial ownership: evidence from antitakeover legislation’, Review of Financial Studies, Vol. 18, pp. 636-72.
[18] Chiang, Y.A., Chang, P.C.A. and Hui, C.M.E. (2002). “Capital structure and profitability of the property and construction sectors in Hong Kong”, Journal of Property Investment & Finance, Vol. 20 No. 6, pp. 434-53.
[19] Claessens, S., Djankov, S., Fan, J. and Lang, L. (2002). ‘Disentangling the incentive and entrenchment effects of large shareholdings’, Journal of Finance, American Finance Association, Vol. 57, Issue 6, pp. 2741-71.
[20] de Haas, R. and Peeters, M. (2004). ‘The dynamic adjustment towards target capital structures of firms in transition economies’, EBRD Working Paper No. 87, p. 32, available at: www. ebrd.com/pubs/econo/wp0087.pdf
[21] Driffield, N., Vidya, M. and Sarmistha, P. (2005). ‘How ownership structure affects capital structure and firm performance? Recent evidence from East Asia’, Finance 0505010, Economics Working Paper Archive EconWPA. [22] Ebaid, I. E. (2009). ‘The impact of capital-structure choice
on firm performance: empirical evidence from Egypt’, The Journal of Risk Finance, Vol. 10, Issue 5, pp. 477-487. [23] Eldomiaty, T. (2007). ‘Determinants of corporate capital
structure: evidence from an emerging economy’, International Journal of Commerce and Management, Vol. 17, pp. 25-43.
[24] Fama, E. and French, K. (1998). ‘Taxes, financing decisions, and firm value’, Journal of Finance, Vol. 53, pp. 819-43. [25] Farhat, J., Cotei, C. and Abugri, B.A. (2006). ‘The pecking
order hypothesis vs. the static trade-off theory under different institutional environments’, preliminary draft, p.39,availableat:http://wehner.tamu.edu/finc.www/seminar/p apers/CovFinance31Jan2007.pdf
[26] Flannery, M., Rangan, J. and Kasturi, P. (2004). ‘Partial adjustment toward target capital structures’, AFA 2005 Philadelphia Meetings, p. 50, available at: http://ssrn.com/ abstract ¼ 467941
[27] Fosberg, R.H. (2004). ‘Agency problems and debt financing: leadership structure effects and Corporate Governance’, International Journal of Business in Society, Vol. 4, Issue 1,
pp.31-8.
[28] Friend, I. and Lang, L. (1988). ‘An empirical test of the impact of managerial self interest on corporate capital structure’, Journal of Finance, Vol. 43, Issue 2, pp. 271-81. [29] Gaud, P., Hoesli, M. and Bender, A. (2004). ‘Further
evidence on debt-equity choice’, Research Paper No. 114, University of Geneve, Geneva, p. 38.
[30] Ghosh, C., Nag, R. and Sirmans, C. (2000). ‘The pricing of seasoned equity offerings: evidence from REITs’, Real Estate Economics, Vol. 28, pp. 363-84.
[31] Gleason, K., Mathur, L. and Mathur, I. (2000). ‘The interrelationship between culture, capital structure, and performance: evidence from European retailers’, Journal of Business Research, Vol. 50, pp. 185-91.
[32] Glen, J. and Pinto, B. (1994). ‘Debt or equity? How firms in developing countries choose”, discussion paper, International Financial Corporation, Washington, DC.
[33] Graham, J.R. and Harvey, C. (2001), “The theory and practice of corporate finance: evidence from the field”, Journal of Financial Economics, Vol. 60, pp. 187-243.
[34] Graham, J.R. and Harvey, C.R. (1999). ‘The theory and practice of corporate finance: evidence from the field’, AFA 2001 New Orleans, Duke University working paper, p. 48, available at: http://ssrn.com/abstract ¼ 220251.
[35] Grojer, J. (1993). ‘Employee Artefacts on the Balance Sheet: Model Illustration and Implications’, Journal of Human Resource Costing & Accounting, Vol. 2 Issue 1, pp.27 – 53. [36] Huang, R. and Ritter, J.R. (2007). ‘Testing theories of
capital structure and estimating the speed of adjustment’, p. 46, available at: http://ssrn.com/abstract ¼ 938564.
[37] Inoue, T. & Thomas, W. (1996). ‘The choice of accounting policy in Japan’, Journal of International Financial Management and Accounting, Vol. 7, Issue 1, pp. 1–23. [38] Jackson, T. and Doris M. C. (1998). ‘A brief history of
accounting for the translation of foreign currencies’, Journal of Management History (Archive), Vol. 4, Issue 2, pp.137 – 144.
[39] Jensen, M. (1986). ‘’Agency cost free cash flow, corporate finance, and takeovers’, American Economic Review, Vol. 76, pp. 323-9.
[40] Jensen, M. and Meckling, W. (1976). ‘The theory of the firm: managerial behavior, agency costs, and ownership structure’, Journal of Financial Economics, Vol. 3, pp. 305-60. [41] Jo˜eveer, K. (2006). ‘Sources of capital structure – evidence
from transition countries’, Working Paper Series, p. 29, available at: www.cerge-ei.cz/pdf/wp/Wp306.pdf.
[42] Ju, N., Parrino, R., Poteshman, A.M. and Weisbach, M.S. (2002). ‘Horses and rabbits? Optimal dynamic capital structure from shareholders and managers perspective’, p. 45, available at: http://ssrn.com/abstract ¼ 345821.
[44] Kilgore, A., Leahy, S., Mitchell, G. (1993). ‘The True and Fair View Concept: Evidence from Australia’, Asian Review of Accounting, Vol. 7, Issue 1, pp.96 – 111.
[45] Kim, W.S. and Sorensen, E.H. (1986). ‘Evidence on the impact of agency costs of debt in corporate debt policy’, Journal of Financial and Quantitative Analysis, Vol. 21, pp. 131-44.
[46] Klapper, L.F., Sarria-Allende, V. and Sulla, V. (2002). ‘Small- and medium-size enterprise financing in Eastern Europe’, World Bank Policy Research Working Paper No. 2933 available at: http://ssrn.com/abstract ¼ 636295 [47] Kyereboah, C. A. (2007). ‘The impact of capital structure on
the performance of microfinance institutions’, The Journal of Risk Finance, Vol. 8, Issue 1, pp. 56-71.
[48] Leary, M.T. and Roberts, M.R. (2005). ‘Do firms rebalance their capital structure’, Journal of Finance, Vol. 60, Issue 6, pp. 2575-619.
[49] Litov, L.P. (2005). Corporate governance and financing policy: new evidence manuscript, Stern School of Business, New York University, New York, NY.
[50] Macintosh, N. B., Baker C. R. (2002). ‘A literary theory perspective on accounting: Towards heteroglossic accounting reports’, Accounting, Auditing & Accountability Journal, Vol. 15 Issue 2, pp.184 – 222.
[51] Mayer, C. and Sussman, O. (2004). ‘A new test of capital structure’, AFA 2005 Philadelphia Meetings, p. 47, available at: http://ssrn.com/abstract ¼ 643388
[52] Mehran, H. (1992), ‘Executive incentive plans, corporate control, and capital structure’, Journal of Financial and Quantitative Analysis, Vol. 27, pp. 539-60.
[53] Melis, A. (2007). ‘Financial Statements and Positive Accounting Theory: The Early Contribution of Aldo Amaduzzi’, Accounting, Business & Financial History, Vol. 17, Issue 1, pp. 53–62.
[54] Missonier-Piera, F. (2004). ‘Economic Determinants of Multiple Accounting Method Choices in a Swiss Context’, Journal of International Financial Management and Accounting, Vol. 15, Issue 2.
[55] Modigliani, F. and Miller, M. (1963). ‘Corporate income taxes and the cost of capital: a correction’’, American Economic Review, Vol. 53, pp.433-43.
[56] Modigliani, F. and Miller, M.H. (1958). ‘The cost of capital, corporation finance and the theory of investment’, American Economic Review, Vol. 48, pp. 261-97.
[57] Mouck, T. (1990). ‘Positive Accounting Theory as a Lakatosian Research Program’, Accounting and Business Research, Vol. 20, Issue 79, pp. 231-239.
[58] Myers, S. (2001). ‘Capital structure’, Journal of Economic Perspectives, Vol. 15, pp. 81 102.
[59] Nivorozhkin, E. (2004). ‘Financing choices of firms in EU accession countries’, BOFIT Discussion Papers, No. 6, p. 48. [60] Nogler, G. E. (2008). ‘Going concern modifications, CPA
firm size, and the Enron effect’, Managerial Auditing Journal, Vol. 23, Issue 1, pp. 51-67.
[61] Ntui, P., Waweru, N. and Mangena, M. (2011), “Determinants of different accounting methods choice in Tanzania: A positive accounting theory approach”, Journal of accounting in emerging economies, Vol. 1, no 2, pp 144-159
[62] Pandey, I.M. (2007). Finance: A management guide for managing company funds and profits, Prentice –Hall of India, New Delhi.
[63] Pindado, J. and de la Torre, C. (2005). ‘A complementary approach to the financial and strategy views of capital structure: theory and evidence from the ownership structure’, Working Paper No. 666167, Social Science Research Network.
[64] Roden, D. and Lewellen, W. (1995). ‘Corporate capital structure decisions: evidence from leveraged buyouts’, Financial Management, Vol. 24, pp. 76-87.
[65] Sander, P. (2003). ‘Capital structure choice in Estonian companies: a survey’, Management of Organizations: Systematic Research, Vol. 27, pp. 122-35.
[66] Seppa, R. (2008). ‘Capital structure decisions: research in Estonian non-financial companies’, Baltic Journal of Management, Vol. 3, Issue 1, pp. 55-70.
[67] Sheedy-Gohil, K. (1996). ‘Putting the asset value of skills on the balance sheet’, Managerial Auditing Journal, Vol. 11, Issue 7, pp.16 – 20.
[68] Simerly, R. and Li, M. (2000). ‘Environmental dynamism, financial leverage and performance: a theoretical integration and an empirical test’, Strategic Management Journal, Vol. 21, pp. 31-49.
[69] Strathmore University. (2009). Financial accounting: CPA study text, Strathmore University, Nairobi-Kenya
[70] Tarek I. Eldomiaty and Mohamed H. Azim. (2008). ‘The dynamics of capital structure and heterogeneous systematic risk classes in Egypt’, International Journal of Emerging Markets, Vol. 3, Issue 1, pp. 7-37.
[71] Titman, S. and Wessels, R. (1988). ‘The determinants of capital structure choices’, Journal of Finance, Vol. 43, Issue 1, pp. 1-19.
[72] Tucker, J. and Stoja, E. (2004). Target gearing in UK, p. 40, available at: http://ssrn.com/ abstract ¼ 710325
[73] Watts, R. & Zimmerman, J. (1986). Positive Accounting Theory. Englewood Cliffs NJ: Prentice-Hall.
[74] Watts, R. L & Zimmerman, J.L. (1990). ‘Positive Accounting Theory: A Ten Year Perspective’, The AccountingReview, Vol. 65. Issue 1, pp. 131-156.
[75] Wen, Y., Rwegasira, K. and Bilderbeek, J. (2002). ‘Corporate governance and capital structure decisions of Chinese listed firms’, Corporate Governance: An International Review, Vol. 10, Issue. 2, pp. 75-83.