_____________________________________________________________________________________________________ *Corresponding author: E-mail: [email protected];
Technology
2(2): 1-17, 2017; Article no.AJB2T.37831 ISSN: 2457-0125
Dynamics of Micro/Macro Elements and Heavy
Metals during Anaerobic Treatment of Organic
Fraction of Municipal Solid Waste (OFMSW)
H. O. Stanley
1, C. B. Ogbonna
1,2*and G. O. Abu
11Department of Microbiology, Faculty of Science, University of Port Harcourt, P.M.B. 5323, Port Harcourt, Nigeria. 2Department of Biological Science, College of Natural and Applied Science, Wellspring University, Benin City, Nigeria.
Authors’ Contributions
This work was carried out in collaboration between all authors. Authors HOS and GOA supervised the experimentation process of the study. Author HOS managed the literature search. Author CBO designed the study, performed the statistical analysis, wrote the protocol and wrote the first draft of the manuscript. Author GOA managed the analysis of the study. All authors read and approved the final manuscript.
Article Information
DOI: 10.9734/AJB2T/2017/37831 Editor(s): (1) Zafar S. Khan, Professor, Dept. of Botany, Maharashtra College of Arts, Science and Commerce, India. Reviewers: (1) Prakash Munnoli, S D M College of Engineering and Technology, India. (2) Michael Ioelovich, Israel. Complete Peer review History: http://prh.sdiarticle3.com/review-history/22377
Received 30thOctober 2017
Accepted 15thNovember 2017
Published 20thDecember 2017
ABSTRACT
In this study, the dynamics of macro and micro elements (including heavy metals) during anaerobic treatment of organic fraction of municipal solid waste (OFMSW) was investigated to determine the effect of seasonal variation on the performance of the treatment process. The first anaerobic digestion (ADH) process was conducted during the dry season (between March and May, 2016) while the second anaerobic digestion (ADC) process was conducted during the rainy season (between July and early October, 2016). OFMSW was collected and subjected to anaerobic treatment inside one-stage 250 litre – capacity batch-type mesophilic reactors with useful volume of 230 litres, substrate (OFMSW) concentration of 5.53%, rumen juice as the source of microbial inoculum and a retention time of 84 days. To monitor the treatment process, temperature, pH,
macro and micro elements including heavy metals were estimated with time. Result showed that average process temperature inside the reactors (ADHand ADC) during the dry and rainy season ranged from 29.7ºC to 39.3ºC and 26.8ºC to 30.8ºC respectively after 84 days. Inside the reactors (ADH and ADC), cumulative biogas increased to 34.8 L and 26.5 L while nickel, iron and cobalt ranged from 6.80 to 1.52 mg/l and 6.62 to 0.93 mg/l, 21.40 to 1.25 mg/l and 23.70 to 5.7 mg/l, and 2.14 to 0.63 mg/l and 2.21 to 0.64 mg/l respectively after 84 days. Cadmium, chromium and mercury ranged from 2.91 to 0.05 mg/l and 2.64 to 1.1 mg/l, 1.84 to 0.06 mg/l and 1.81 to 0.8 mg/l and 0.58 to 0.02 mg/l and 0.57 to 0.08 mg/l respectively after 84 days. This suggests that anaerobic digestion could be applied to reduce the concentration of heavy metals in biodegradable wastes to some degree before the wastes can be disposed into the environment. Nevertheless, it appears that the anaerobic digestion (ADH) process conducted during the dry season may have performed better than the anaerobic digestion (ADC) process conducted during the rainy season in terms of reducing the concentration of these elements as was biogas production with time.
Keywords: Anaerobic treatment; municipal solid waste; seasonal variation; heavy metals.
NOMENCLATURES
AD = Anaerobic digestion
OFMSW = Organic fraction of municipal solid waste
RJ = Rumen juice
ADH = Anaerobic digester (or digestion process) operated (or conducted) during the dry season, between March and May, 2016
ADC = Anaerobic digester (or digestion process) operated (or conducted) during the rainy season, between July and October, 2016
PW = Paper waste
FW = Food waste
1. INTRODUCTION
Municipal solid waste includes all solid wastes generated from residential, commercial, industrial, institutional, construction and demolition centres among others. This waste includes both organic and inorganic fractions [1, 2,3,4,5,6]. Municipal Waste generation is an unavoidable product of human activities, however, sustainable management of such waste is a challenge faced in Nigeria due to increase in urbanization as a result of increasing population pressure, changes in consumer pattern, industrialization, lack of adequate plans and infrastructure required for efficient and sustainable management of municipal solid waste respectively [7,8]. Municipal solid waste generation in Nigeria is a serious issue due to its human health and environmental sustainability implications that has yet to be properly addressed [1,9,10,11]. It constitutes a major environmental problem not just because of its ever-growing volume but also because of the risk its improper handling and disposal poses to human health [12,13,14,15]. The inefficient management of waste by individuals, households, consumers and waste management companies may be attributed to inadequate
information on waste management benefits, lack of producers’ involvement in waste management as well as poor implementation of government policies and individual attitude [14,16,17].
Leachates from municipal solid waste may contain micro/macro elements (including heavy metals) such as magnesium (Mg), potassium (K), nitrogen (N), phosphorus (P), calcium (Ca), sulphur (S), lead (Pb), mercury (Hg), cadmium (Cd), uranium (Ur), iron (Fe), zinc (Zn), copper (Cu), chromium (Cr), manganese (Mn), molybdenum (Mo), nickel (Ni) and selenium (Se) in concentrations that may be deleterious to biota and human life [18,19]. They are not degraded, so there is a risk that they may accumulate to toxic levels in the environment if the waste is not properly disposed [20]. Low concentrations of certain heavy metals (as micronutrient) and relatively higher concentrations of macro elements are necessary for microbial activity during anaerobic digestion of organic matter [21, 20,22,23,24,25,26,27,28,18,29].
that carry them to acceptable limits before the waste can be disposed in the environment [28,30]. It is of great importance in the management of solid waste because it will considerably decrease the volume of waste that is being generated as well as inactivate biological and biochemical processes so as to avoid landfill-gas and odour emissions, reduce landfill settlements and produce bioenergy and bio-fertilizer in the form of biogas and digestate respectively [28,30,31].
However, the success of an anaerobic digestion process depends on several factors which have been shown to affect anaerobic digestion of organic matter [28]. Two major seasons namely dry and wet (or rainy) seasons are experienced in Nigeria and they are characterized by difference in environmental temperature which is one factor that can affect anaerobic digestion of organic matter [28,30]. The objective of this study was to determine the dynamics of macro/micro elements (including some heavy metals) during anaerobic digestion of organic fraction of municipal solid waste (OFMSW) under ambient condition in other to evaluate the effect of seasonal variation on the efficiency of the digestion process.
2. MATERIALS AND METHODS 2.1 Anaerobic Digestion Set-Up
One-stage 250 litre–capacity (pilot scale) anaerobic digesters (AD) were configured for batch-type mesophilic reactors with useful volumes of around 230 litres respectively using rumen juice as the source of microbial inoculum (Figure 1). The feed for anaerobic digestion was prepared inside the 250 L-capacity substrate tank (top left of figure one) before it was loaded into the anaerobic digester. The tap heads attached to the body of the 250 L-capacity anaerobic digester are sample collection points. Biogas flows out of the anaerobic digester through the gas outlet controlled by a gas-tight
valve into the hose. The gas flows through the hose into the gas collection and measuring unit. In this gas collection unit, the 7 L-capacity tank sited under the one above contains water saturated with salt (NaCl) to prevent the gas from dissolving inside it. When biogas flows into it, the gas displaces an equal volume of the water which flows into to the upper tank through the hose that connects them at the side.
Because the tanks are graduated, the volume of water displaced was directly recorded and estimated to be approximately equal to the volume of biogas produced. Furthermore, biogas pressure was estimated using the formula in equation one (1). Where rho is the density of water, g is acceleration due to gravity and h is the height of water displaced inside the tank sited below the upper one (Figure 1). Since the volume of biogas was estimated directly, the height of water displaced was estimated using the formula in equation two (2) because the tanks have the shape of a cylinder; where r is the radius of the tank and π is a constant (3.142857). Biogas quality was estimated using the alkaline (NaOH)-water displacement methods described in [32] by applying the formula in equation three (3).
The first anaerobic digestion (ADH) process was conducted in duplicate during the dry season, between March and May (2016). The second anaerobic digestion (ADC) process was conducted in duplicate during the rainy season, between July and early October (2016). The feed inside the substrate tank was prepared to arrive at the desired substrate concentration (Table 1) using the formula in equation one (4). Anaerobic digestion of the feed was conducted inside the 250L-capacity bio-digesters under ambient [field] condition with a retention time of 84 days.
P=ρgh (Eq. 1)
V=πr2h (Eq. 2)
Volume of alkaline (NaOH) displaced x 100 (Eq. 3) Volume of water (H2O) displaced
Mass of dry OFMSW X 100 (Eq. 4)
Mass of dry OFMSW + mass of rumen juice + mass of H2O Biogas quality =
Figure 1. Design for the pilot – scale anaerobic digestion of organic fraction of municipal solid waste (OFMSW)
2.2 Preparation of Rumen Juice (RJ)
Cow’s rumen juice was obtained and prepared as described by [33]. The filtered rumen juice was transferred into a 20 L-capacity gallon and supplemented with 200 g of glucose. This was done in order that the microbes trapped inside the juice would generate more energy from utilizing glucose as substrate to breakdown any complex organic polymer (such as cellulose) which may have been retained in the rumen juice after filtration. Following this, the rumen juice was injected with 18ml of Na2S.9H2O (2% w/v) using a long needle attached to a 10 ml syringe and the gallon was screw capped with a specially designed cap which allowed us to evacuate biogas from the 20 L-capacity gallon with time. Addition of hydrated sodium sulphide was done to reduce the rumen juice in order to promote the growth of strict anaerobic bacteria trapped inside the juice [34]. Following this, the populations of aerobic and anaerobic bacteria were determined by cultural enumeration before and after subjecting the rumen juice to anaerobic digestion
in the dark under ambient condition until biogas production was no longer observed (after a month).
2.3 Collection and Pre-treatment of Municipal Solid Waste
Paper waste was collected at source in Oba market, Benin City (Nigeria). After collection, the paper waste was shredded using paper shredder. The shredded paper waste was transferred into a pressure pot containing water and boiled for three hours. After boiling, the paper-water mixture was allowed to stand for two weeks. Thereafter, water was removed from the heat-treated paper by filtration (using a textile filter) and sun-drying. After drying, the paper was milled into powdered form and preserved in a nylon bag. This treatment procedure was applied in order to increase the biodegradability of the paper waste. Due to the high biodegradability of some municipal solid wastes such as food wastes we delayed their collection until we were ready to formulate the feed so as to prevent
Water inlet
Digestion tank
OutletSubstrate Tank
Biogas burner
Digital thermometerexcessive loss of volatile solid if kept for long period. These fractions of municipal solid waste were collected at source from Oba market in Benin City Edo State (Nigeria) using waste collection bags. After collection, the wastes were pooled and milled together to produce a pasty homogeneous solid. Milling reduces particle size of the substrate, thus making it more bioavailable to the microbes [28].
2.4 Preparation and Characterization of the Substrate
The substrate was prepared by mixing the pre-treated powdered paper waste (PW) with the pasty solid derived from mechanically pre-treating the food waste (FW) in the ratio of 1:4 to form the wet solid substrate. After preparation, samples of the substrate were collected to determine some of its physical and chemical properties such as dry (or total) solids (DS), water content (WC), volatile solid (VS) and ash content (AC), total organic carbon (TOC), total nitrogen (TN), phosphorus (P) and potassium (K) contents using Standard Methods [35,36]. The population of culturable aerobic and anaerobic bacteria were also enumerated in order to determine their presence in the substrate.
2.5 Determination of Physicochemical Parameters
As part of the anaerobic digestion (AD) monitoring process, anaerobic digester slurry samples were collected at weekly interval (for 84 days) to determine important physicochemical parameters. Daily online bio-digester process temperature (PTM) was measured using digital thermometers with probes (SCT-lilliput, Scichem Tech) which extended into the anaerobic digesters. Daily ambient temperature (ATM) was also measured using digital thermometer (SCT-lilliput, Scichem Tech). Weekly process pH was determined using hand-held digital pH meter (SCT-lilliput, Scichem Tech) as described by [37]. Total sulphate (SO42-) was determined by the Nephelometeric protocol described in Standard methods [35]. Magnesium (Mg) and calcium (Ca) were determined using the EDTA titrimetric protocol described in Standard methods [35]. Potassium (K) was determined using the flame emission photometric protocol described in Standard methods [35]. Total nitrate (NO3-), ammonia nitrogen (NH4-N), total nitrogen (N), phosphorus (P), micro elements (such as Mn, Zn, Fe, Cu, Ni, Co) and other heavy metals (such Pb, Cd, Cr and Hg) were determined using
the spectrophotometric protocols described in Standard methods [35].
3. RESULTS AND DISCUSSION 3.1 Physicochemical/Biological
Properties of the Substrate (OFMSW)
Physicochemical/microbiological properties of the substrate (OFMSW) which was subjected to anaerobic digestion (ADH) during the dry season (between March and May, 2016) and that which was subjected to anaerobic digestion (ADC) during the rainy season (between July and October, 2016) are presented in Table 2.
Although, the result shows that the physicochemical/biological properties of these two substrates (pre-treated OFMSW) were slightly different, the differences observed between them may not have been significant as shown in Table 2. Furthermore, the slight differences that were observed between the substrates may have been due to seasonal variation [2]. The volatile solid content of both substrates (70.38% and 70.41%) shows that both of them were readily biodegradable [28]. This means that around 70.38% and 70.41% of the respective substrate was biodegradable at the time. In the rumen juice collected during the dry season for ADH, the population of aerobic bacteria reduced from 3.6x10³CFU/ml to 2.2x10² CFU/ml, while the population of strict anaerobic bacteria increased from 3.3x10⁵ CFU/ml to 7.8x10⁷ CFU/ml after a month of subjecting the rumen juice to anaerobic digestion. In the rumen juice collected during the rainy season for ADC, the population of aerobic bacteria reduced from 3.9x10³ CFU/ml to 1.6x10² CFU/ml, while the population of strict anaerobic bacteria increased from 4.1x10⁵ CFU/ml to 9.2x10⁷ CFU/ml after a month. This is desirable because higher initial population of strict anaerobic bacteria is usually required for an efficient (or effective) start-up of the digestion process [28].
digestion period may in fact be facultative anaerobic bacteria rather than strict aerobes. This could have been the reason why they survived the anaerobic digestion process [28].
3.2 Dynamics of Biogas Production
The pressure and volume of cumulative biogas inside the anaerobic digester (ADH) operated during the dry season (between March and May, 2016) increased to 16.542 mbar (Figure 2) and 34.80L (Figure 3) respectively after 84 days. The pressure and volume of cumulative biogas inside the anaerobic digester (ADC) operated during the rainy season (between July and October, 2016) increased to 12.596 mbar (Figure 2) and 26.50 L (Figure 3) respectively after 84 days. Cumulative volume of CO2 and CH4-rich biogas inside the ADH system increased to 7.38L (Figure 4) and 27.42 L (Figure 5) respectively after 84 days. Inside the ADC system, cumulative volume of CO2 and CH4-rich biogas increased to 11.25 L (Figure 4) and 14.75L (Figure 5) respectively after 84 days. This suggests that the quality of cumulative biogas inside produced inside the ADHand ADC systems may have increased to around 78.79% and 55.66% respectively after 84 days.
The result above shows that the dynamics of biogas production observed inside ADHand ADC systems respectively resembled the batch growth dynamics that is usually observed in batch microbial culture [38]. This is because biogas production is the result of the microbial activities taking place inside the anaerobic digester ecosystems [39,40,41,28]. Moreover, this was expected because the anaerobic digestion processes were conducted in batch mode. Nevertheless, the result also showed that the quantity and quality of biogas produced inside the anaerobic digester (ADH) operated during the dry season (between March and May, 2016) was significantly (p < 0.05) higher than that which was produced inside the anaerobic digester (ADC) operated during the rainy season (between July and October, 2016). This may have resulted from the variation in weather condition between the periods when the anaerobic digestion processes were conducted. Environmental temperature (and consequently process temperature) appeared to have played a role in this as discussed in section 3.3.
3.3 Temperature Dynamics
During the dry season (between March and May, 2016) when the first anaerobic digestion
(ADH) of OFMSW was conducted, daily average ambient temperature (ATM) ranged from 30.3oC to 33.6oC after 84 days. However, during the rainy season (between July and October, 2016) when the second anaerobic digestion (ADC) of OFMSW was conducted, daily average ambient temperature ranged from 26.3oC to 30.5oC after 84 days. Daily average process temperature (PTM) inside the anaerobic digester (ADH) operated during the dry season ranged from 29.7oC to 39.3oC after 84 days. However, daily average process temperature (PTM) inside the anaerobic digester (ADC) operated during the rainy season ranged from 26.8oC to 30.8oC after 84 days. The result suggests that daily average ambient temperature recorded during the dry season (between March and May, 2016) was relatively higher than the daily average ambient temperature observed during the rainy season (between July and October, 2016).
This correlated with a higher process temperature inside the anaerobic digester (ADH) operated during the dry season compared to the anaerobic digester (ADC) operated during the rainy season. This indicates that environmental temperature dynamics may have contributed to the process temperature dynamics inside the anaerobic digestion (ADH and ADC) systems to some degree with time [28]. Several authors have shown anaerobic digestion of organic matter to be more efficient at higher temperatures compared to otherwise [42,30,43, 44,45]. Because daily average process temperature was higher inside the ADH system than inside the ADC system, this may have resulted to a better performance of the anaerobic digester (ADH) operated during the dry season compared to the anaerobic digester (ADC) operated during the rainy when ambient temperature appeared to have reduced to between 26.3oC and 30.5oC.
3.4 Process pH Dynamics
occurred faster inside the anaerobic digester (ADC) operated during the rainy season than the anaerobic digester (ADH) operated during the dry season. This suggests that the ADH system was less acidic than the ADCsystem with time.
3.5 Dynamics of Macro/Micro Elements and Heavy Metals of Interest
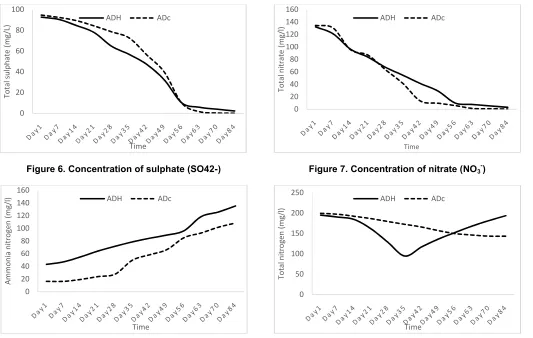
Inside the anaerobic digester (ADH) operated during the dry season, total sulphate (SO42-) and total nitrate (NO3-) decreased from 92.64 mg/L to 2.33 mg/L and 132.22 mg/L to 3.11 mg/L respectively after 84 days (Figure 6 and Figure 7). Inside the anaerobic digester (ADC) operated during the rainy season, total sulphate (SO42-) and total nitrate (NO3-) decreased from 94.60 mg/L to 0.12 mg/L and 134.50 mg/L to 0.33 mg/L respectively after 84 days (Figure 6 and Figure 7). Inside the anaerobic digester (ADH) operated during the dry season and the anaerobic digester (ADC) operated during the rainy season, the concentration of ammonia nitrogen (NH4-N) increased from 43.20 mg/L and 16.40 mg/L to 135.30 mg/L and 108.44 mg/L respectively after 84 days (Figure 8). Total nitrogen (TN) reduced from 195.01 mg/L and 199.50 mg/L to 193.70 mg/L and 143.23 mg/L respectively after 84 days (Figure 9). Carbon/nitrogen ration (C/N) reduced from 19.72 and 19.44 to 0.55 and 6.54 respectively (Figure 10). The concentration of phosphorus (P) reduced from 96.43 mg/L and 116.63 mg/L to 46.40 mg/L and 62.50 mg/L respectively after 84 days (Figure 11).
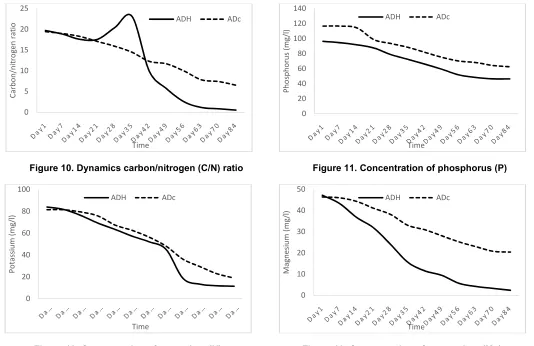
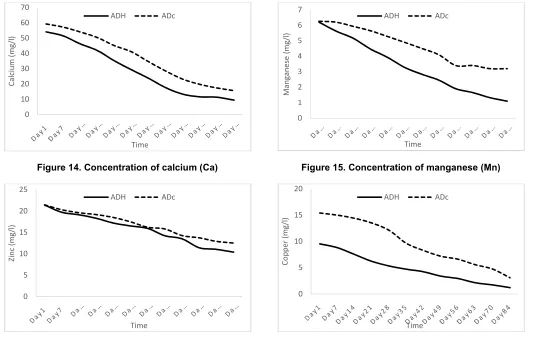
The concentration of potassium (K), Magnesium (Mg), calcium (Ca), Manganese (Mn), zinc (Zn) and copper (Cu) inside the anaerobic digester (ADH) operated during the dry season and the one (ADC) operated during the rainy season reduced from 84.01 mg/L and 81.51 mg/L to 11.42 mg/L and 18.90 mg/L (Figure 12), 47.20 mg/L and 46.40 mg/l to 2.40 mg/L and 20.43 mg/L (Figure 13), 54.11 mg/L and 59.30 mg/L to 9.50 mg/L and 15.70 mg/L (Figure 14), 6.20 mg/L and 6.26 mg/L to 1.10 mg/L and 3.20 mg/L (Figure 15), 21.40 mg/L and 21.44 mg/L to 10.40 mg/L and 12.50 mg/L (Figure 16) and 9.53 mg/L and 15.40 mg/L to 1.21 mg/L and 3.10 mg/L (Figure 17) respectively after 84 days.
Likewise, the concentration of nickel (Ni), lead (Pb), cobalt (Co), iron (Fe), molybdenum (Mo), cadmium (Cd) chromium (Cr) and mercury (Hg)
inside the anaerobic digesters (ADH and ADC) operated during the dry season and rainy season (2016) reduced from 6.80 mg/L and 6.62 mg/L to 1.52 mg/L and 0.93 mg/L (Figure 18), 3.80 mg/L and 4.17 mg/L to 0.42 mg/L and 1.20 mg/L (Figure 19), 2.14 mg/L and 2.21 mg/L to 0.63 mg/L and 0.64 mg/L (Figure 20), 21.40 mg/L and 23.70 mg/L to 1.25 mg/L and 5.70 mg/L (Figure 21), 2.34 mg/L and 1.84 mg/L to 0.91 mg/L and 0.18 mg/L (Figure 22), 2.91 mg/L and 2.64 mg/L to 0.05 mg/L and 1.10 mg/L (Figure 23), 1.84 mg/L and 1.81 mg/L to 0.06 mg/L and 0.08 mg/L (Figure 24) and 0.58 mg/L and 0.57 mg/L to 0.02 mg/L and 0.08 mg/L (Figure 25) respectively after 84 days of the anaerobic digestion process.
8
Table 1. Composition of the Feed for anaerobic digestion
System Substrate PW:FW DS(Kg) WC(Kg) *WS(Kg) *RJ(L) *WA(L) Total(L) %TS
ADH OFMSW 1:4 12.69 3.21 15.90 6.36 207.74 230.00 ~5.53
ADC OFMSW 1:4 12.74 3.16 15.90 6.36 207.74 230.00 ~5.53
PW = Paper waste, FW = Food waste, DS = Dry solid, WC = Water content, WS = Wet solid, RJ = Rumen juice, WA = Water, ADH= Anaerobic digester operated during the warmer period (between March and May, 2016), ADC= Anaerobic digester operated during the rainy season (between July and October, 2016), * = Feed components,
OFMSW = Organic fraction of municipal solid waste.
Table 2. Physico-chemical properties of the substrate (MSW)
Parameters Concentration (ADH) Concentration (ADC) Rumen juice before & after
preservation (ADH)
Rumen juice before & after preservation (ADC)
Dry solid (%) 79.81 80.12 ND ND
Water content (%) 20.19 19.87 ND ND
Ash content (%) 29.62 29.59 ND ND
Volatile solid (%) 70.38 70.41 ND ND
Total organic carbon (g/L) 884.58 891.94 ND ND
Total nitrogen (g/L) 41.85 42.77 ND ND
C/N Ratio 21.14 20.85 ND ND
Phosphorus (g/L) 20.98 26.68 ND ND
Potassium (g/L) 17.32 18.63 ND ND
Aerobic Bacteria (CFU/ml) 4.8 x 10⁵ 5.2 x 10⁵ 3.6x10³& 2.2x10² 3.9x10³& 1.6x10² Strict anaerobic Bacteria (CFU/ml) 5.4 x 10⁴ 4.6 x 10⁴ 3.3x10⁵& 7.8x10⁷ 4.1x10⁵& 9.2x10⁷
9
Figure 2. Pressure of cumulative biogas produced Figure 3. Volume of cumulative biogas produced
Figure 4. Volume of cumulative CO2 produced Figure 5. Volume of cumulative CH4-rich biogas
produced -5
0 5 10 15 20
Cu
m
ul
at
iv
e b
io
gas
p
re
ss
ur
e
(m
bar
)
Time
ADH ADc
-5 0 5 10 15 20 25 30 35 40
Vo
lu
m
e
of
c
um
ul
at
iv
e
bi
og
as
(L
)
Time
ADH ADc
-2 0 2 4 6 8 10 12 14
Vo
lu
m
e
of
c
um
ul
at
iv
e
CO2
(L
)
Time
ADH ADc
-5 0 5 10 15 20 25 30
Vo
lu
m
e
of
c
um
ul
at
iv
e
CH4
-r
ic
h
bi
og
as
(L
)
Time
10
Figure 6. Concentration of sulphate (SO42-) Figure 7. Concentration of nitrate (NO3-)
Figure 8. Concentration of ammonia-nitrogen (AN) Figure 9. Concentration of total nitrogen (TN) 0
20 40 60 80 100
To
tal
su
lp
hat
e
(m
g/L
)
Time
ADH ADc
0 20 40 60 80 100 120 140 160
To
tal
n
itr
at
e
(m
g/l
)
Time
ADH ADc
0 20 40 60 80 100 120 140 160
Am
m
on
ia
ni
tr
og
en
(m
g/l
)
Time
ADH ADc
0 50 100 150 200 250
To
tal
n
itr
og
en
(m
g/l
)
Time
11
Figure 10. Dynamics carbon/nitrogen (C/N) ratio Figure 11. Concentration of phosphorus (P)
Figure 12. Concentration of potassium (K) Figure 13. Concentration of magnesium (Mg)
0 5 10 15 20 25
Car
bo
n/n
itr
og
en
rat
io
Time
ADH ADc
0 20 40 60 80 100 120 140
Ph
os
ph
or
us
(m
g/l
)
Time
ADH ADc
0 20 40 60 80 100
Po
tas
siu
m
(m
g/l
)
Time
ADH ADc
0 10 20 30 40 50
M
ag
ne
siu
m
(m
g/l
)
Time
12
Figure 14. Concentration of calcium (Ca) Figure 15. Concentration of manganese (Mn)
Figure 16. Concentration of zinc (Zn) Figure 17. Concentration of copper (Cu)
0 10 20 30 40 50 60 70
Cal
ci
um
(m
g/l
)
Time
ADH ADc
0 1 2 3 4 5 6 7
M
an
gan
es
e
(m
g/l
)
Time
ADH ADc
0 5 10 15 20 25
Zi
nc
(m
g/l
)
Time
ADH ADc
0 5 10 15 20
Co
pp
er
(m
g/l
)
Time
13
Figure 18. Concentration of nickel (Ni) Figure 19. Concentration of lead (Pb)
Figure 20. Concentration of cobalt (Co) Figure 21. Concentration of iron (Fe)
0 1 2 3 4 5 6 7 8
N
ic
ke
l (
m
g/l
)
Time
ADH ADc
0 1 2 3 4 5
Le
ad
(m
g/l
)
Time
ADH ADc
0 0.5 1 1.5 2 2.5
Co
bal
t (
m
g/l
)
Time
ADH ADc
0 5 10 15 20 25
Iro
n
(m
g/l
Time
14
Figure 22. Concentration of molybdenum (Mo) Figure 23. Concentration of cadmium (Cd)
Figure 24. Concentration of chromium (Cr) Figure 25. Concentration of mercury (Hg)
0 0.5 1 1.5 2 2.5
M
ol
yb
de
nu
m
(m
g/l
)
Time
ADH ADc
0 0.5 1 1.5 2 2.5 3 3.5
Cad
m
iu
m
(m
g/l
)
Time
ADH ADc
0 0.5 1 1.5 2
Ch
ro
m
iu
m
(m
g/l
)
Time
ADH ADc
0 0.1 0.2 0.3 0.4 0.5 0.6 0.7
M
er
cu
ry
(m
g/l
)
Time
4. CONCLUSION
Since the concentration of the heavy metals decreased during anaerobic digestion of OFMSW inside ADHand ADC, it may be possible to assume that anaerobic digestion could be used to treat organic wastes which contain certain amount of heavy metals to some degree before they can be disposed into the environment. Although, the concentration of most of the macro and micro elements (including the heavy metals) decreased inside both anaerobic digestion (ADH and ADC) systems with time, it appears that the anaerobic digestion (ADH) system operated during the dry season (between March and May, 2016) performed better than the anaerobic digestion (ADC) system operated during the rainy season (between July and October, 2016) with time as indicated by the Figures above.
COMPETING INTERESTS
Authors have declared that no competing interests exist.
REFERENCES
1. Aliyu BN. An analysis of municipal solid waste in Kano metropolis, Nigeria. J Human Ecol. 2010;31(2):111-119.
2. Udofia PE, Ukpong EI. Domestic solid waste management in a rapidly growing Nigerian City of Uyo. J Human Ecol. 2011; 36(3):229-235.
3. Amori AA, Fatile BO, Ihuoma SO, Omoregbee HO. Waste generation and management practices in residential areas of Nigerian Tertiary Institutions. J Edu Soc Res. 2013;3(4):1–8.
4. Babatunde BB, Vincent-Akpu IF, Woke GN, Atarhinyo E, Aharanwa UC, Green AF, Isaac-Joe O. Comparative analysis of municipal solid waste (MSW) composition in three local government areas in Rivers State, Nigeria. African J Environ Sci and Tech. 2013;7(9):874-881.
5. Benjamin TA, Emmanuel EA, Gideon AD. Characterization of municipal solid waste in the federal capital Abuja, Nigeria. Global J Sci Frontier Res. 2014;14(2):1.
6. Olukanni DO, Akinyinka OO, Ede AN, Akinwumi II, Ajanaku KO. Appraisal of municipal solid waste management, its effect and resource potential in a semi-urban city: A case study. J South African Business Res; 2014.
DOI: 10.5171/2014.705695
7. Kadafa AY, Latifa A, Abdullahi HS, Suleiman WA. Comparative assessment of the municipal solid waste management services. Nat Sci. 2013;11(6):154-164. 8. Omole FK, Alakinde MK. Managing the
unwanted materials: The agony of solid waste management in Ibadan metropolis, Nigeria. Intl J Edu Res. 2013;1(4):1-12. 9. Adejobi OS, Olorunnimbe RO. Challenges
of waste management and climate change in Nigeria: Lagos state metropolis experience. African J Scientific Research. 2012;7(1):346-362.
10. Ayuba KA, Manaf LA, Sabrina AH, Azmin SW. Current status of municipal solid waste management practise in FCT Abuja. Res J of Environ and Earth Sci. 2013;5(6): 295-304.
11. Butu AW, Mshelia SS. Municipal solid waste disposal and environmental issues in Kano metropolis, Nigeria. British J Environ Sci. 2014;2(2):10-26.
12. Ogwueleka TC. Municipal solid waste characteristics and management in Nigeria. Iranian J Environ Health Sci Eng. 2009;6:173-180.
13. Nkwachukwu OI, Chidi NI, Charles KO. Issues of roadside disposal habit of municipal solid waste, environmental impacts and implementation of sound management practices in developing country “Nigeria”. Intl J Environ Sci Dev. 2010;1(5):40–42.
14. Abila B, Kantola J. Municipal solid waste management problems in Nigeria: Evolving knowledge management solution. Intl J Environ Ecol Geol and Geophy Eng. 2013; 7(6):172–177.
15. Amuda OS, Adebisi SA, Jimoda LA, Alad AO. Challenges and possible panacea to the municipal solid wastes management in Nigeria. J Sust Dev Stud. 2014;6(1):64-70. 16. Otitoju TA. Individual attitude toward
recycling of municipal solid waste in Lagos, Nigeria. American J Eng Res. 2014;3(7): 78-88.
17. Oladepo OW, Ilori MO, Taiwo KA. Assessment of the waste generation and management practices in Nigerian food industry: Towards a policy for sustainable approaches. American J Sci Indus Res. 2014;6(1):12-22.
mobility of mercury and macro and micro nutrients of soils. Sci. World J; 2014. DOI: 10.115/2014/407049 tpub
19. Atser J, Ofem BI. Environmental effects of municipal solid waste: A case study of Uyo urban area. Nigerian J Agric Food and Environ. 2014;10(3):39-42.
20. Chen Y, Cheng JJ, Creamer KS. Inhibition of anaerobic digestion process: A review. Biores Tech. 2008;99:4044-4064.
21. Kumar A, Miglani P, Gupta KR, Bhattacharya TK. Impact of Ni (II), Zn (II) and Cd (II) on biogassification of potato waste. J Environ Biol.2006;27(1):61-66. 22. Ragsdale SW. Enzymology of the wood–
Ljungdahl pathway of acetogenesis. Annals of New York Academy of Sciences. 2008;1125:129-136.
23. Mondal MK, Dasgupta BV. Effect of ferrous sulphate on biomethanation and acceleration of biogas production from organic fraction of municipal solid waste. Proceedings of the International Conference on Solid Waste, Hong Kong SAR, P.R. China; 2011.
24. Demirel B, Scherer P. Trace element requirements of agricultural biogas digesters during biological conversion of renewable biomass to methane. Biomass Bioenergy. 2011;35:992–998.
25. Glass JB, Orphan VJ. Trace metal requirements for microbial enzymes involved in the production and consumption of methane and nitrous oxide. Frontiers in Microbiol. 2012;3. 26. Müller B, Sun L, Schnürer A. First insights
into the syntrophic acetateoxidizing bacteria – a genetic study. Microbiol Open. 2013;2:35–53.
27. Birošová L, Mackulˇak T, Bodík I, Ryba J, Škubák J, Grabic R. Pilot study of seasonal occurrence and distribution of antibiotics and drug resistant bacteria in wastewater treatment plants in Slovakia. Sci and Total Environ. 2014;490:440–444. 28. Schnurer A, Jarvis A. Microbiological
handbook for biogas plants. Swedish Gas Centre Report 207. 2010;13-138.
29. Moestedt J, Nordell E, Yekta SS, Lundgren J, Martí M, Sundberg C, et al. Effects of trace element addition on process stability during anaerobic co-digestion of OFMSW and slaughterhouse waste. Waste Manag; 2015 (In press).
Available:http://dx.doi.org/10.1016/j.wasma n.2015.03.007
30. Azeem K, Muhammad A, Muzammil A, Tariq M, Lorna D. The anaerobic digestion of solid organic waste. Waste Manag. 2011;31:1737-1744.
31. Nalo T, Tasing K, Kumar S, Bharti A. Anaerobic digestion of municipal solid waste: A critical analysis. Intl J Innovative Res Sci Eng Tech. 2013;3(4):224–234. 32. Jigar E, Sulaiman H, Asfaw A, Bairu A.
Study on renewable biogas energy production from cladodes of Opuntia ficus indica. ISABB J Food Agric Sci. 2011;1(3): 44-48.
33. Ogbonna CB, Ibiene AA, Stanley HO. Microbial population dynamics during anaerobic digestion of guinea grass (Panicum maximum). J App Environ Microbiol. 2014;2(6):294-302.
34. Wolf RS. Techniques for cultivating methanogens. Methods in Enzymology. 2011;494:1–22.
35. APHA. Standard Methods for the examination of Water and Waste water. 20th ed. American Public Health Association, American Water Works Association, Water Environment Federation, Washington D.C; 1998. 36. USEPA methods 1684. Total, fixed and
volatile solids in water, solids and bio-solids. Draft. 2001;11-13.
37. Ogbonna CB, Berebon DP, Onwuegbu EK. Relationship between temperature, Ph and population of selected microbial indicators during anaerobic digestion of guinea grass (Panicum maximum). American J Microbiol Res. 2015;3(1):14-24.
38. Nopharatana A, Pullammanappallil PC, Clarke WP. Kinetics and dynamic modeling of batch anaerobic digestion of municipal solid waste in a stirred reactor. Waste Manag. 2007;27:595–603.
39. Labat M, Garcia JL. Study on the development of methanogenic microflora during anaerobic digestion of sugar beet pulp. J App Microbiol Biotech. 1986;25: 163-168.
40. Lozano JSC, Marisol VM, Mariela CA, Edgar FCM. Microbiological characterization and specific methanogenic activity of anaerobe sludges used in urban solid waste treatment. Waste Manag. 2009;29:704–711.
42. Zhu B, Gikas P, Zhang R, Lord J, Jenkins B, Li X. Characteristics and biogas production potential of municipal solid wastes pretreated with a rotary drum reactor. Biores Tech. 2009;100:1122– 1129.
43. Li Y, Shi J, Wang Z, Stiverson JA, Yu Z. Reactor performance and microbial community dynamics during solid-state anaerobic digestion of corn stover at mesophilic and thermophilic conditions. Bioresource Technology. 2013b;136:574– 581.
44. Sibiya NT, Muzenda E, Tesfagiorgis HB. Effect of temperature and pH on the anaerobic digestion of grass silage. International Conference on Chemical Engineering and Advanced Computational Technologies (ICCEACT); 2014.
Available:htt://hdl.handle.net/10210/13590 45. Ghasimi DSM, Tao Y, de Kreuk M,
Zandvoort MH, van Lier JB. Microbial population dynamics during long‑term
sludge adaptation of thermophilic and mesophilic sequencing batch digesters treating sewage fine sieved fraction at varying organic loading rates. Biotech Biofuels. 2015;8:1-15.
DOI: 10.1186/s13068-015-0355-3
46. Allison SD, Martiny JBH. Resistance, resilience, and redundancy in microbial communities. Proc for Nat Acad Sci USA. 2008;105:11512–11519.
47. Lu Y, Wassmann R, Neue H, Huang C. Dynamics of dissolved organic carbon and methane emissions in a flooded rice soil. Soil Sci Society American J. 2000;64:11-2017.
DOI: 10.2136/sssaj2000.6462011x
48. Cirne DG, van der Zee FP, Fernandez-Polanco M, Fernandez-Fernandez-Polanco F. Control of sulphide during anaerobic treatment of S-containing wastewaters by adding limited amounts of oxygen or nitrate. Review of Environ Sci Biotech. 2008;7:93– 105.
_________________________________________________________________________________ © 2017 Stanley et al.; This is an Open Access article distributed under the terms of the Creative Commons Attribution License (http://creativecommons.org/licenses/by/4.0), which permits unrestricted use, distribution, and reproduction in any medium, provided the original work is properly cited.
Peer-review history: