Research Article
Evaluation of finger millet genotypes for stability using parametric and
non-parametric methods in India
Salej Sood1*, TSSK Patro2, Sunil Karad3 and Abhinav Sao4
1
ICAR-Vivekananda Institute of Hill Agriculture, Almora, Uttarakhand, 263 601, India
2
Agricultural Research Station,Vizianagram, Andhrapradesh-535 001, India
3
Zonal Agricultural Research Station, Kolhapur, 416012
4
IGKV, S.G. College of Agriculture and Research Station, Jagdalpur, Chhattisgarh-494 001, India
E-mail: [email protected]
(Received: 07 Jan 2016; Accepted: 11 Oct 2016)
Abstract
A study of phenotypic stability of 30 finger millet genotypes was conducted to assess genotype-environment interaction (GEI) and identify stable finger millet (Eleusine coracana (L.) Gaertn. subsp. coracana) genotypes for grain yield across four diverse locations in India. Genotypes, environments main effects and GEI were significant at P < 0.01. Different stability measures identified different wide adaptable genotypes. The parameters Wi2, σi2, Si(1) and Si(2) identified TNEC 1234, GPU 67, KMR 344, DHFMV 10-2-1, GPU 92 and VL 352 as stable genotypes, similarly ASV identified PPR 1044, PPR 1040, BR 45, GPU 91, VL 384 and DHFMV 78-3-1 while GPU 67, VL 376, DHFMV 10-2-1, GPU 92, VR 990 and GPU 91 were top six stable genotypes according to Ysi. The rank correlation matrix identified only two important stability measures (Ysi and YSI) in the identification of stable genotypes without compromise for grain yield. Among these two, Ysi was found to be the better choice for screening of genotypes for both yield and stability.
Keywords
G×E, Parametric stability, Non parametric stability, Rank Correlation, Finger millet
Introduction
Finger millet (Eleucine coracana L. Gaertn), a member of the Poaceae family, is one of the most important cereal in India. It is found in warm temperate regions of the world from Africa to Japan and also in Australia. It is present in archaeological records of early African agriculture in Ethiopia that date back 5000 years, and it probably originated somewhere in the area that today is Uganda (National Research Council, 1996). It is an important staple crop in many parts of Africa and has been cultivated in eastern and southern Africa since the beginning of the iron age. It is highly adaptable crop and even grown in higher elevations up to 2400 m above mean sea level in the Himalayas. In India, the crop is mainly grown in rainy season, right from mid hills of Himalaya in Uttarakhand to extreme South in Tamil Nadu and Gujarat in west to Sikkim in east.
Genotype-environment interactions (GEI) are important sources of variation in any crop, and the term stability is used to characterize a genotype, which shows a relatively constant yield, independent of changing environmental conditions. On this basis, genotypes with a minimal variance for yield across different environments are considered stable. The high yield performance of released varieties is one of the most important targets of breeders; therefore, they prefer a dynamic concept of stability (Becker and Leon, 1988). There are two major approaches (Parametric and Non-parametric) to study GEI and determine the adaptation of genotypes (Huehn,
1996). Parametric methods for estimating phenotypic stability are widely used in plant breeding and they were mostly related to the variance components and related statistics. These stability measures provide good estimates under certain statistical assumptions, based on the normal distribution of error and GEI effects, but may not perform well if these assumptions are violated by factors such as the presence of outliers. Nonparametric stability measures based on ranks provide a viable alternative to present parametric measures based on absolute data (Nassar and Huehn, 1987). For many applications, including selection in breeding programs, the rank order of genotypes are the most essential data. However, it is a known fact that the nonparametric are less powerful than their parametric counterpart. But when large number of genotypes is tested in a set of environments, the risk of selecting inferior genotypes from use of nonparametric measures is minimal (Rao and Prabhakaran, 2000).
Therefore, this study was carried out to tend out the interrelationship among various parametric and nonparametric phenotypic stability statistics, and to evaluate the similarity between these methods, and to determine the most suitable methods for assessing grain yield stability of the finger millet genotypes.
Materials and methods
(Medium Duration) and GPU 67 (Late Duration) were grown in the rainy season 2013 at four locations (Table 1). The first location (L1) was ICAR-Vivekananda Parvatiya Krishi Anusandhan Sansthan, Almora, Uttarakhand (25°35’N latitude and 79°39’E longitude, 1250 m above msl), L2 was Jagdalpur, Chattisgarh (19005’N latitude and 81057’ E longitude, 554 m above msl), L3 was Vizianagram, Andhra Pradesh (18°07’N latitude and 83°25’E longitude, 63 m above msl) and L4 was Kolhapur, Maharashtra (16043’N latitude and 74014’E longitude, 574 m above msl). These four locations represent Northern, Central, Western and Southern hemisphere of India. Five rows (10 rows at Kolhapur) of each genotype were planted in randomized complete block design with three replications. The row length was 3 m with row to row spacing of 22.5 cm. Plots were initially over-planted and thinned later during first weeding to maintain plant to plant spacing of 7.5 cm within the rows. The crop was raised in rainfed condition without pre-sown irrigation and sowing dates changed as per the onset of rain. Standard package of practices were followed to raise the crop. Data on grain yield and component traits were recorded. The grain yield data recorded on plot basis, converted into quintals per hectares was only considered for statistical analyses.
Statistical analysis: Combined analysis of variance was done across the test locations. The parametric stability parameters were performed in accordance to Wricks’s (1962) ecovalance (Wi2), Shukla’s
(1972) stability variance (σi2), and Shukla’s squared hat (s2). Another parametric measure AMMI stability value (ASV) for each genotype was calculated as suggested by Purchase et al. (2000). Among non-parametric statistics to estimate stability Si(1) and Si(2) (Nassar and Huehn, 1987) was used. Simultaneous selection of yield and stability (Ysi) is another non-parametric stability procedure used in the study, where both yield and Shukla’s (1972) stability variance were used as selection criteria (Kang 1993). Another non parametric stability measure known as Yield Stability Index (YSI) was calculated by the following formula:
YSI = RASV + RY
Where RASV is the rank of AMMI stability value and RY is the rank of mean grain yield of genotypes (RY) across environments. YSI incorporate both mean yield and stability in a single criterion. Besides, the stability parameters were compared using Spearman's rank correlation (Steel and Torrie, 1980). All analyses were performed using R software version 3.1.2 (R Core Team, 2014). Stability analysis in R was performed using Agricolae package (Mendiburu, 2014).
Results and Discussion
Analysis of Variance: Combined analysis of
variance (Table 2) over locations resulted in highly significant differences (P<0.01) in the interaction of genotypes × environments. The significant interactions of genotypes × environments suggest that grain yield of genotypes varied across environments. Significant differences for genotypes, environments and GE interaction indicated the effect of environments in the GE interaction, genetic variability among the entries and possibility of selection for stable genotypes. The relative magnitudes of G, E and G×E variances accounted for 24.90, 48.87 and 26.24 per cent, respectively. Genotypic rank differences over environments showed the existence of crossover GEIs (Crossa, 1990). This was fitted by the significant effect of GEI in the joint analysis of variance (Table 2) and showed the necessity to assess the response of the genotypes to environmental variation.
The average grain yield of the genotypes ranged from 15.37 q/ha for the genotype GPU 90 to 33.41 q/ha in GPU 67. Genotypes of annual crops evaluated for grain yield on a multi-locational trials frequently show GE interaction that complicates the selection or recommendation of materials. Coping with genotype-location interaction effects is possible only by selection for yield stability across environments defined as location-year combinations (Annicchiarico, 1997).
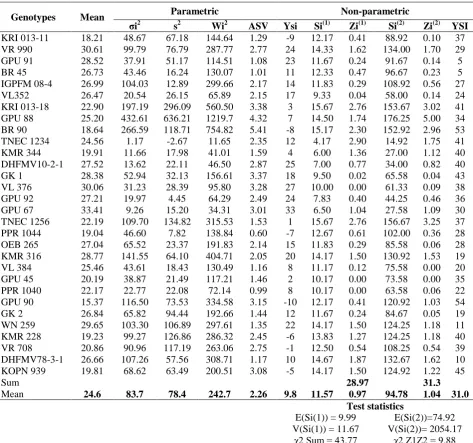
Stability analysis: Evaluation of genotypes based on four parametric and four non parametric stability parameters with mean yield are presented in Table 3. Wricke (1962) suggested using ecovalance (Wi2) as a stability parameter. According to this stability parameter, genotypes with the smallest ecovalance (Wi2) values are considered stable. The Wi2 was lowest for TNEC 1234 (11.65) followed by GPU 67 (34.31), KMR 344 (41.01), DHFMV 10-2-1 (46.5), GPU 92 (64.29) and VL 352 (65.89). An unbiased estimate using stability variance (σi2) of genotypes was
determined according to Shukla (1972). The stability variance (σi2
) revealed that the same genotypes i.e. TNEC 1234 (1.17), GPU 67 (9.26), KMR 344 (11.66), DHFMV 10-2-1 (13.62), GPU 92 (19.97) and VL 352 (20.54) had the smallest variance across the environments.
more to GE sum of square, it has to be weighted by the proportional difference between IPCA1 and IPCA2 scores to compensate for the relative contribution of IPCA1 and IPCA2 total GE sum of squares. The distance from zero is then determined using the theorem of Pythagoras (Purchase et al., 2000). In ASV method, a genotype with least ASV score is the most stable. Thus, ASV indicated PPR 1044 (0.6) as highly stable genotype across environments followed by PPR 1040 (0.99), BR 45 (1.01), GPU 91 (1.08), VL 384 (1.16) and DHFMV 78-3-1 (1.17). However, according to the Sukla’s squared cap (S2), TNEC 1234 (-2.67)
followed by GPU 92 (4.45), PPR 1044 (7.82), IGPFM 08-4 (12.89) and GPU 67 (15.2) were stable genotypes.
According to Kang stability statistic (YSi), another parametric stability analysis, genotypes with greater than the mean YSi (9.8 in our case) are considered stable. Thus, the genotypes in the order GPU 67 (33), VL 376 (27), DHFMV10-2-1 (25), GPU 92 (24), VR 990 (24), GPU 91 (23), WN 259 (22), KMR 316 (20), GK 1 (18), VL352 (17), OEB 265 (15), IGPFM 08-4 (14), GK 2 (12), TNEC 1234 (12) and BR 45 (11) were stable across the locations for grain yield. Similarly yield stability index (YSI) an another stability measure which takes into account both mean yield and stability identified GPU 91 (5, 28.52), BR 45 (5, 26.73), DHFMV78-3-1 (10, 26.66) and WN 259 (11, 29.65) as stable genotypes. These results were in accordance to the result of ASV.
Two rank stability measures (Si(1) andSi(2)) from Nassar and Huehn (1987) based on ranks of genotypes across environments are presented in Table 3. Genotypes with fewer changes in ranking are considered to be more stable (Becker and Leon, 1988). Zero variance is an indication of maximum stability. Thus, Si(1) and Si(2) of the tested genotypes showed that genotypes TNEC 1234 (4.17, 14.92), KMR 344 (6.0, 27.0), GPU 67 (6.5, 27.58), DHFMV10-2-1 (7.0, 34.0), GPU 92 (7.83, 44.25) had the lowest values; therefore, these genotypes were regarded as the most stable genotypes according to Si(1) and Si(2). For each genotype, Zi(1) and Zi(2) values were calculated based on the rank of the corrected data and summed over genotypes to obtain Z values; Zi(1)sum = 28.97 and Zi(2) sum = 31.30. Since both of these statistics were less than the critical value χ2 0.05, df =29 = 43.77, therefore no significant
differences were found in rank stability among the 30 genotypes grown in four different environments. The individual Z values were also smaller than the critical value of χ2 0.05, df =1 = 9.88,
which inferred that no genotypes were significantly unstable relative to others.
Association among mean yield, parametric and non-parametric stability statistics: Spearman’s
rank correlation (Steel and Torrie, 1980) was determined for each pair of mean yield and stability statistics (Table 4). Mean yield showed highly significant (P<0.01) positive and negative rank correlation with Ysi and YSI, respectively. σi2 was highly significantly positively correlated to both parametric measures s2 and Wi2 and non-parametric measures Si(1) andSi(2). This indicates that these stability parameters can be used as alternatives to each other. ASV showed significant positive association with YSI while, Ysi showed significant negative association with σi2, Wi2,Si(1),
Si(2) and YSI. Days to maturity did not show significant association with grain yield and any of the stability parameters.
Lin and Binns (1988) defined stability as the deviation of a specific genotype’s performance from the performance of the best cultivar in a trial. This implies that a stable cultivar is one that performs in tandem with the environment. The parametric stability measures, Shukla (σi2) and
Wricke (Wi2) had a total correspondence (r =1.00). This indicates that these procedures are equivalent for ranking purposes. These parametric stability measures along with s2 were also in total correspondence with nonparametric stability measures Si(1) and Si(2).The lower values indicating higher stability for all these parameters and significant positive correlation between these parameters suggest that they can be used as an alternative to each other and consequently as a useful index for selecting stable genotypes in crops. A significant positive rank correlation between Si(1) and Si(2) was reported earlier in bread wheat, durum wheat and barley by Mohammadi et al. (2009). Most of the studied stability parameters except Ysi and YSI had no correlation with mean grain yield and therefore, could be compromise methods to select genotypes with high stability. Significant negative rank correlation between mean yield and YSI showed that lower value of this parameter is related to higher yield. While, Ysi had nearly perfect positive correlation with mean grain yield which inferred that Ysi is more suitable stability parameter in finger millet for selection of genotypes with wide adaptability and higher yield. According to above results, it may be concluded that different stability measures identified different wide adaptable genotypes. The parameters Wi2, σi2
, Si(1), Si(2) identified TNEC 1234, GPU 67, KMR 344, DHFMV 10-2-1, GPU 92 and VL 352 as stable genotypes, similarly ASV identified PPR 1044, PPR 1040, BR 45, GPU 91, VL 384 and DHFMV 78-3-1 while GPU 67, VL 376, DHFMV 10-2-1, GPU 92, VR 990 and GPU 91 were top six stable genotypes according to Ysi. Identification of different stable genotypes by different stability measures may be due to the following reasons:
involved in the statistical analysis of particular stability measure resulting in change of rank of genotypes for stability. 2. We have taken the top five or six stable
genotypes based on the particular stability statistics, which does not mean that the other genotypes are unstable.
3. Z test in nonparametric stability parameters (Si(1), Si(2)) showed that no genotype was significantly unstable in comparison to other genotypes in our study.
However, when we see the results of rank correlation, only two stability measures (Ysi and YSI) showed significant association with mean grain yield and were important in identification of stable genotypes without compromise for grain yield. Among these two also, simultaneous selection for yield and stability (Ysi) was found to be the better choice for screening of genotypes for both yield and stability. Thus, GPU 67, VL 376, DHFMV 10-2-1, GPU 92 and VR 990 were the top five stable genotypes across the testing locations and can be deployed across the finger millet growing regions in India for enhancing the crop productivity.
Acknowledgements
Authors are thankful to Director, ICAR-VPKAS, Almora for facilitation of small millets improvement programme activities and Project Coordinator, AICSMIP, GKVK, UAS, Bangalore for allocation of All India Coordinated Yield Evaluation Trials at all the four centres of study. We are also thankful to Mr. G.S. Bisht for technical assistance.
References
Annicchiarico, P. 1997. Joint regression vs. AMMI analysis of genotypes environment interactions for cereals in Italy. Euphytica, 94: 53-62. Becker, H.C. and Leon, J. 1988. Stability analysis in
plant breeding. Plant Breeding, 101: 1-23. Crossa, J. 1990. Statistical analyses of multi-location
trials. Adv. Agron., 44: 55-85.
Farshadfar, E. 2008. Incorporation of AMMI stability value and grain yield in a single
non-parametric index (GSI) in bread wheat. Pak. J.
Biol. Sci., 11(14): 1791-1796.
Huehn, M. 1996. Non-parametric analysis of genotype x environment interactions by ranks. In: Genotype by environment interaction, M.S. Kang and H.G. Gauch (Eds.), CRC Press, Boca Raton, FL, pp. 213-228.
Lin, C.S. and Binns, M.R. 1988. A method of analyzing cultivar × location × year experiments: A new stability parameter. Theor. Appl. Genet., 76: 425- 430.
Mendiburu, F.D. 2014. Agricolae: Statistical Procedures for Agricultural Research. R package version 1.2-1.http://CRAN.R - project. Org /package = agricolae.
Mohammadi, R., Amri, A. and Ansari, Y. 2009. Biplot Analysis of rain-fed barley multi-environment trials in Iran. Agron. J., 101: 789-796. Mohammadi, R. and Amri, A. 2008. Comparison of
parametric and non-parametric methods for selecting stable and adapted durum wheat genotypes in variable environments.
Euphytica, 159: 419-432.
Nassar, R. and Huehn, M. 1987. Studies on estimation of phenotypic stability: Tests of significance for nonparametric measures of phenotypic stability. Biometrics, 43: 45-53.
National Research Council. 1996. Lost Crops of Africa, Vol. I: Grains. Board on Science and technology for International Development. National Academy Press Washington, D.C. Purchase, J.L., Hatting, H. and Vandeventer, C.S. 2000.
Genotype × environment interaction of winter wheat (Triticum aestivum L.) in South Africa: Π. Stability analysis of yield performance.
South Afric. J. Plant Soil, 17: 101-107.
R Core Team. 2014. R: A language and environment for statistical computing. R Foundation for Statistical Computing, Vienna, Austria. URL http://www.R-project.org/.
Rao, A.R. and Prabhakaran, V.T. 2000. On some useful interrelationships among common stability parameters. Indian J. Genet., 60(1): 25-36. Shukla, G.K. 1972. Some statistical aspects of
partitioning G × E components of variability.
Heredity, 29: 237-245.
Steel, R.G.D. and Torrie, J.H. 1980. Principles and procedures of Statistics, a Biometrical Approach, 2nd edition, McGraw-Hill, New York, pp. 633.
Wricke, G. 1962. On a method of understanding the biological diversity in field research. Z.
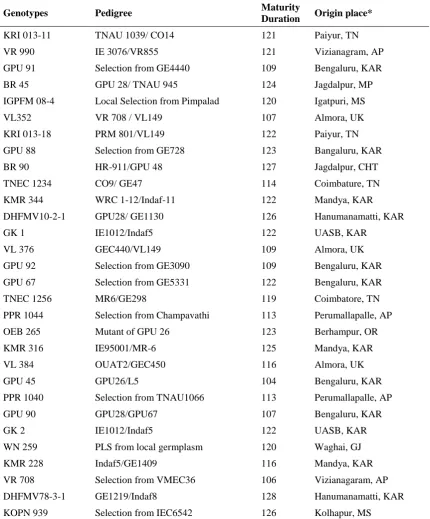
Table 1. Pedigree and maturity duration of genotypes taken in present study
Genotypes Pedigree Maturity
Duration Origin place*
KRI 013-11 TNAU 1039/ CO14 121 Paiyur, TN
VR 990 IE 3076/VR855 121 Vizianagram, AP
GPU 91 Selection from GE4440 109 Bengaluru, KAR
BR 45 GPU 28/ TNAU 945 124 Jagdalpur, MP
IGPFM 08-4 Local Selection from Pimpalad 120 Igatpuri, MS
VL352 VR 708 / VL149 107 Almora, UK
KRI 013-18 PRM 801/VL149 122 Paiyur, TN
GPU 88 Selection from GE728 123 Bangaluru, KAR
BR 90 HR-911/GPU 48 127 Jagdalpur, CHT
TNEC 1234 CO9/ GE47 114 Coimbature, TN
KMR 344 WRC 1-12/Indaf-11 122 Mandya, KAR
DHFMV10-2-1 GPU28/ GE1130 126 Hanumanamatti, KAR
GK 1 IE1012/Indaf5 122 UASB, KAR
VL 376 GEC440/VL149 109 Almora, UK
GPU 92 Selection from GE3090 109 Bengaluru, KAR
GPU 67 Selection from GE5331 122 Bengaluru, KAR
TNEC 1256 MR6/GE298 119 Coimbatore, TN
PPR 1044 Selection from Champavathi 113 Perumallapalle, AP
OEB 265 Mutant of GPU 26 123 Berhampur, OR
KMR 316 IE95001/MR-6 125 Mandya, KAR
VL 384 OUAT2/GEC450 116 Almora, UK
GPU 45 GPU26/L5 104 Bengaluru, KAR
PPR 1040 Selection from TNAU1066 113 Perumallapalle, AP
GPU 90 GPU28/GPU67 107 Bengaluru, KAR
GK 2 IE1012/Indaf5 122 UASB, KAR
WN 259 PLS from local germplasm 120 Waghai, GJ
KMR 228 Indaf5/GE1409 116 Mandya, KAR
VR 708 Selection from VMEC36 106 Vizianagaram, AP
DHFMV78-3-1 GE1219/Indaf8 128 Hanumanamatti, KAR
KOPN 939 Selection from IEC6542 126 Kolhapur, MS
Table 2. Combined analysis of variance for grain yield (q ha-1) of 30 finger millet genotypes evaluated in four locations
Source of variation Degree of freedom
Mean
Squares F value Pr (>F)
Per cent of total# sum of
squares
Environment (E) 3 4521.3 59.94 7.96e-06 *** 48.87
Replications (Environment) 8 75.4 6.91 3.78e-08 ***
Genotypes (G) 29 238.3 21.81 2.2e-16 *** 24.90
G x E 87 83.7 7.66 2.2e-16 *** 26.24
Error 232 10.9
***-Significant at the 0.1% probability level; #- Total is G+E+GXE
Table 3. Mean grain yield (q ha-1) and stability parameters of thirty finger millet genotypes across four environments
Genotypes Mean Parametric Non-parametric
σi2 s2 Wi2 ASV Ysi Si(1) Zi(1) Si(2) Zi(2) YSI KRI 013-11 18.21 48.67 67.18 144.64 1.29 -9 12.17 0.41 88.92 0.10 37 VR 990 30.61 99.79 76.79 287.77 2.77 24 14.33 1.62 134.00 1.70 29 GPU 91 28.52 37.91 51.17 114.51 1.08 23 11.67 0.24 91.67 0.14 5 BR 45 26.73 43.46 16.24 130.07 1.01 11 12.33 0.47 96.67 0.23 5 IGPFM 08-4 26.99 104.03 12.89 299.66 2.17 14 11.83 0.29 108.92 0.56 27 VL352 26.47 20.54 26.15 65.89 2.15 17 9.33 0.04 58.00 0.14 24 KRI 013-18 22.90 197.19 296.09 560.50 3.38 3 15.67 2.76 153.67 3.02 41 GPU 88 25.20 432.61 636.21 1219.7 4.32 7 14.50 1.74 176.25 5.00 34 BR 90 18.64 266.59 118.71 754.82 5.41 -8 15.17 2.30 152.92 2.96 53 TNEC 1234 24.56 1.17 -2.67 11.65 2.35 12 4.17 2.90 14.92 1.75 41 KMR 344 19.91 11.66 17.98 41.01 1.59 4 6.00 1.36 27.00 1.12 40 DHFMV10-2-1 27.52 13.62 22.11 46.50 2.87 25 7.00 0.77 34.00 0.82 40 GK 1 28.38 52.94 32.13 156.61 3.37 18 9.50 0.02 65.58 0.04 43 VL 376 30.06 31.23 28.39 95.80 3.28 27 10.00 0.00 61.33 0.09 38 GPU 92 27.21 19.97 4.45 64.29 2.49 24 7.83 0.40 44.25 0.46 36 GPU 67 33.41 9.26 15.20 34.31 3.01 33 6.50 1.04 27.58 1.09 30 TNEC 1256 22.19 109.70 134.82 315.53 1.53 1 15.67 2.76 156.67 3.25 37 PPR 1044 19.04 46.60 7.82 138.84 0.60 -7 12.67 0.61 102.00 0.36 28 OEB 265 27.04 65.52 23.37 191.83 2.14 15 11.83 0.29 85.58 0.06 28 KMR 316 28.77 141.55 64.10 404.71 2.05 20 14.17 1.50 130.92 1.53 19 VL 384 25.46 43.61 18.43 130.49 1.16 8 11.17 0.12 75.58 0.00 20 GPU 45 20.19 38.87 21.49 117.21 1.46 2 10.17 0.00 73.58 0.00 35 PPR 1040 22.17 22.77 22.08 72.14 0.99 8 10.17 0.00 63.58 0.06 22 GPU 90 15.37 116.50 73.53 334.58 3.15 -10 12.17 0.41 120.92 1.03 54 GK 2 26.84 65.82 94.44 192.66 1.44 12 11.67 0.24 84.67 0.05 19 WN 259 29.65 103.30 106.89 297.61 1.35 22 14.17 1.50 124.25 1.18 11 KMR 228 19.23 99.27 126.86 286.32 2.45 -6 13.83 1.27 124.25 1.18 40 VR 708 20.86 90.96 117.19 263.06 2.75 -1 12.50 0.54 108.25 0.54 39 DHFMV78-3-1 26.66 107.26 57.56 308.71 1.17 10 14.67 1.87 132.67 1.62 10 KOPN 939 19.81 68.62 63.49 200.51 3.08 -5 14.17 1.50 124.92 1.22 45
Sum 28.97 31.3
Mean 24.6 83.7 78.4 242.7 2.26 9.8 11.57 0.97 94.78 1.04 31.0 Test statistics
E(Si(1)) = 9.99 E(Si(2))=74.92 V(Si(1)) = 11.67 V(Si(2))= 2054.17
χ2 Sum = 43.77 χ2 Z1Z2 = 9.88
σi2
Table 4. Spearman rank correlation between mean yields and stability parametric and non-parametric measures for five genotypes across six environments
DM σi2 s2 Wi2 ASV Ysi Si(1) Si(2) YSI
MGY 0.15 -0.2 -0.18 -0.2 0.05 0.96** -0.23 -0.2 -0.47**
DM 0.32 0.19 0.32 0.18 0.06 0.34 0.31 -0.01
σi2
0.76** 1.0** 0.27 -0.41* 0.89** 0.94** 0.07
s2 0.76** 0.35 -0.34 0.73** 0.75** 0.2
Wi2 0.27 -0.41* 0.89** 0.94** 0.07
ASV 0.06 0.07 0.16 0.73**
Ysi -0.44* -0.41* -0.39*
Si(1) 0.98** -0.05
Si(2) -0.02
* and **: significant at the 0.05 and 0.01 level of probability, respectively DM - Mean days to maturity, MGY - Mean grain yield
σi2
- stability variance of Shukla; s2- Shukla’s squared hat; Wi2-Wricke´s ecovalence; ASV-AMMI stability value;