Vol.9 (2019) No. 6
ISSN: 2088-5334
Sustainable Design of Biorefinery Processes on Cocoa Pod:
Optimization of Pectin Extraction Process with Variations of pH,
Temperature, and Time
Desniorita
#*, Novizar Nazir
+, Novelina
+, Kesuma Sayuti
+#
Postgraduates Program, Andalas University, Padang, Indonesia E-mail : *[email protected]
+
Faculty of Agricultural Technology, Andalas University, Padang, Indonesia
Abstract—Pectin is a polysaccharide compound, which is a D-galacturonic acid polymer that is connected by α-1-4 glycosidic bonds. Pectin can be extracted from the cocoa pod. This research is part of research on the Sustainable Design of biorefinery processes of cocoa pod. The aim of this research were to extract pectin from cocoa pod by optimizing pH, temperature and time. The response from this study was the yield, pectin content and methoxyl content. This research used the Surface Response Methodology (RSM) with the center point obtained was pH 2.5, temperature 95 ° C and time was 3 hours. The treatment consisted of pH, temperature, time, and the expected response was the results of pectin, pectin content, and methoxyl content. The result showed that the pH, temperature and extraction time of cocoa pod had significant effect to the yield of pectin, pectin content and methoxyl content. The optimum conditions for the extraction of pectin were pH of 2, temperature of 95 °C and extraction time of 3 hours with a predicted yield of pectin of 2.33%, pectin content of 44.39% and methoxyl content of 7.07%. The functional groups between the standard pectin and the cocoa pod pectin are not significantly different. They have the same variety of functional groups. This data supports that the extracted pectin has the same structure with standard pectin which is shown in the IR spectrum of of FTIR test.
Keywords— pectin; extraction; cocoa pod; optimization; biorefinery.
I. INTRODUCTION
Cocoa pod is an agricultural waste that has not been exploited to its full potential. Cocoa pod is left over from processing the fruit of cacao (Theobroma cacao L). With the increasing production of processed cocoa fruit, it will cause an increase in cocoa pod waste which will cause problems to the environment. To prevent cocoa pod waste become an environmental problem, then it should be processed optimally [1]. The cocoa pod can be processed, resulting in a wide range of agro raw materials such as pectin, lignin, cellulose and other raw materials. If the cocoa plant increased, the cocoa fruit production will also increase. The cocoa pod processing would be beneficial and can produce raw materials that can be utilized by agroindustry. One of the methods of cocoa pod utilization is the extraction pectin which contained in the pod [2].
Optimal pectin extraction can be carried out using the Response Surface Methodology (RSM) method with Central Composite Design (CCD). The surface response method (RSM) is used to determine the optimum conditions of various factors to be studied. Optimization with RSM is
better than conventional methods. The advantage of the RSM method is that it does not spend much time and cost, because, with the response method does not require much data, the results are delivered in the form of graphical summaries and contour plots that are easy to understand in the extraction treatment conditions how much pectin [3], [4]
Pectin can be used as a thickening, gel-forming agent, as emulsifiers and stabilizers on the food industry. Pectin can also be utilized for a blender of drugs and cosmetics [7], [8]. Pectin sources are very widely available, but it has not been produced to its full potential. Currently, the needs of pectin in Indonesia have not been fulfilled. Import data of pectin in Indonesia for the year 2016 is as much as 240,792 kg. Cocoa pods can be used as a source of pectin. Cocoa fruit will produce about 75% of the skin. If it is not utilized, the cocoa pod will build up and will cause problems for the environment. Pectin is produced from the cocoa pod utilizing extraction [9].
The process of pectin extraction is simple. The extraction process is the process of separation of one or more ingredients of a solid or liquid in the tissues of plants. Some methods of extraction are maceration, percolation, soxhlet extraction, and more. Pectin extraction process using a solvent. The quality of the extraction result is influenced by the techniques of extraction, the extraction time, temperature, solvent type, solvent concentration and comparison of materials with solvent [10]. The extraction of pectin is usually done in acidic conditions because at this condition, protopectin will be hydrolyzed into pectin [11]. Some researchers have done the extraction of pectin. The extraction of pectin will be influenced by the pH, temperature and reaction time [7], [12] – [14], which were conducted on optimization of the pectin extraction process at various pH, temperature and time. This research is part of the sustainable design of biorefinery processes studies of a cocoa pod. The research aimed to get the optimum conditions for pectin extraction from the cocoa pod.
II. MATERIAL AND METHOD
A. Material
The materials used are cocoa skin of Ferestero variety, anhydrous citric acid, NaOH 0,1N, phenolphthalein, alcohol 95 %, NaOH 0,05 N, HCL 0,25 N, red phenol indicator, and distilled water.
B. Apparatus
Apparatus used in this study: Erlenmeyer 100, 500, 1000 ml, goblet, water bath, drying oven, blender and rotary evaporator
C. Research Design
The study was conducted using Responses Surface
Methodology (RSM), with Central Composite Design. There
are three independent variables, namely X1 (pH), X2 (temperature) and X3 (time). The expected Responses are to yield (Y1), pectin content (Y2) and methoxyl content (Y3). The center point or midpoint of the RSM is determined by optimizing the extraction of cocoa pod pectin using Taguchi
Orthogonal Array L. Optimization of cocoa pod pectin
extract with Taguchi is carried out at pH 2.5, 95°C and 3 hours [14]. From the processed optimization of pectin extraction with Taguchi obtained optimal results at pH 2.5, temperature 90°C and time 3.5 hours, and it is used for the design of RSM in the study. The design of the RSM is made at pH 2; 2.5; 3, temperature 85°C; 90°C; 95°C, and time 3 hours, 3.5 hours, 4 hours.
D. Research Process
The study was conducted in advance to determine the RSM center point of cocoa pod extraction using Taguchi
Orthogonal Array L on three parameters, i.e. on variations of
pH 2; 2.5; 3, 90°C temperature; 95°C; 100°C, and time 2.5 hours, 3 hours and 3.5 hours [14]. The results of the study with Taguchi Orthogonal Array L, which are pH 2.5, temperature 90°C, and time of 3.5 hours are used as a center
point of the Responses surface methodology (RSM) design
of cocoa pod pectin extraction.
E. Pectin Extraction Process
Pectin extraction was carried out using a mixture of water and citric acid. The cocoa pod that has been separated from the fruit is cut into small pieces with a size of about 1x2 cm. Next, cocoa pod mixed with water, with ratio 1: 4, mashed to form a cocoa pod pulp, then added citric acid according to the desired pH. Next, the cocoa pod pulp is heated in a water
bath according to the temperature and the heating time of the
research design. After heating, it is separated with a filter and the filtrate is collected. The filtered results is thickened by heating it at 60°C for 150 minutes with a rotary vacuum evaporator until thick, and the remaining volume is approximately half of its initial volume. To separate the pectin from the solvent, the precipitation was carried out by adding 96% alcohol in a ratio of 1: 2 and left overnight to form a precipitate. The formed precipitate was filtered with a 60 T screen cloth, then the precipitate is washed with alcohol 96% until it reached a neutral pH. Furthermore, drying is carried out at 40-50 °C for 10 hours, and then pectin is obtained from the pod of cocoa.
The obtained pectin is mashed and sieved until it passed the 80-mesh sieve for analysis. Analysis of pectin extract was carried out on the pectin yield, pectin content and methoxyl content [7]. Initial analysis was also carried out on raw materials. There is water content, ash content, levels of extractive substances, cellulose content and pectin content [15].
III.RESULTS AND DISCUSSION
A. Raw Material
The chemical analysis result of cocoa pod raw material is shown in Table 1.
TABLE I
THE RESULT OF CHEMICAL ANALYSIS OF CACAO POD
Parameter Content (%)
Water content Ash content
Extractive Substance Levels Holocellulose
Cellulose Lignin Pectin Hemicellulose
82.05 1.50 1.29 57.67 40.10 22.00 17.07 17.19
stabilizer. Pectin can also be used for the pharmaceutical industry and other industries [7].
B. Optimization of the Cocoa Pod Pectin Extraction Process
The results of pectin extract analysis related to pH, temperature and reaction time to the Responses of pectin yield, pectin content and methoxyl content from 20 run experiments can be seen in Table 2.
TABLE II
RESULTS OF ANALYSIS OF COCOA POD PECTIN EXTRACTS RELATED TO PH, TEMPERATURE, TIME TO RENDEMENT RESPONSES, PECTIN CONTENT AND
METHOXYL CONTENT
Table 2 shows that pectin yield, pectin and methoxyl content are highest at the treatment of pH 2, heating temperature 95°C and reaction time 2.5 hours. While the yield, pectin content is lowest at pH 3.5, heating temperature 90°C and reaction time 2.5. The lowest methoxyl content, is at the treatment of pH 3, temperature 95°C and the reaction time 4 hours. The midpoint of the treatment was obtained from the initial study of pectin extraction optimization using the Taguchi Orthogonal Array L method [14], [16].
Pectin extraction is influenced by pH, temperature and reaction time. Low pH, long reaction time will result a higher yield and pectin content [12]. According to Ref. [7] that pectin will increase with increasing of pH, temperature and reaction time. Increasing of pectin yield to optimal pH, temperature and reaction times. The optimal temperature of extraction is 90°C pectin, pH 2 and reaction time 2 hours. Increasing the temperature will increase the penetration of the solvent, and will increase the solubility of pectin. The increase in temperature is also affected by the length of reaction time. Likewise for pH, the yield of pectin increases with lower pH because strong acids will destroy the cell wall and pectin will be released [17]. At pH 2.5, temperature 103.4°C and reaction time 45 minutes get pectin around 2-4% [7].
C. Pectin Yield
The model obtained from the results of research on the pectin yield of cocoa pod with the Responses surface
methodology (RSM) method can be seen in Table 3. The
RSM model can show the relationship between pH, temperature and extraction time of the pectin yield obtained [18].
TABLE III
RESULTS OF ANALYSIS OF VARIANCE (ANOVA) OF YIELD RESPONSE
The ANOVA results show that the overall model is significant at a 5% significance level. The calculated F value is 4.55 which indicates that the model is significant for the pectin yield. Of the three factors, which significantly affect the pectin yield is the reaction time factor. While pH and temperature factors have no significant effect on the yield. It is shown in the model the existence of significant effect interaction of pH factor and reaction time to pectin yield produced. Extraction time and temperature will affect the pectin yield. The higher the temperature and the longer the extraction time will increase the yield of pectin, to a certain extent [2]. The higher the temperature will increase solvent penetration, so do with reaction time. For pH, the lower the pH, the pectin will be more easily separated from the cell wall [17]. Statistical results of cocoa pod extraction for the pectin yield by the RSM method can be seen in Table 4.
TABLE IV
STATISTICAL MODEL OF COCOA POD EXTRACTION FOR THE RSM PROGRAM PECTIN YIELD
Source Std. Dev . R-Squared Adjuste d R-Squared Predicte d R-Squared Press Linier 2FI Quadrati c Cubic 033 0.27 0.29 0.14 0.4106 0.6775 0.7037 0.9737 0.3001 0.5286 0.4370 0.8753 -0.0717 0.0341 -0.4583 3.14 2.83 4.27 + Suggested Aliased
Table 3 shows that among the existing models, linear, 2FI, quadratic, cubic that are suggested to be used is 2FI. This research was conducted in parallel with the optimization of pH, temperature and reaction time. From the research that has been done on the combined optimization of cocoa pod extraction at different pH, temperature and time to obtain the selected pectin yield, the selected statistical model is 2FI. The 2FI model was chosen after the maximization selection
S td R u n F ac to r 1 p H (X 1 ) F ac to r 2 T em p er at u r e ( oC ) (X 2 ) F ac to r 3 T im e (h ) (X 3 ) R es p o n se 1 Y ie ld ( % ) R es p o n se 2 P ec ti n C o n te n t R es p o n se 3 M et o x il C o n te n t (% )
14 1 2.50 90.00 4.34 1.42 20 5.58 3 2 2.00 95.00 3.00 2.14 40 7.69 19 3 3.00 95.00 3.00 2.43 45 6.23 12 4 2.50 98.41 3.50 1.46 25 4.80 8 5 3.00 95.00 4.00 1.71 35 4.11 6 6 3.00 85.00 4.00 1.82 35 5.12 7 7 2.00 95.00 4.00 1.67 30 5.46 20 8 2.50 90.00 3.50 2.05 40 7.16 1 9 2.00 85.00 3.00 2.26 45 6.20 15 10 2.50 90.00 3.50 2.04 30 6.52 11 11 2.50 81.59 3.50 2.25 30 5.86 5 12 2.00 85.00 4.00 1.46 28 4.33 13 13 2.50 90.00 2.66 1.97 26 6.43 18 14 2.50 90.00 3.50 1.89 40 5.77 2 15 3.00 85.00 3.00 1.79 20 6.04 9 16 1.66 90.00 3.50 2.12 30 4.92 17 17 3.50 90.00 2.50 1.34 10 4.40 16 18 2.00 95.00 2.50 2.89 60 7.75 4 19 3.00 95.00 3.00 2.24 30 5.27 10 20 3.34 90.00 3.50 1.56 10 4.74
Source Sum of Square
solution on the program and on the value of Adjusted
R-Squared and Predicted R-R-Squared. To get the pectin yield
equation from pectin extraction research with optimization of pH, temperature and time, the Responses surface
methodology method is used. The equation is:
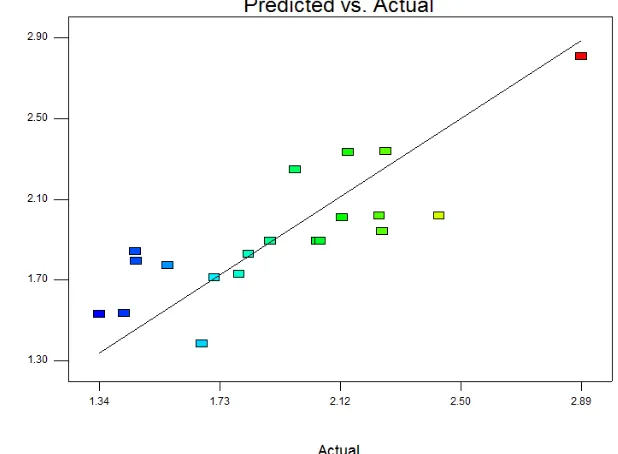
Yi = 3.6881-5.00722 X1 + 0.063047 X2 + 1.60851 X3 + 0.029051 X1X2 + 0.64347 X1X3 - 0.040458 X2X3 Figure 1 can be seen the relationship between the actual and predicted values of the pectin yield. Note: Y1 = pectin yield, X1 = pH, X2 = temperature, X3 = Time
Fig.1 Relationship of Surface Response Methodology Actual and Prediction Value of Pectin Yield.
From the Design-Expert Software, the pectin yield can be seen in the normal residual plots in Figure 1 that the yield values are around 1.3 to 2.89%. In Figure 1, it can be seen that the actual value of the research is approaching the straight line and partly a little distance from the straight line
of pectin yield based on the value of the equation from the
Software Expert System from the research that has been done.
The actual research results, some are away from the straight line, but some are approaching the straight line. This shows that the study provides a fairly good precision value [19] .
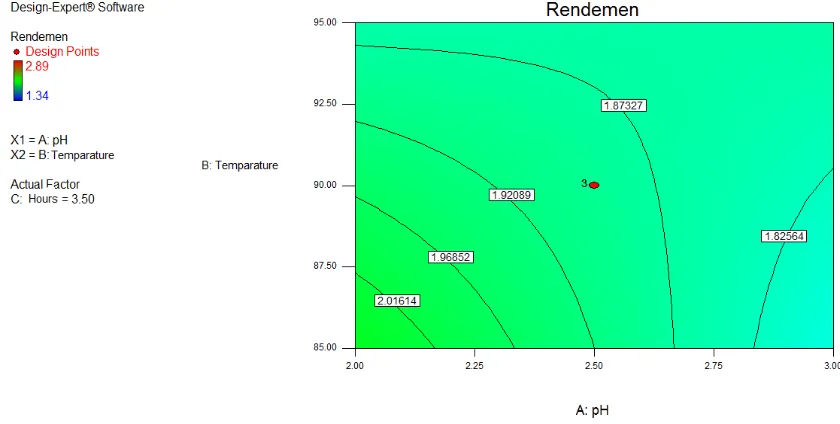
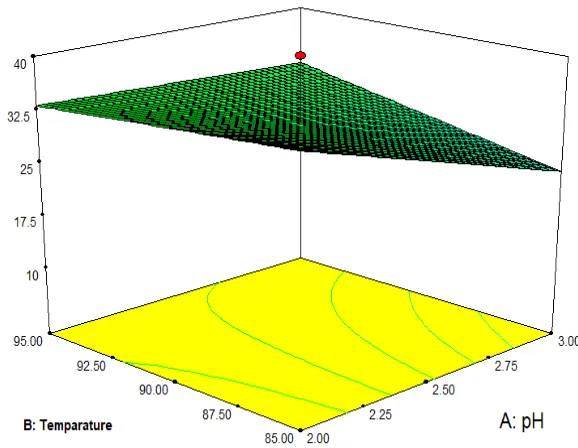
Fig.3 The 2-Dimensions of Response-Surface-Methodology contour, the influence of pH, temperature and time to pectin yield.
Figures 2 and 3 show that pH, temperature and extraction time of cocoa pod affect the yield of pectin produced. The lower the pH, the higher the temperature and the longer the reaction, the higher the yield produced, until it reaches its optimal limit. The lower pH will destroy the cell wall because pectin dissolves in an acidic atmosphere so that pectin yield will increase. The higher the temperature, the pectin produced will also increase. The increase in temperature will increase the penetration of the solvent into the solid matrix (cocoa pod), thereby increasing the mass of polysaccharides that come out of the solid particles, thereby increasing the solubility of pectin until it reaches the optimal limit [17]. The extraction time affects the formation of pectin. Increasing the time of extraction will significantly increase the formation of pectin. The extraction time of 1.5-3 hours using citric acid solvent significantly increases pectin formation [14].
D. Pectin Content
The results of the analysis of variance (ANOVA) produced from the expert design program to obtain pectin content values can be seen in Table 5.
TABLE V
RESULTS OF VARIANCE ANALYSIS (ANOVA) OF PECTIN CONTENTS
Source Sun of Square
df Mean Square
F Value
p-Value Prob>F Model
A-pH B-Suhu C-Waktu AB AC BC Residual Lack of Fit Pure Error Cor Total
1706.03 185.03 19.35 156.08 66.33 555.95 101.55 996.92 817.75 179.173 2702.95
6 1 1 1 1 1 1 13 10 59.7 19
284.34 185.03 19.35 156.08 66.33 555.95 101.55 76.69 81.77.
3.71 2.41 0.25 2.04 0.86 7.25 1.32
1.37
0.0226 0.1443 0.6238 0.1773 0.3693 0.0185 0.2705
0.4429
Significant
Not significant
From Table 5 analysis of variance (ANOVA), it can be stated that the overall model of pectin extraction is significant for pectin content. Extraction parameters that significantly affect are the interaction of pH and the length of time of extraction. The lower the pH the more pectin is dissolved from the cell walls of raw materials that contain pectin. Low pH with longer extraction time will increase the soluble pectin and penetration due to the increase of solvent, this will increase the pectin content [17]. Pectin extraction will be influenced by pH, temperature and time. At low temperatures, the occurrence of protopectin hydrolysis by acids is not maximum. Likewise, at low temperatures, the acidic atmosphere in short time hydrolysis of protopectin does not occur optimally, so that the formation of pectin will be low. Pectin consists of galacturonic acid or methyl ester units connected by α (1,4) glycosidic bonds. The glycosidic bond is a type of ether bond so that it can occur through the hydrolysis reaction under the right conditions, in this case, pH, temperature and extraction time. The optimum conditions for pectin extraction are obtained at 90°C, within 60 minutes [15]. The results of model selection based on lack of fit tests can be seen in Table 6.
TABLE VI
STATISTICS MODEL FOR COCOA POD EXTRACTION FOR PECTIN CONTENT RSM PROGRAM
Source Std. Dev.
R-Squared
Adjusted R-Squared
Predicted R-Squared
Press
Linier 2FI Quadratic Cubic
10.8 8.76 9.67 12.1
0.3373 0.6312 0.6540 0.784
0.2130 0.4609 0.3426 -0.0241
-0.1315 0.1600 -0.5031
3058.3 2270.4 4062.8 +
Suggested Aliased
Table 6 of the statistical model Responses surface
methodology program shows that among the existing models,
namely linear, 2FI, quadratic, cubic, the recommended to be selected from processed design expert is 2FI, because the solution of maximum pectin yield selection is seen in the
the equation of pectin content from pectin extraction research with optimization of pH, temperature and time, the
Responses surface methodology method is used [20]. The
equation resulting from the optimization of extraction of pectin content by RSM method is:
Y2= 79.90607 – 174.28035X1 + 1.88569X2 + 53.08067X3 + 1.05640X1X2 + 20.64326X1X3 – 1.2777X2X3
Note: Y2 = Pectin levels, X1 = pH, X2 = temperature, X3 = time. Figure 4 shows the standard plot of the residual value of pectin content, which is between 10-60%.
Fig.4 Relationship between Response Surface Methodology, Actual and Prediction Value of Pectin Content
Figure 4 on the graph shows that the cocoa pod extraction study for pectin content has a good precision. Some data obtained from research approach the straight line. Predictably, this research is good enough for the optimization of cocoa pod extraction against pectin content.
Obtained pectin content values spread from 10-60%. The surface shape of the interaction between factors to the Responses of pectin content can be seen from the 3-dimensional (3-D) graph in Figure 5.
Fig. 6 2 Dimensions of Surface Response Methodology contour on the effect of pH, temperature and extraction time on Pectin Content.
Figures 5 and 6 show that the pH, temperature and extraction time of cocoa pod affect the amount of pectin significantly. The lower the pH, the higher the temperature and the longer the reaction, the higher the pectin content produced until the optimal limit of the pectin content is reached. The effect of pH on pod extraction is that the lower the pH it will dissolve the pectin in the cell wall so that the pectin content will rise. The higher the temperature the more the solution will penetrate the solid matrix of the subtracted extracted so that the pectin content will increase. The extraction time also influences the pectin content produced. The longer the extraction time, the pectin levels produced are also increasing.
Overall, pH, temperature and reaction time affect the level of pectin produced, until the optimal limit of the cocoa pod extraction process is reached. Temperature affects the solubility of the solute, it is in line with the extraction time. The solvent dissolves the substance during the extraction process. Increasing the temperature and the length of time causes the strength of hydrogen bonds in the water to be reduced so that it will increase the efficiency of the extraction process, this will increase the extraction result [18]. Extraction pH influences the level of pectin produced. The lower the pH, the pectin dissolved in an acidic atmosphere is higher, until the optimum pH point [11].
E. Methoxyl Content of Pectin
In Table 7 can be seen as the results of the analysis of variance (ANOVA) of the methoxyl pectin content resulting from cocoa pod extraction after processing with the Design
Expert Responses Surface Methodology Program as in Table
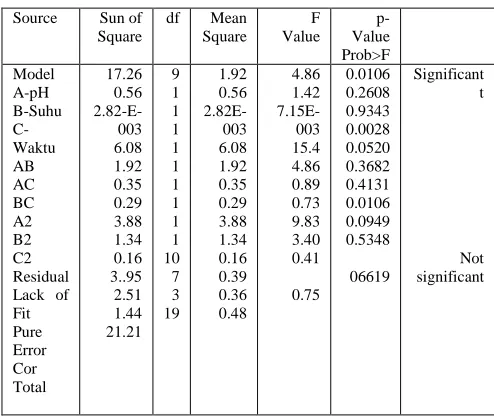
7. From Table 7, analysis of variance (ANOVA) can be seen that the model as a whole is significant. When viewed between the factors of pH, temperature and time of cocoa pod extraction, only time has a significant effect on methoxyl content. Methoxyl content is the amount of methanol present in the pectin. Methanol content determines the gel properties of pectin. The formation of pectin gel is affected by the structure of the tissue of the pectin raw material source. Temperature also affects the properties of pectin; high temperatures will reduce the gel properties of pectin.
TABLE VII
RESULTS OF VARIANCE ANALYSIS (ANOVA) OF METOXYL CONTENT
Source Sun of Square
df Mean Square F Value p-Value Prob>F Model A-pH B-Suhu C-Waktu AB AC BC A2 B2 C2 Residual Lack of Fit Pure Error Cor Total 17.26 0.56 2.82-E-003 6.08 1.92 0.35 0.29 3.88 1.34 0.16 3..95 2.51 1.44 21.21 9 1 1 1 1 1 1 1 1 1 10 7 3 19 1.92 0.56 2.82E-003 6.08 1.92 0.35 0.29 3.88 1.34 0.16 0.39 0.36 0.48 4.86 1.42 7.15E-003 15.4 4.86 0.89 0.73 9.83 3.40 0.41 0.75 0.0106 0.2608 0.9343 0.0028 0.0520 0.3682 0.4131 0.0106 0.0949 0.5348 06619 Significant t Not significant
According to Ref. [21], the increasing temperature will reduce the formation of the gel properties of pectin. The temperatures above 50°C will decrease the gel properties of pectin. As the temperature increases, the pectin gel properties are also increasing, but with the subsequent increase in temperature will decrease the gel properties of pectin. At temperature 95°C indicated low pectin gel formation [22]. The results of selecting a statistical model for the pectin content from cocoa pod extraction can be seen in Table 8.
TABLE VIII
STATISTICAL MODEL OF COCOA POD EXTRACTION FOR PECTIN METHOXYL CONTENT RSM PROGRAM
In Table 8 of the statistical Responses surface
methodology model, that among the existing models, namely
linear, 2FI, quadratic, cubic, the quadratic is chosen. The quadratic model is chosen after selecting the maximum solution to the program and the maximum Adjusted
R-Squared and Predicted R-R-Squared values. The equation
generated from the extraction optimization to the pectin methoxyl content by Responses surface methodology method is:
Y3= -171.36095 + 24.19204X1 +3.11379X2 + 5.83537X3 – 0.18338X1X2 + 0.56883 X1X3-0.067311X2X3 – 2.01272(X1)2 – 0.013459(X2)2 – 0.34831(X3)2
From the design expert software of cacao pod extraction to pectin, methoxyl content can be seen in the standard residual plot in Figure 7.
Fig. 7 Relationship between Response Surface Methodology, Actual and Prediction value of Pectin Methoxyl Content
Figure 7 shows that the value of pectin methoxyl content based on the value of the equation obtained from the calculation of Expert System software and the results of actual research. Many of the research actual results approaching the straight line, although some are a bit far from the straight line, it shows that the research shows a reasonably good precision value. Based on the equation
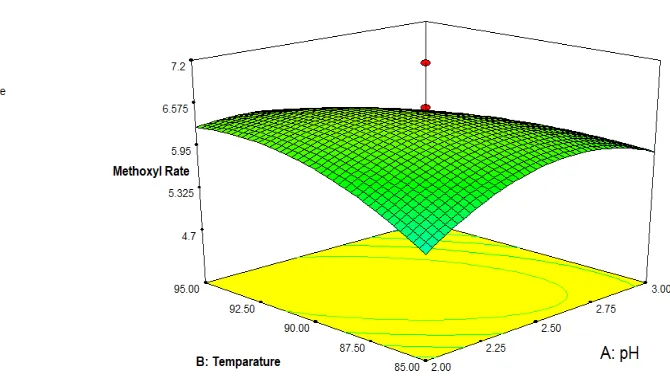
obtained that the value of the pectin methoxyl content is at 4.1106 - 7.7562%. Figures 8 and 9 show the surface Responses and contour Responses from the extraction optimization carried out on the cocoa pod pectin content. Figures 8 and 9 show that pH, temperature and extraction time of cocoa pod affect the pectin content produced.
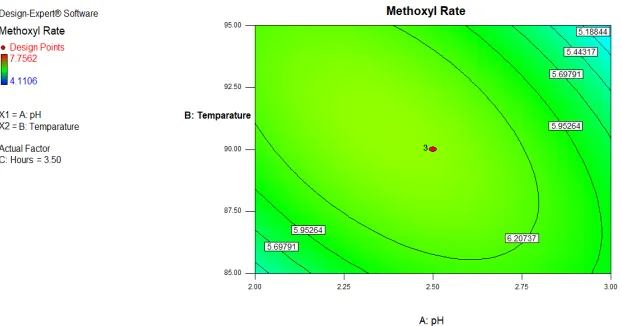
Fig. 9 2 Dimensions Contour of Surface Responses Methodology for the effect of pH, temperature and extraction time on pectin methoxyl content.
The surface shape of the interaction relationship between pH, temperature and time is seen in the 3-D graph (Figure 8) and the 2-dimensional contour graph (Figure 9) shows that the lower the pH, the higher the temperature, and the longer the time, will produce higher methoxyl content until it reaches a certain point. After reaching the optimal point, the effect of pH, temperature and time is no longer increases the pectin methoxyl content. Low pH, the interaction between temperature and reaction time, will give higher methoxyl properties until the optimal limit. [21] and [22] states that pH and temperature greatly affect the methoxyl content produced, so do with the length of extraction time, until it reaches its optimal point. According to IPPA quality standards, the amount of methoxyl produced is classified as low methoxyl content, which is less than 7%. There are only 3 treatments that have more than 7% of methoxyl content.
F. Optimization Solution from Design Expert on the Pectin Yield
An optimization solution to determine the optimal point from RSM program is obtained by determining the variable
criteria of the desired Responses. The criteria of the desired Responses for pectin yield, pectin content and methoxyl content are maximum. The results of the program solution show that optimal extraction at pH 2, temperature 95°C, extraction time 3 hours with 2.33% pectin yield, 44.39% pectin content and 7.08% methoxyl content and 0.71 desirability value [23]. Then after verification, the results obtained are 2.16% pectin yield, 45% pectin content, 8.99% methoxyl content. There is no significant difference between the value of optimal condition prediction of RSM program and the verification results, so the results of the expert program design software from the Responses surface methodology with the central composite design can be accepted to be used in the cocoa pod pectin extraction process to obtain optimal pectin yield, pectin content and methoxyl content [24].
G. FTIR (Fourier Transform Infrared) Analysis
Analysis of FTIR (Fourier Transform Infra-Red) of dried pectin that has been blended, mixed with KBr, made into pellets then analyzed using FTIR spectrophotometer.
Fig. 10 The best RSM spectrum
The spectrum is interpreted to determine the functional groups contained in the pectin. A bond in a molecule that absorbs infrared radiation will vibrate. The amount of absorption in a particular type of bond depends on the type of vibration of the bond. Therefore, different types of bonds absorb infrared radiation at different characteristic
various functional groups. In the absorption band 3443.63 cm-1 shows the absorption peak intensity is very strong and wide, it indicates the presence of O-H strain absorption. The absorption band 2938.85 cm-1 shows the absorption of the C-H strain. The absorption band 1751.41 cm-1 shows the absorption of C = O strain which is thought to originate from the carboxyl group of carboxylic acids which is supported by a very wide O-H absorption band due to hydrogen bonding with its dimer. Absorption at 1254.13 cm-1 shows C-O-C absorption and 1016.81 cm-1 represents symmetric C-O-C absorption (on glycosides bonds) [25]. This data supports that the isolated pectin has the structure shown in Figure 10.
IV.CONCLUSION
This research showed that the length of extraction and the interaction between pH and the length of extraction, significantly affect the pectin yield, and the interaction between pH and the duration of heating time on extraction have a significant effect on the content of pectin, and the interaction between pH and time significantly affects the methoxyl content of pectin. Overall, pH, temperature and extraction time of cocoa pod are significantly affecting the yield, pectin content and methoxyl content. The optimum conditions for extracting cocoa pod pectin with Responses
surface methodology are pH 2, temperature 95°C and
extraction time 3 hours with predicted pectin yield 2.33% pectin content 44.39% and methoxyl content 7.08%. After verification, the result is pectin yield 2.16%, pectin content 45% and methoxyl content 8.99%. The significant difference between the prediction of the program and the results of verification means that the optimal process of extracting cocoa pod pectin is acceptable. From FTIR test of pectin, it is known that the absorption band 3443.63 cm-1 shows a very strong and wide absorption peak intensity, the presence of O-H absorption, strain. The absorption band 2938.85 cm-1 shows the absorption of C-H strain. The absorption band 1751.41 cm-1 shows the absorption of C=O strain which is thought to originate from the carboxyl group of carboxylic acids which is supported by an extensive O-H absorption band due to the presence of hydrogenic bonds with its dimers. Absorption at 1254.13 cm-1 shows the absorption of C-O-C and 1016.81 cm-1 represents symmetric C-O-C absorption (on glycosides bonds)
REFERENCES
[1] F. Fioresi et al., “Chemical modification of the cocoa shell surface using diazonium salts,” J. Colloid Interface Sci., vol. 494, pp. 92–97, 2017.
[2] Y. Chen, J. G. Zhang, H. J. Sun, and Z. J. Wei, “Pectin from Abelmoschus esculentus: Optimization of extraction and rheological properties,” Int. J. Biol. Macromol., vol. 70, pp. 498–505, 2014. [3] S. Khanahmadi, F. Yusof, H. Chyuan Ong, A. Amid, and H. Shah,
“Cocoa pod husk: A new source of CLEA-lipase for preparation of low-cost biodiesel: An optimized process,” J. Biotechnol., vol. 231, pp. 95–105, 2016.
[4] M. D. G. De Luna, Murniati, W. Budianta, K. K. P. Rivera, and R. O. Arazo, “Removal of sodium diclofenac from aqueous solution by adsorbents derived from cocoa pod husks,” J. Environ. Chem. Eng., vol. 5, no. 2, pp. 1465–1474, 2017.
[5] P. Judith et al., “Food Hydrocolloids Edible fi lms from pectin: Physical-mechanical and antimicrobial properties - A review,” vol. 35, 2014.
[6] R. M. Zaid, P. Mishra, S. Tabassum, Z. A. Wahid, and A. M. M. Sakinah, “High methoxyl pectin extracts from Hylocereus polyrhizus’s peels: Extraction kinetics and thermodynamic studies,” Int. J. Biol. Macromol., 2019.
[7] F. Priyangini, S. G. Walde, and R. Chidambaram, “Extraction optimization of pectin from cocoa pod husks (Theobroma cacao L.) with ascorbic acid using response surface methodology,” Carbohydr. Polym., vol. 202, pp. 497–503, 2018.
[8] A. M. Idrovo Encalada et al., “High-power ultrasound pretreatment for efficient extraction of fractions enriched in pectins and antioxidants from discarded carrots (Daucus carota L.),” J. Food Eng., vol. 256, pp. 28–36, 2019.
[9] B. Utomo, A. A. Prawoto, S. Bonnet, A. Bangviwat, and S. H. Gheewala, “Environmental performance of cocoa production from monoculture and agroforestry systems in Indonesia,” J. Clean. Prod., vol. 134, no. Part B, pp. 583–591, 2016.
[10] S. S. Hosseini, F. Khodaiyan, and M. S. Yarmand, “Aqueous extraction of pectin from sour orange peel and its preliminary physicochemical properties,” Int. J. Biol. Macromol., vol. 82, pp. 920–926, 2016.
[11] P. H. F. Pereira et al., “Pectin extraction from pomegranate peels with citric acid,” Int. J. Biol. Macromol., vol. 88, pp. 373–379, 2016. [12] C. Colodel, L. C. Vriesmann, R. F. Teófilo, and C. L. de Oliveira
Petkowicz, “Extraction of pectin from ponkan (Citrus reticulata Blanco cv. Ponkan) peel: Optimization and structural characterization,” Int. J. Biol. Macromol., vol. 117, pp. 385–391, 2018.
[13] R. F. Caroço, B. Kim, P. A. Santacoloma, J. Abildskov, J. H. Lee, and J. K. Huusom, “Analysis and model-based optimization of a pectin extraction process,” J. Food Eng., vol. 244, pp. 159–169, 2019. [14] S. Y. Chan and W. S. Choo, “Effect of extraction conditions on the
yield and chemical properties of pectin from cocoa husks,” Food Chem., vol. 141, no. 4, pp. 3752–3758, 2013.
[15] A. A. Sundarraj, R. Thottiam Vasudevan, and G. Sriramulu, “Optimized extraction and characterization of pectin from jackfruit (Artocarpus integer) wastes using response surface methodology,” Int. J. Biol. Macromol., vol. 106, pp. 698–703, 2018.
[16] C. Li, Q. Xiao, Y. Tang, and L. Li, “A method integrating Taguchi, RSM and MOPSO to CNC machining parameters optimization for energy saving,” J. Clean. Prod., vol. 135, pp. 263–275, 2016. [17] J. Lu, J. Li, R. Jin, S. Li, J. Yi, and J. Huang, “Extraction and
characterization of pectin from Premna microphylla Turcz leaves,” Int. J. Biol. Macromol., vol. 131, pp. 323–328, 2019.
[18] S. Q. Liew, W. H. Teoh, C. K. Tan, R. Yusoff, and G. C. Ngoh, “Subcritical water extraction of low methoxyl pectin from pomelo (Citrus grandis (L.) Osbeck) peels,” Int. J. Biol. Macromol., vol. 116, pp. 128–135, 2018.
[19] Z. Raji, F. Khodaiyan, K. Rezaei, H. Kiani, and S. S. Hosseini, “Extraction optimization and physicochemical properties of pectin from melon peel,” Int. J. Biol. Macromol., vol. 98, pp. 709–716, 2017.
[20] M. Abid, C. M. G. C. Renard, A. A. Watrelot, I. Fendri, H. Attia, and M. A. Ayadi, “Yield and composition of pectin extracted from Tunisian pomegranate peel,” Int. J. Biol. Macromol., vol. 93, pp. 186–194, 2016.
[21] J. Zheng, R. Zeng, J. Kan, and F. Zhang, “Effects of ultrasonic treatment on gel rheological properties and gel formation of high-methoxyl pectin,” J. Food Eng., vol. 231, pp. 83–90, 2018.
[22] W. Wang et al., “Applications of power ultrasound in oriented modification and degradation of pectin: A review,” J. Food Eng., vol. 234, pp. 98–107, 2018.
[23] X. Zhai, C. Zhu, Y. Li, Y. Zhang, Z. Duan, and X. Yang, “Optimization for pectinase-assisted extraction of polysaccharides from pomegranate peel with chemical composition and antioxidant activity,” Int. J. Biol. Macromol., vol. 109, pp. 244–253, 2018. [24] I. G. Moorthy, J. P. Maran, S. M. Surya, S. Naganyashree, and C. S.
Shivamathi, “Response surface optimization of ultrasound assisted extraction of pectin from pomegranate peel,” Int. J. Biol. Macromol., vol. 72, pp. 1323–1328, 2015.