Volume 2 2010/2011 Academic Year Issue Article 7
January 2010
Herding evidence in Chinese stock market : a study of the
Herding evidence in Chinese stock market : a study of the
relationship between stock price index and trading volume based
relationship between stock price index and trading volume based
on behavioral finance theory
on behavioral finance theory
Xiaofeng ZHAO
x4zhao@ln.edu.hk
Follow this and additional works at: https://commons.ln.edu.hk/ljbfe
Part of the Finance Commons, and the Finance and Financial Management Commons
Recommended Citation Recommended Citation
Zhao, X. (2010). Herding evidence in Chinese stock market: A study of the relationship between stock price index and trading volume based on behavioral finance theory. Lingnan Journal of Banking, Finance and Economics, 2. Retrieved from http://commons.ln.edu.hk/ljbfe/vol2/iss1/7
Herding Evidence in Chinese Stock Market:
A Study of the Relationship between Stock Price
Index and Trading Volume based on Behavioral Finance
Theory
Xiaofeng ZHAO
Abstract
Over the last couple decades, more evidence has been found supporting the notion that investors are not always rational. Herding behaviors have been observed in both the stock market crash1 and financial bubbles2, which were beyond the understanding of modern finance theory. In this paper, the herding phenomenon was explored in the Chinese stock market by the study of the relationship between stock prices and trading volume over the past 7 years. It was found that the change of price is statistically significant to have caused the change of trading volume, but the reverse is not true. Theoretically, this identifies persistent herding phenomenon in the Chinese stock market. The findings provide useful investment guidance for investors and new considerations in financial reform for the government.
1Stock Market Crash of 1929
October 24, 1929, known as the Black Thursday, marked the start of the crash of 1929. This was followed by Black Monday and Tuesday, the very next week. The Dow Jones Industrial Average fell more than 20% just on Monday and Tuesday alone. By mid-November, the index had dropped by around 40% compared to its peak just a couple of months ago. The index lost almost 90% of its value, before it began a gradual uptrend in mid 1932.
2
Stock Market Crash of 1987
Introduction
Modern finance theories have evolved based on the assumptions that people are unbiased in their predictions about the future, and rational in decision making. However, psychologists have known for a long time that those assumptions are inaccurate because people oftentimes make predictable errors in their forecasts, and act in a seemingly irrational manner3. If many people suffer from irrationality simultaneously, then signs (e.g. herding) can be found in the markets. As a result, the market can sometimes be inefficient.
Behavioral finance proposes psychology based theories to explain stock market anomalies. These theories have two building blocks: cognitive psychology (how people think) and the limits to arbitrage (what people do, resulting in market inefficiency). These two blocks are closely related because how people response/react to one thing is determined, to some extent, by the way they have interpreted that thing.
Cognitive bias: Cognitive psychologists have documented many patterns regarding how people behave. One important pattern is overconfidence which causes people to overestimate their knowledge, underestimate risks, and exaggerate their ability to control events. Considering venture capital as an example, starting a new business is risky. In fact, most new businesses fail. When 2994 new businesses owners were asked about their chances of success, they thought they had a chance of 70% to succeed, while only 39% thought that any other business like theirs is likely to be as successful as theirs(1988, Arnold C. Cooper, Carolyn Y. Woo). It‟s overconfidence that causes people overestimate their skills. If later these businesses fail, most likely these businessmen will attempt to believe that it‟s due to bad luck or the market, instead of any personal factors. This is called the self-attribution bias and this pattern also happens in the stock market and is the basic idea of this paper.
Limits to arbitrage: Misevaluation of financial assets is common in the market. Arbitrage opportunity, if present, will disappear quickly. However, under some circumstances, withdrawals of capital after a losing streak may actually result in selling pressure that intensifies the inefficiency. It is the same story when strong capital inflows happen. In both cases, people behave in a herding fashion. As someone learn what other people think about various stocks, the social consensus forms. One minute the herd is doing nothing, and the next minute the herd is galloping at full speed4.
Emirer et al, indicates that the level of herding is higher in emerging market (12 Dec, Rıza Emirer, Daigo Gubo and Ali M. Kutan). The Chinese stock market is known for being full of speculation; the lack of sophisticated investors and proper regulations intensifies the psychological bias, which leads to market inefficiency. In this paper we will use empirical method to explore whether the irrational pattern (herding) does really exist in the Chinese stock market. This will give us a better understanding of the Chinese stock market.
3 http://www.physcomments.org/wiki/index.php
Framework
1. Story (theory blocks):
Investors suffer from psychological and emotional bias in similar pattern, regardless of whether they are individual investors or financial institutions. Successful and more experienced forecasters have “learned to be overconfident”. It is not just individuals who are affected, markets also become overconfident when market returns have gets high (2005, Richard Deaves, Erik Lüders, Michael Schröder). As such, we will use index as the market proxy instead of exploring individual stock prices. And we will also assume that individual investors and financial institutions behave in indistinctive manners.
One contributing factor to the overconfident pattern is the self-attribution bias, which is the tendency of humans to attribute successful outcomes to their skill and to blame unsuccessful outcomes on their bad luck. Investors who experience a run of successful results start to develop an inflated opinion of their own skills, which may possibly result in both complacency and exaggerated risk taking5. Such cognitive psychology is dangerous as investors are in denial and therefore cannot successfully learn from his or her mistakes.
Just to put the idea in a simple example: assume you have just purchased one stock after a due diligent analysis. The price actually turned out to rise after purchasing. You will be happy and become more confident in yourself thinking, believing that it‟s your distinctive analysis approach or your investment strategy that contributed to the success. You attribute the success to your good skills ignoring whether the market is still too good.
Warren Buffett once told a story: There was a duck in the pond, after a torrential rainstorm, it began to float up, thinking that its paddling skills have caused it to rise instead of the rising water.
This story tells the same thing. Once people‟s concepts or beliefs have to be recognized, exaggerated risk are going to be taken to increase investment (chasing). Considering one after two investments in above example, the former one is decision after formal analysis (assuming it is rational), the later one is nothing but just chasing (as if purchasing without any brain). Unintentionally, the investment strategy has changed, and investors have not realized.
When many investors behave in this manner, trading volume tends to increase as a consequence. It would magnify the arbitrage opportunities if available and prevent the market from being efficient. This process is a phenomenon of herding. As such, we want to find the herding evidence by studying the relationship between index levels and trading volume.
2. Assumptions and hypothesis
The purpose of this paper is to explore whether irrational pattern (herding) does exist in the Chinese stock market. The researcher uses empirical method to study the study relationship between market index level and trading volume.
Three assumptions are made:
In short term, arbitrage opportunity can exist in both rational and irrational markets
Index is a good proxy for the market
Individuals and financial institutions behave in indistinctive manners.
Hypotheses:
H0: People are rational: they invest based on formal analysis, and not suffer from
psychological and emotional factors, hence no herding
Ha: People are not always rational: psychological and emotional factors involve in
the investment decision making, hence there will be herding
3. Inferences procedures & estimation
If H0 is correct, it‟s reasonable to expect that trading will cause the change of price
and the volume is therefore useful in the prediction of price. If people are rational, they should follow rational investment process. After formal analysis, if investors think some stocks are undervalued they will purchase immediately to catch the opportunity before it disappears. Increase in transactions (rising of trading volume) will drive the stock price up until they reach the efficient level. Because we assumed that, in short term, arbitrage opportunity can exist in both rational and irrational markets; stocks can be undervalued, even though H0 is really true. So, if H0 is true,
trading being the cause of the change in stock price is expected.
If Ha turns out be true, it‟s reasonable to expect that, change of stock price will cause trading, and that stock prices are useful in the prediction of volume. In other words, it is the change of the stock prices that gives investors the signal to buy or sell. If people are not rational, they would follow irrational investment process. Assume you already have some shares on hand, or made some forecast and have been waiting to buy; after watching price going up, and recognizing the superiority of personal skills and experience, you rarely hesitate to increase the investment to catch the herd. So if
Ha, is true, the change of the price causing trading is expected.
4. Data
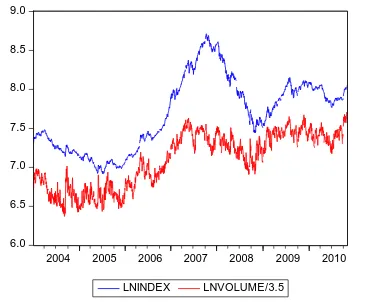
We will use SSE Composite Index of Chinese stock market as the market index. It is an index of all stocks (A shares and B shares) that are traded on the Shanghai Stock Exchange. It is the most comprehensive measure and is widely used in the Chinese stock market. We will now introduce the notations of time series variables used in this paper.
index: the level of SSE Composite Index
lnindex: log of index
dlnindex: log difference of index
volume: the trading volume of SSE Composite Index
lnvolume: log of volume
dlnvolume: log difference of volume
so that two time series can compatibly put in one graph. The unit root test shows that lnindex is first-order stationary I(1), and lnvolume is stationary I(0), which will be discussed in next section (see appendix).
Figure 1-1
6.0 6.5 7.0 7.5 8.0 8.5 9.0
2004 2005 2006 2007 2008 2009 2010 LNINDEX LNVOLUME/3.5
Source: CSMAR Database, Jan 01 2004—Nov 17 2010
Modeling
1. Basic model
From the hypothesis and the estimates we made, we try to explore one variable (e.g. index) at the angel of the other one (e.g. volume), and then turn around, which indicates the characteristics of being simultaneous. So, to make the model simply we will use VAR model. The basic format is:
Equation 1-1:
2. Unit root and cointegration test
All variables used in our model are time series data. Before we decide how to apply our model, we have to know whether those series are stationary or not. To do this and unit root tests are used and the results provided by E-views show that lnindex is first-order stationary I(1), and lnvolume is stationary I(0). (Details in appendix).
Cointegration test between lnindex and lnvolume is not needed as lnvolume is stationary already. We have concluded that there should not be any long-term relationship between stock and trading volume even without cointegration test. It is because stock value is determined by the performance of the companies, not by how they are traded in the exchange and therefore, price and trading volume should not have any fundamental relationship in the long-term.
3. VAR model
As lnindex is first-order stationary I (1), and lnvolume is stationary I (0), and cointegration is not available under this situation, we will use VAR (1) model instead of Vector Error Correction Model (VECM).
Equation 1-2:
dlnindex
t=
0+
1dlnindex
t-1+
1dlnvolume
t-1+
e
tdlnvolume
t=
0+
1dlnindex
t-1+
1dlnvolume
t-1+
u
tHowever, there is also an economical meaning between log difference of index (dlnindex) and log of volume (lnvolume). Empirical work based on time series data assumes that the underlying time series is stationary. This means running the Model (dlnindex, lnvolume) also make sense. So instead, we will use:
Equation 1-3:
dlnindex
t=
0+
1dlnindex
t-1+
1lnvolume
t-1+
e
tdlnvolume
t=
0+
1dlnindex
t-1+
1lnvolume
t-1+
u
t4. Optimal lag choosing
Running the model (Equation 1-3), we have to choose the best lag first.
VAR Lag Order Selection, Table 1-1
Lag FPE AIC
0 0.000533 -1.860620
1 1.26e-05 -5.608320
2 1.16e-05 -5.689785
3 1.13e-05 -5.715787
4 1.10e-05 -5.738995
5 1.10e-05 -5.739409
6 1.10e-05 -5.740650
7 1.10e-05 -5.742040
8 1.10e-05* -5.745179*
Based on the AIC criteria, the optimal lag is 8 because its value is the smallest one, which minimizes the sum of residual square and number of parameters.
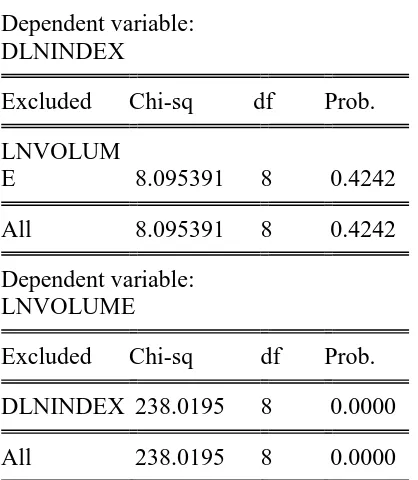
5. Granger Causality
Table 1-2:
Dependent variable: DLNINDEX
Excluded Chi-sq df Prob.
LNVOLUM
E 8.095391 8 0.4242
All 8.095391 8 0.4242
Dependent variable: LNVOLUME
Excluded Chi-sq df Prob.
DLNINDEX 238.0195 8 0.0000
All 238.0195 8 0.0000
At the 5% significant level, index is not significant to cause volume. Even at the 10% significant level, we still cannot reject the notion that index does not cause volume. However, volume is very significant to cause index. T his result is good, as it supports our estimations and favors the alternative hypothesis.
6. Impulse Responses
Table 1-3:
-.005 .000 .005 .010 .015 .020
1 2 3 4 5 6 7 8 9 10 Response of DLNINDEX to DLNINDEX
-.005 .000 .005 .010 .015 .020
1 2 3 4 5 6 7 8 9 10 Response of DLNINDEX to LNVOLUME
.04 .08 .12 .16 .20
1 2 3 4 5 6 7 8 9 10 Response of LNVOLUME to DLNINDEX
.04 .08 .12 .16 .20
1 2 3 4 5 6 7 8 9 10 Response of LNVOLUME to LNVOLUME Response to Cholesky One S.D. Innovations ± 2 S.E.
Table 1-3 indicates that, index does not respond much to a one-time shock coming from volume (top right figure); however, trading volume responds explosively to index (left down figure), which means that the change of index level is influential to the trading volume, but not the other way around.
7. Variance Decomposition
Table 1-4:
0 20 40 60 80 100
1 2 3 4 5 6 7 8 9 10
Percent DLNINDEX variance due to DLNINDEX
0 20 40 60 80 100
1 2 3 4 5 6 7 8 9 10
Percent DLNINDEX variance due to LNVOLUME
0 20 40 60 80 100
1 2 3 4 5 6 7 8 9 10
Percent LNVOLUME variance due to DLNINDEX
0 20 40 60 80 100
1 2 3 4 5 6 7 8 9 10
Percent LNVOLUME variance due to LNVOLUME
Variance Decomposition
It indicates that, in forecasting the index, most or all error variance comes from itself and not from volume. Volume is useless in the prediction of index. On the other hand, in forecast of volume, about 75% error variance can be explained by itself, with the remaining by index. Index makes some contribution in the prediction of volume.
8. Implications
Limitations and Extensions
1. limitations
The result seems perfect to reject H0 and in favor of Ha, this implies that irrational
pattern (herding) does exist in Chinese stock market. Such pattern suggests inefficiency of the market.
Even though herding exists, not all misevaluations are caused by psychological biases. Some are merely due to temporary supply and demand imbalances. For example, the tyranny of indexing can lead to demand shifts that are unrelated to the future cash flows of the firm. When Yahoo was added to the S&P 500 in December 1999, index fund managers had to buy the stock, even though it had a limited public float. This extra demand drove the price up by over 50% in a week, and over 100% in a month. Eighteen months later, the stock price was down by over 90% from where it was shortly after being added to the S&P.
The other limitation is that the assumption-- individuals and financial institutions behave in indistinctive manners-- may not be true in reality. Financial institutions are trained to be more professional; as such, they tend to invest based on unique strategies. They are subject to strict regulations, and therefore on a whole they are less likely to make emotional decisions when compared to individual investors.
2. Extensions
On one hand, one investor might profit from the market inefficiency if he or she is the only one person who understands the mechanism of the irrational patterns of the market. Just as Buffett said “Be fearful when others are greedy. Be greedy when others are fearful”. It can be a philosophy derived from behavioral study. On the other hand, the herding phenomenon is a big problem for the development of Chinese stock market. It makes the market very inefficient. Herding causes people to be extremely optimistic and thus market bubble. In 2007, The Shanghai Stock Exchange index rocketed from 2,700 points to 6,400 points, a 130 percent rise. However, the performance of those listed companies on which the growth of the domestic stock market depends has not made much noticeable progress although stock reforms have been carried out in majority of these firms.
To reduce herding activities, more financial education, especially behavioral finance, should be taught. Cognitive bias can be corrected through related education. Therefore as China accelerates the development of financial industry, she should also increase the financial education.
Conclusion
However, not all misevaluations are caused by psychological biases and individuals and financial investors might behave in different manners. Restructuring our model to take into consideration of the above limitations might strengthen the thesis.
Reference
Arnold C. Cooper, Carolyn Y. Woo, and William C. Dunkelberg, “Entrepreneurs‟‟ Perceived Chances for Success”
Arnold C. Cooper, Carolyn Y. Woo, and William C. Dunkelberg, “Entrepreneurs‟‟ Perceived Chances for Success”
Jay R. Ritter, “Behavior Finance”, Pacific-Basin Finance Journal Vol. 11, No. 4, (September 2003) pp. 429-437
John R. Nofsinger, “The psychology of investing (4th Edition) (The Prentice Hall Series in Finance)”, 2008
Rıza Demirer, Daigo Gubo and Ali M. Kutan, “An Analysis of Cross-Country Herd Behavior in Stock Markets: A Regional Perspective”, December 2007
Richard Deaves, Erik Lüders, Michael Schröder, “The dynamics of overconfidence: Evidence from stock market forecasters”, October 7, 2005
Appendix
Unit root test
Unit root test on the level of lnindex with trend and intercept
t-Statistic Prob.*
Augmented Dickey-Fuller test statistic -1.088691 0.9293
Test critical values: 1% level -3.963581
5% level -3.412519
10% level -3.128214
Unit root test on 1st difference of lnindex with intercept
t-Statistic Prob.*
Augmented Dickey-Fuller test statistic -40.44734 0.0000
Test critical values: 1% level -3.434087
5% level -2.863078
10% level -2.567636
Unit root test on level of lnvolume with trend and intercept
t-Statistic Prob.*
Augmented Dickey-Fuller test statistic -4.357155 0.0026
Test critical values: 1% level -3.963591
5% level -3.412523