A COMPARATIVE STUDY OF WUM TOOLS TO
ANALYZE USER BEHAVIOUR PATTERN FROM WEB
LOG DATA
*Navjot Kaur, **Dr. Himanshu Aggarwal
*Assistant Professor, Department of CSE, Punjabi University, Patiala **Professor, Department of CSE, Punjabi University, Patiala
ABSTRACT
Web usage mining(WUM) , also known as Web Log Mining is the application of Data Mining techniques,which are applied on large volume of data to extract useful and interesting patterns from Web data, specifically from web logs, in order to improve web based applications. Data source of web usage mining is web log files ,each entry of which contain the public information of visitor like IP address, remote user, date, time , zone, method, URL, status code, number of bytes transferred, operating system used etc. There are variety of tools available for analyzing a log file and generating the reports. In order to reveal the best tools for analyzing a log file that helps in decision making, this paper has conducted a comparative study between Statcounter and Deep log Analyzer , freely available tools. This paper also presents the results of one of these tools called Stat counter for analyzing the behavioural pattern of user who access a website which sells guitar.
Keywords
Web Mining, Web Access Logs, Web usage Mining, Access Log Analyzer.
1.INTRODUCTION
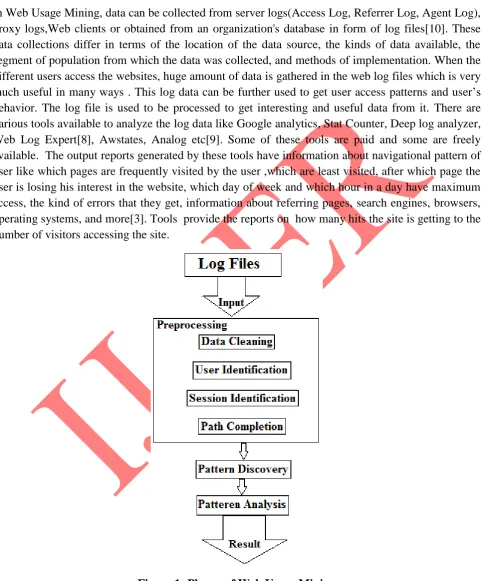
Web Usage Mining , is the application of the various data mining techniques for extracting or discovering interesting usage patterns in clickstreams from large data generated as a result of user interactions with websites.[1] These patterns can give us valuable insights about the user browsing behaviour and their origin which ultimately helps to better understand and serve their needs by improving the websites and web- based applications. [2]. Web usage mining also known as web log mining can be divided into three phases shown in figure 1, pre-processing, pattern discovery, and pattern analysis[5].
Data Preprocessing: It is a very important phase in web usage mining,which is consist of phases
like data cleaning,user identification,session identification and path completion[7].
Pattern Discovery: Apply different data mining techniques like statistical analysis , association
rules, sequential patterns, clustering and classification on processed data for discovering patterns.
Pattern Analysis: Once patterns are discovered or uninterested rules are filtered out then analysis
2. LOG ANALYZER TOOL
In Web Usage Mining, data can be collected from server logs(Access Log, Referrer Log, Agent Log), proxy logs,Web clients or obtained from an organization's database in form of log files[10]. These data collections differ in terms of the location of the data source, the kinds of data available, the segment of population from which the data was collected, and methods of implementation. When the different users access the websites, huge amount of data is gathered in the web log files which is very much useful in many ways . This log data can be further used to get user access patterns and user’s behavior. The log file is used to be processed to get interesting and useful data from it. There are various tools available to analyze the log data like Google analytics, Stat Counter, Deep log analyzer, Web Log Expert[8], Awstates, Analog etc[9]. Some of these tools are paid and some are freely available. The output reports generated by these tools have information about navigational pattern of user like which pages are frequently visited by the user ,which are least visited, after which page the user is losing his interest in the website, which day of week and which hour in a day have maximum access, the kind of errors that they get, information about referring pages, search engines, browsers, operating systems, and more[3]. Tools provide the reports on how many hits thesite is getting to the number of visitors accessing the site.
Figure 1: Phases of Web Usage Mining
pages of the website and applications incorprating the general user requirements and customising and personalising for individuals as well. Thus web usage mining can be significantly useful in increasing or getting the number of visitor or users to websites or applications keep track of the visitors and turning the websites visitors into customers and partners especially in case of an e-commerce, e-learning, e-business, e-e-commerce, e-newspaper, e-government and digital libraries
3. THE COMPARATIVE STUDY
The methodology of the study constitute of collecting a set of free web log analyzer tools to be tested and specifying the data sets to be used to test the tools' performance. The first step in the methodology consists of selecting a tools to be tested,which are freely available. There are variety of tools available for analyzing a log file and generating the reports. Statcounter and Deep log analyzer tools are widely used to analyze log file. Therefore in this section we are comparing the features of these tools.
Statcounter: A highly powerful online analysis tool freely available which assists in making
informed decisions about improving your website design and features to enhance the accessibility of your website[4].
Deep log Analyzer:An easy to use and install paid log analysis tool. Trail version is also
available for few days. It is fast and powerful access log analyzer.GUI of this tool is user friendly[6].
Log data is required to run these tools. Log data is the public details of visitors stored in log file in some format[10]. In deep log analyzer user just needs to install this software on computer and process their existing log files. Where as statcounter does not import raw logs, it will directly access the access pattern of user from website. One need to have their own website and place small piece of code on each page of that website. Whenever someone will visit your website, that code will be executed and the visitor’s public Information will be stored to analyse. A comparative study between StatCounter and Deep Log Analyzer has beendone and important features are shown in table 1.
Table 1. Comparision between Statcounter and DeepLog Analyzer
Sr. No .
Features StatCounter Deep Log Analyzer
1 Vendor Guinness Enterprise Centre Deep Software Inc
2 Website http:/statcounter.com/ http://www.deep-software.com/
3 Current
Edition and Version
Single Professional, Pro, Free Edition and
Current Version 6.0
install and use
to use for demo Service , for your own websites you need to create an account first, then add projects as per requirement
profile creation is required before it can be used.
5 Log file
Required
No log file is required to read because stat counter directly accesses the “access pattern” of user from website.
Yes , It can analyze web server log files not from any other programs (server). Deep log analyzer can read unix or window/IIS hosting files. In this log file can also access through ftp or from your local drive. Deep Log analyser can set up your project to run by scheduler which will automatically download and import the log file.
6 Report
Generatin g Feature
Reports can be exported in CSV, Excel or PNG format. User can also set up monthly, weekly, or daily automated delivery of email reports.
Graphs can be exported in png format. All standard and custom reports can be exported to HTML for easy Emailing. Export list feature of Deep log Analyzer allows to extract and obtain multiple reports to a single framed HTML.
7 Freeware Yes; Paid only in case of
websites where the number of pageloads grow beyond 2.5 lakhs per month
No, But Trial version of 25 days is available
8 Compress
ed Log
Files
No need of any log file to read as directly accesses website statistics
It can read compressed log files without unzipping them
9 Real Time
monitorin g
Yes, It monitor actual human activity.
Yes
10 Apps for
android and IOS
Yes, These apps are free to download and use.
No
11 Identifyin
g
Returning Visits
The record of the visits returning to the same page more than once is maintained by the web tracker.
reported
12 Robot
Requests
No, the robot requests made to the website will only be recorded in the log files and not by StatCounter
Yes, robot requests are recorded by Access log analyzer.
13 Web Proxies
Even if user is accessing the web through a web proxy, It can accurately count unique visits.
In Log file analysis ,it is very difficult to accurately find unique visits to the website.
14 Framed
Website
An access on framed website is counted as a single visit without any problem.
It causes problem in counting the single visit of a framed website
15 Filter
Report
StatCounter allows you to filter report to answer many different questions about your visitors. Available report filters are by location, ISP, Traffic Source etc.
It also has filter report option, just type text in a field above the report window and view only those rows of the report that contain the typed text. You can also filter reports by date.
16 Custom
Reports
Yes , User can create custom reports according to his requirement
Yes user can create his own reports using SQL queries.
17 Keyword
analysis
Yes Yes
18 Demo
Service
In case you don’t have your own website Stat counter also provide a free demo service which contain live data from a real Website which sells guitars and musical instruments online
http://www.guitar-online.com/en/
Deep Log Analyzer provide you the sample project and log file with which you can check the working of this tool.
19 Cookies It provide various cookies like
session, remember me, blocking, analytic, OpenX, Third party advertiser,
Vbulletin,Wordpress,Pootle and Olark that may be set when you visit statcounter for better traking the unique visitors.
DeepTracker supports persistent cookies to better track individual visitors, especially those that visit multiple times (returning visitors)
last page-loads included in detailed analysis depends on the log size. It offers a log size of 500 page loads for above user needs to pay price.
from log files into MS
Access database Separate mdb file is used for each project and it could have size up to 2Gb.
From the above comparison we can say that statcounter is more useful and powerful tool which helps in improved decision-making about the website as compared to the deep log analyzer. Where as in some cases deep log analyser is also good to use. The statcounter provides more realistic figure of the visitors accessing the website. So it track real people. But if you want to know when your website is being ‘indexed’ by ‘search engine spider’,you have to use deep log analyzer. Further if you want to use statcounter you need to change your website code by placing statcounter tracking code on your website pages.Which is not in the case of deep log analyser.But professional edition of deep log analyzer provides some more features as printing of reports,scheduler etc. The advantage of statcounter is that you need to place a code only on those pages which you want to track not on all pages of your website. But Log file will track all server requests by default. Deep Log Analyzer imports data from log files into MS Access mdb database file which allows you to write your own queries.
4 EXPERIMENTS AND EVALUATION
Figute 2: Snapshot of Statcounter
Table 2 shows the summary of web tracking of 15days giving the total, average and daily page views, unique visits, first time visits and returning visits, including the hourly ,weekly ,quarterly ,and yearly summary . Thus, this phase gives you the information of overall usage accessibility of website.Total page loads during this 15 day time period is 1079,unique visits are 720, first time visits are 687 and returning visits are 33.
Table 2: Summary of web tracking
Day Date
Page Loads
Unique Visits
First Time Visits
Returning Visits
Monday
31st August
2015 68 51 51 0
Tuesday
1st September
2015 102 74 70 4
Wednesday
2nd September
2015 55 42 41 1
Thursday
3rd September
2015 77 53 50 3
Friday
4th September
2015 56 38 37 1
Saturday
5th September
2015 38 27 24 3
Sunday
6th September
Monday
7th September
2015 37 31 29 2
Tuesday
8th September
2015 78 47 43 4
Wednesday
9th September
2015 90 55 50 5
Thursday
10th September
2015 57 41 39 2
Friday
11th September
2015 87 70 70 0
Saturday
12th September
2015 75 56 56 0
Sunday
13th September
2015 117 47 43 4
Monday
14th September
2015 84 49 46 3
Total 1079 720 687 33
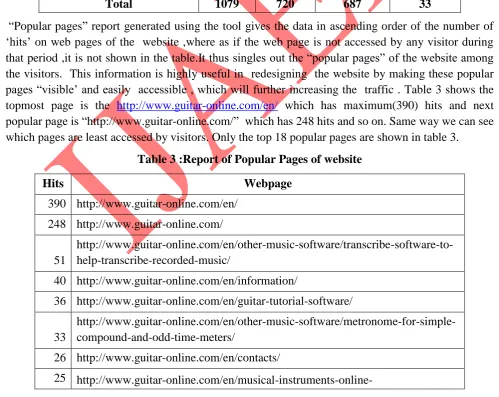
“Popular pages” report generated using the tool gives the data in ascending order of the number of ‘hits’ on web pages of the website ,where as if the web page is not accessed by any visitor during that period ,it is not shown in the table.It thus singles out the “popular pages” of the website among the visitors. This information is highly useful in redesigning the website by making these popular pages “visible’ and easily accessible , which will further increasing the traffic . Table 3 shows the topmost page is the http://www.guitar-online.com/en/ which has maximum(390) hits and next popular page is “http://www.guitar-online.com/” which has 248 hits and so on. Same way we can see which pages are least accessed by visitors. Only the top 18 popular pages are shown in table 3.
Table 3 :Report of Popular Pages of website
Hits Webpage
390 http://www.guitar-online.com/en/
248 http://www.guitar-online.com/
51
http://www.guitar-online.com/en/other-music-software/transcribe-software-to-help-transcribe-recorded-music/
40 http://www.guitar-online.com/en/information/
36 http://www.guitar-online.com/en/guitar-tutorial-software/
33
http://www.guitar-online.com/en/other-music-software/metronome-for-simple-compound-and-odd-time-meters/
26 http://www.guitar-online.com/en/contacts/
http://www.guitar-online.com/en/musical-instruments-online-store/samedaymusic-more-than-240000-items-in-stock/
19 http://www.guitar-online.com/en/other-music-software/
18 http://www.guitar-online.com/en/tag/note-detection/
16
http://www.guitar-online.com/en/guitar-tutorial-software/how-to-play-the-guitar-volume-1-for-absolute-beginners/
15
http://www.guitar-online.com/en/guitar-tutorial-software/classical-pieces-for-guitar-volume-1-for-advanced-level/
15 http://www.guitar-online.com/en/downloads/
12 http://www.guitar-online.com/lng/index.php
12
http://www.guitar-online.com/en/guitar-tutorial-software/how-to-play-the-guitar-volume-2-for-intermediate-level/
11 http://www.guitar-online.com/en/site-map/
11
http://www.guitar-online.com/en/other-music-software/ear-and-memory-training-for-absolute-pitch/
10 http://www.guitar-online.com/en/online-shop/
Similarly statcounter also generates reports for entry and exit pages. The first page accessed or visited by a user when they visit the website is called as the Entry Page. Exit page is last page where visitor leave the website. Table 4 shows the traffic sources of the website.It shows that out of total unique visits i.e 720 visits , visits of direct traffic to the website are 470 (i.e 65% traffic),visits from referring websites including social media sites are 163(23%) and visits form search engine referrals are 87 visits(12 %).With the information of traffic sources it can be easily inferred that the maximum %age is of the direct visitors
Table 4:Traffic Sources
1 Direct Traffic 65% 470 Visits
2 Referring Websites
(Including Social Media: 0.3%)
23% 163 Visits
3 Search Engine Referrals
12% 87 Visits
Table 5: Shows the traffic from Search Engines
Sr. No.
Search Engine
Percentage Hits
1 Google 51.8 44
2 Bing 20% 17
3 Yahoo 18.8% 16
4 DuckDuckGo 7.1% 6
5 Rhaekc 2.4% 2
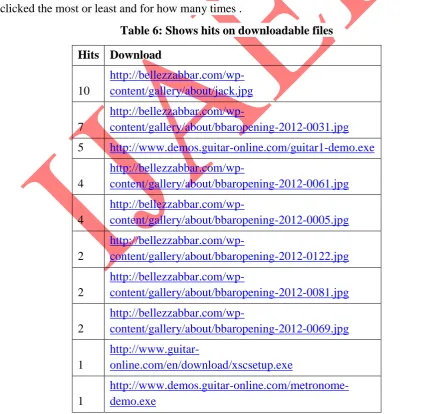
Mostly websites contain some material like txt, pdf, images, videos which visitor can download. Statcounter also provide this report shown in table 6 to check which are the files, images or videos are clicked the most or least and for how many times .
Table 6: Shows hits on downloadable files
Hits Download
10
http://bellezzabbar.com/wp-content/gallery/about/jack.jpg
7
http://bellezzabbar.com/wp-content/gallery/about/bbaropening-2012-0031.jpg
5 http://www.demos.guitar-online.com/guitar1-demo.exe
4
http://bellezzabbar.com/wp-content/gallery/about/bbaropening-2012-0061.jpg
4
http://bellezzabbar.com/wp-content/gallery/about/bbaropening-2012-0005.jpg
2
http://bellezzabbar.com/wp-content/gallery/about/bbaropening-2012-0122.jpg
2
http://bellezzabbar.com/wp-content/gallery/about/bbaropening-2012-0081.jpg
2
http://bellezzabbar.com/wp-content/gallery/about/bbaropening-2012-0069.jpg
1
http://www.guitar-online.com/en/download/xscsetup.exe
1
Statcounter also shows the navigation path the visitor took through to your site. Figure 3 shows the statcounter visitor path report .This report is not complete,we have just taken a snapshot of last day i.e 14 sep. This report is very helpful to identify common visitor behaviour.
Figure 3 Shows the visitor path
Figure 4 shows the visitor stay length on your website, out of which 445 visits are for less then 5 secs,42 visits are for 5 secs to 30 secs, 97 visits are for 30 secs to 5 mins, 7 visits for 5mins to 20 mins,3 visits for 20 mins to an hour and 26 visits longer then an hour. It is the time between a visitor started accessing the first page of website and the time he accessed the last page of website. With this report you can check how long visitors are spending on your website .You can also check the details of visitors who stayed for different period of time by just clicking on drill down button. This report helps you to know how much useful and interesting your website is and if stay length is very low you need to make changing in the design and structure of your website and add more useful data on it,So that it encourage your visitors to stay for longer time on website. For more accuracy of this report you need to install statcounter tracking code on all the pages of your website.
Figure 5 shows 587 visitors those who are first time visitors,17 visitors who have 1 to 5 times returning visits,only one visitor have 6 to 10 time returning visit and 3 visitors who have more then 10 times returning visits. This report of statcounter shows how often visitors return to the website. Such reports generated for a period of time ( weekly or fortnightly) may be a useful indicator of the increasing or decreasing trends in popularity of the website and loyalty of the visitors, which may be further helpful in taking decisions accordingly regarding the necessary changes to be made to manage and maintain the returning visits.
Figure 5 Shows the returning visits
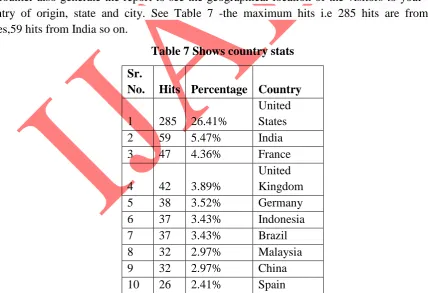
Statcounter also generate the report to see the geographical location of the visitors to your website- country of origin, state and city. See Table 7 -the maximum hits i.e 285 hits are from United States,59 hits from India so on.
Table 7 Shows country stats
Sr.
No. Hits Percentage Country
1 285 26.41%
United States 2 59 5.47% India 3 47 4.36% France
4 42 3.89%
United Kingdom 5 38 3.52% Germany 6 37 3.43% Indonesia 7 37 3.43% Brazil 8 32 2.97% Malaysia 9 32 2.97% China 10 26 2.41% Spain
shows the report of browsers used by your visitors,when they were accessing your website. We can see that maximum visitors i.e 291hits have used google chrome browser and 275 visitors used internet explorer so on.
Table 8 Shows the browser stats
Browser Percentage Hits
Chrome 27% 291 IE 25.5 275 Firefox 13.3 144 Mobile
Browser 12.7 137 Web
Crawlers 5.7 61 Tablets 3.6 39 Safari 2.6 28 Opera 2.5 27 Edge 2.1 23 Coc Coc 0.4 4 Chromium 0.3 3 Others 4.4 47
Browser statistics can help website testing by prioritizing the most popular browsers your visitors are using. Even your website can look great in one particular browser but may not work in the other.For enhancing the accessibility of the website it is better to design your website in way that on all browsers, for all screen resolutions and on all operating systems. But even then there is always that perfect browser, screen resolution and operating system where your website always accessed fast , works better and looks at its best and you could consider optimising it to suit the majority of your visitors. The browser , screen resolution and operating system statistics can help you with that decision.
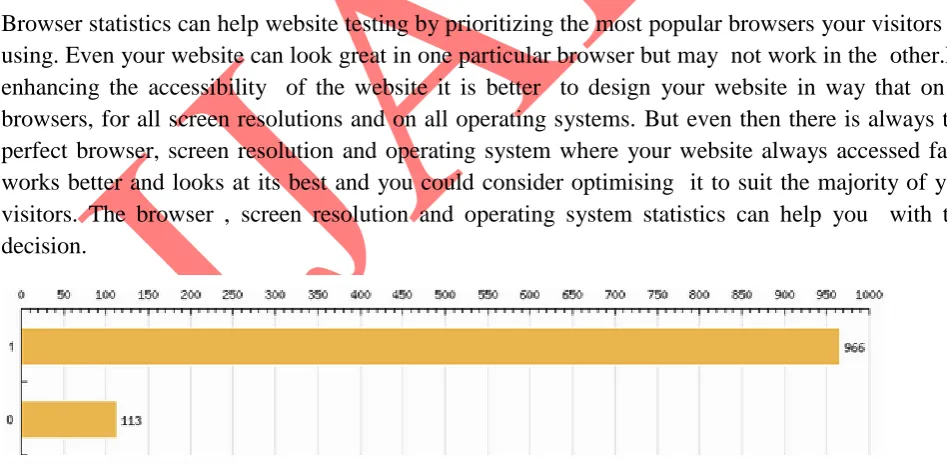
Figure 6: Shows javascript stats
Figure 7 shows the snapshot of stacounter lookup Ip address report page, which will show the details of particular IP address entered by the user.
Figure 7 Snaphot for Lookup IP address
Details of IP address “120.60.153.11” is shown in figure 8. It shows the location, length, browser, Operating system, Javascript enabled/disabled, ISP ,the referring URL etc. of that IP address.
Figure 8 Shows the details of IP address you entered
have used google search engine.People from United States have maximum hits i.e 285 hits. Maximum users have used google chrome or internet explorer browser to access the website.
5. CONCLUSIONS
Analysis of Log file helps in determining the navigational pattern of the user and his browsing behaviour.There are variety of tools online for this kind of analysis and generating the reports, some of which are freely available. A comparative study was done on two of the widely used analyzing tools- statcounter and deeplog analyzer. Both tools offer a variety of different features which are better than the other. But over all out of these two statcounter is more useful and powerful tool that helps in taking informed decisions to incorporate and improve the website as per user requirement. Using the reports and results generated by the tool of the visitors visiting a website ( stored in the logfile of the website) , we can get a fair and realistic idea about the behaviour of the visitors and their navigational patterns which help us in gauging the reach and popularity of the website. In this paper we have shown the results of statcounter by using their free demo service which contain live data from a real Website which sells guitars and musical instruments online. So we have analysed that the results of statcounter could better help you to change the website design, structure and material of your website time to time according to the interest of visitors. These results can also be used to pin point the area of the website and best time for posting advertisements and information to be conveyed to the visitors so that they can be easily “visible” and hence can be used for effective utilization of the website space and generate revenue.
6. REFRENCES
[1] V.Chitraa, Dr. Antony Selvdoss Davamani, A Survey on Preprocessing Methods for Web Usage Data, (IJCSIS) International Journal of Computer Science and Information Security,Vol. 7- No. 3, 2010
[2] Navjot Kaur,Himanshu Aggarwal,Web log Analysis for Identifying the number of visitors and their Behavior to Enhance the Accessibility and Usability of Website, International Journal of Computer Applications (0975 – 8887) Volume 110 – No. 4, January 2015.
[3] Neha Goel, C.K. Jha, “Analyzing User Behavior from Web Access Logs using Automated Log Analyzer Tool”International Journal of Computer Applications(0975-8887),Volume 62-No.2, January 2013.
[4] [Online] http://statcounter.com/ [Accessed on 15/09/2015]
[5] Priyanka Patil,Ujwala Patil,Preprocessing of web server log file for web mining, World Journal of Science and Technology (2231 – 258),Vol 2-No.3 ,page14-18,2012.
[6] [Online] www.deep-software.com [Accessed on 15/09/2015]
[7] Ashwin G. Raiyani, Prof. Sheetal S. Pandya , Discovering User Identification Mining Technique for Preprocessed Web Log Data, Journal of Information, Knowledge and Research in Computer Engineering (0975 – 6760), Vol– 02- No. 2, Page 477 -482, Nov 2012 to Oct 2013 .
[9] AWStats log file analyzer 7.1 Documentation , Log AnalyzerComparison: http://awstats.sourceforge.net/docs/awstats_compare.html