I.
Introduction
T
he appearance of modern devices that offer quite natural and easy-to-learn interactions, as for example smart phones or tablets, have taken the general expectation of users concerning user experience of user interfaces to a new level. Today’s users simply expect a high level of satisfaction during their interaction with a user interface, even if it is a complex business application or a programming environment.In order to be successful in a highly competitive market environment, it is thus no longer sufficient to offer products of new and powerful functionality. Users also expect that they can learn how to use the application without much effort, solve their tasks fast and efficiently, and are able to control the interaction at each point. In addition to these goal-oriented interaction qualities, it is also important that the product catches the user’s attention and interest and that using the product is interesting and stimulating. Consequently, hedonic, not directly goal-oriented interaction qualities have to be considered as well in order to be successful [1].
For example, in a study concerning business software [2] it was shown that pragmatic quality aspects and hedonic quality aspects equally influence the attractiveness and preference for a product. Thus, user experience with all its facets is an important aspect that must be considered during product design and as a part of quality control.
This raises the question of how to measure user experience. All aspects of user experience are highly subjective evaluations. A product that is seen as easy to learn and understand by one person can be judged as quite complicated and difficult to learn by another person. This can, for example, be due to different levels of expertise or knowledge. Another reason can be a different level of expertise with similar products.
The same is true for the perceived performance of a product. A product that a user perceives as slow and annoying can be seen as performing adequately by another user. In this respect, users vary widely in their expectations and personal preferences. Thus, any measurement of user experience must consider the feedback of a representative and large enough group of users.
Therefore, questionnaires are a simple method to collect such user feedback [3]. They can be distributed rather efficiently to larger groups of users, especially if they are designed as online questionnaires. In addition, analyzing the numerical data from such questionnaires is highly standardized and thus efficient as well.
In this paper we describe the design and evaluation of a short version of the User Experience Questionnaire, which is a widely used tool to measure user experience.
II.
The User Experience Questionnaire (UEQ)
The objective of the UEQ is to allow a quick assessment done by end users covering a preferably comprehensive impression of user experience. It should allow the users to express feelings, impressions, and attitudes that arise when experiencing the product under investigation in a very simple and immediate way.
The UEQ can be used as a paper-pencil version, but is also short enough to be used as an online questionnaire. It consists of 26 items (Fig. 1) that are grouped into 6 scales.
Each item of the UEQ consists of a pair of terms with opposite meanings, for example:
Not understandable o o o o o o o Understandable Efficient o o o o o o o Inefficient
Participants rate each item on a 7-point Likert scale. The answers are scaled from -3 (fully agree with negative term) to +3 (fully agree with positive term). Half of the items start with the positive term, the others with the negative term (in randomized order).
Design and Evaluation of a Short Version of the User
Experience Questionnaire (UEQ-S)
Martin Schrepp
1, Andreas Hinderks
2, Jörg Thomaschewski
3*
1
SAP AG (Germany)
2
University of Seville (Spain)
3
University of Applied Sciences Emden/Leer (Germany)
Received 19 June 2017 | Accepted 12 July 2017 | Published 11 September 2017
Keywords
User Experience, UEQ, Questionnaire, Short Version.
Abstract
The user experience questionnaire (UEQ) is a widely used questionnaire to measure the subjective impression of users towards the user experience of products. The UEQ is a semantic differential with 26 items. Filling out the UEQ takes approximately 3-5 minutes, i.e. the UEQ is already reasonably efficient concerning the time required to answer all items. However, there exist several valid application scenarios, where filling out the entire UEQ appears impractical. This paper deals with the creation of an 8 item short version of the UEQ, which
is optimized for these specific application scenarios. First validations of this short version are also described. DOI: 10.9781/ijimai.2017.09.001
* Corresponding author.
The original version of the UEQ was designed in German [4], [5], but has so far been translated to several languages like Spanish [7] and Portuguese [11]. The English version of the UEQ is shown in Fig. 1.
annoying o o o o o o o enjoyable 1
not understandable o o o o o o o understandable 2
creative o o o o o o o dull 3
easy to learn o o o o o o o difficult to learn 4
valuable o o o o o o o inferior 5
boring o o o o o o o exciting 6
not interesting o o o o o o o interesting 7
unpredictable o o o o o o o predictable 8
fast o o o o o o o slow 9
inventive o o o o o o o conventional 10
obstructive o o o o o o o supportive 11
good o o o o o o o bad 12
complicated o o o o o o o easy 13
unlikable o o o o o o o pleasing 14
usual o o o o o o o leading edge 15
unpleasant o o o o o o o pleasant 16
secure o o o o o o o not secure 17
motivating o o o o o o o demotivating 18
meets expectations o o o o o o o does not meet expectations 19
inefficient o o o o o o o efficient 20
clear o o o o o o o confusing 21
impractical o o o o o o o practical 22
organized o o o o o o o cluttered 23
attractive o o o o o o o unattractive 24
friendly o o o o o o o unfriendly 25
conservative o o o o o o o innovative 26
Fig. 1. English version of the UEQ.
The original German version of the UEQ was designed using a data analytics approach to ensure the practical relevance of the constructed scales. Each scale represents a distinct UX quality aspect.
An initial set of more than 200 potential items related to UX was created with usability experts in two brainstorming sessions. A number of these experts then reduced the selection to a raw version of 80 items. The raw version was used in several studies (with a total of 153 participants) on the quality of interactive products, including a statistics software package, cell phone address books, online collaboration software, or business software. Finally, the scales and the items representing each scale were extracted from this data set by principal component analysis [4], [5].
This analysis yielded the final questionnaire with 26 items arranged into six scales:
• Attractiveness: Overall impression of the product. Do users like or dislike it? Is it attractive, enjoyable or pleasing?
• Perspicuity: Is it easy to get familiar with the product? Is it easy to learn? Is the product easy to understand and unambiguous? • Efficiency: Can users solve their tasks without unnecessary effort?
Is the interaction efficient and fast? Does the product react to user input quickly?
• Dependability: Does the user feel in control of the interaction? Can he or she predict the system’s behavior? Does the user feel confident when working with the product?
• Stimulation: Is it exciting and motivating to use the product? Is it enjoyable to use?
• Novelty: Is the product innovative and creative? Does it capture the user’s attention?
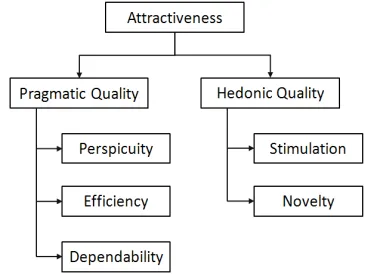
Scales are not assumed to be independent. In fact, a user’s general impression is recorded by the Attractiveness scale, which should be influenced by the values on the other 5 scales (see Fig. 2).
Fig. 2. Assumed scale structure of the User Experience Questionnaire (UEQ).
Attractiveness is a pure valence dimension (emotional reaction on a pure acceptance/rejection dimension). Perspicuity, Efficiency, and Dependability are pragmatic quality aspects, i.e. they describe interaction qualities that relate to the tasks or goals the user aims to reach when using the product. Stimulation and Novelty are hedonic quality aspects, i.e. they do not relate to tasks and goals, but describe aspects related to pleasure or fun while using the product [2], [6].
For details concerning the design and validation of the UEQ see [4], [5]. Helpful hints on using the UEQ are also available in [7], [8]. There is a benchmark available as well, which is described in [12].
For a semantic differential like the UEQ, it is very important that participants can fill it out in their native language. Thus, several contributors created a number of translations.
The UEQ is currently available in 19 languages (German, English, French, Italian, Russian, Spanish [7], Portuguese [11], Turkish, Chinese, Japanese, Indonesian [10], Dutch, Estonian, Slovene, Swedish, Greek, Polish, Hindi, and Bulgarian).
The UEQ in all available languages, an Excel sheet for data analysis, and the UEQ Handbook are available free of charge at www.ueq-online.org.
III.
Scenarios Requiring a Short Version?
Usually, 3-5 minutes are sufficient to fill out the UEQ including some demographic data [3]. Thus, the UEQ is already a quite efficient method to capture the opinion of a user towards the user experience of a product, leading to the obvious question why a shorter version is needed at all?
In the last couple of years we received a number of requests for a shorter version, and some users even created their own short version by removing a few items (which is not a recommended practice for a standardized questionnaire like the UEQ [9]). Accordingly, there seem to be some cases in which a full UEQ is considered to be too time consuming.
All these requests came from three different generic application scenarios in which only a very small number of items could be used to measure user experience.
done extremely fast. Otherwise, users will refuse to give feedback (they are finished with their initial task and are in the process of leaving the shop, so motivating them to spend some more time on feedback is difficult). Presenting an entire UEQ with all 26 questions in such a scenario will severely reduce the number of users willing to give feedback.
2. In the second and quite frequent scenario, a questionnaire concerning user experience should be included in an already existing product experience questionnaire. Typically, such a questionnaire is sent out after a customer has purchased a product and has already used it for some time.
Such questionnaires try to collect data about the entire product experience, asking, for example, why the customer chose the product, if the functionality of the product fulfills the expectations, if the purchasing process was pleasant, if the customer wants to be informed about similar or other products of the company in the future, etc. As a result, such questionnaires tend to be quite lengthy. Thus, it is difficult to add a full 26 item user experience questionnaire in such cases.
On the other hand, it is often not possible to collect data concerning user experience in a separate questionnaire, since the number of customer interactions cannot exceed a certain limit (customers can get easily annoyed if they receive such marketing e-mails too often).
Thus, including a very short user experience section in such a customer experience questionnaire is often the only way for UX practitioners to collect feedback on their customers’ user experience.
3. A third scenario mentioned sometimes are experimental settings where a participant is asked to judge the user experience of several products or variants of a product in one session. In such scenarios the products or product variants are presented to the participant in a random order one after the other, and they have to fill out a questionnaire concerning user experience for each of them. In such a setting, the number of items must be kept to a minimum. Otherwise the participant will be stressed and the quality of answers will decrease quickly.
All of these scenarios share the requirement that the number of items must be small. In addition, any instruction must be simple and quick to read.
IV.
Construction of the Short Version
The short version should contain only a limited number of items, but it should still cover the spectrum of product qualities measured by the UEQ.
To shorten the UEQ it was decided to skip the measurement of the single dimensions and to concentrate on the measurement of the two meta-dimensions pragmatic and hedonic quality. For each of these dimensions four items are chosen. Thus, the short version of the UEQ (henceforth: UEQ-S) will only contain eight items, grouped into two scales. In addition, the mean value of the eight items will be given as an overall UX value.
A data set with 1867 data records was collected by the German UEQ in previous studies. Each data record reflects the evaluation of a product by a participant. In total, 21different products were assessed (business software, web shops, household appliances, etc.).
A main component analysis was performed on all twelve UEQ items from the Efficiency, Perspicuity and Dependability scales. For the analysis the number of factors was set to 1, and the four items that showed the highest loading on this factor were chosen. These were
the items 11, 13, 20, and 21 (see Fig. 1) of the UEQ. They therefore represent the Pragmatic Quality scale of the short version UEQ-S.
The same procedure was repeated for the eight UEQ items from the Stimulation and Originality scales. The items 6, 7, 10, and 15 (see Fig. 1) showed the highest loadings and thus represent the Hedonic Quality scale of the UEQ-S.
The UEQ-S thus consists of items shown in Fig. 3:
obstructive o o o o o o o supportive 1
complicated o o o o o o o easy 2
inefficient o o o o o o o efficient 3
clear o o o o o o o confusing 4
boring o o o o o o o exiting 5
not interesting o o o o o o o interesting 6
conventional o o o o o o o inventive 7
usual o o o o o o o leading edge 8
Fig. 3. The short version UEQ-S.
The first four items represent the pragmatic quality scale and the last four items the hedonic quality scale.
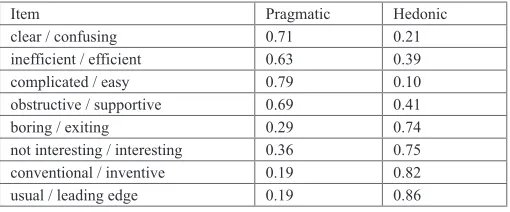
To check the cross-loadings the data set was reduced to these eight items and a main component analysis (varimax rotation) was performed with two factors. Table 1 shows the items’ loadings on these factors.
TABLE I. Loadings of the Items of the Short Version UEQ-S on the Factors Pragmatic and Hedonic Quality
Item Pragmatic Hedonic
clear / confusing 0.71 0.21
inefficient / efficient 0.63 0.39
complicated / easy 0.79 0.10
obstructive / supportive 0.69 0.41
boring / exiting 0.29 0.74
not interesting / interesting 0.36 0.75
conventional / inventive 0.19 0.82
usual / leading edge 0.19 0.86
Thus, the items show the intended scale structure. Only the item obstructive/supportive yields a relevant, but still relatively small cross-loading to the other factor. The other items load strongly on the factor they belong to and only weakly to the other factor.
In the original UEQ half of the items start with the positive term and the other half of items start with the negative term. In addition, the order of the items is randomized in the questionnaire. This was done to be able to detect participants that do not answer seriously [9] and to force users to carefully read the alternatives. However, this also has some disadvantages. The change of polarity must be explained in the instruction and in addition, it is cognitively more demanding for the participants.
In order to simplify the instruction and make it easier to fill in the questionnaire, it was decided that all items have the same polarity. The left side reflects the negative term and the right side the positive term (see Fig. 3). In addition, the order is not randomized: the first 4 items reflect the pragmatic quality and the items 5 to 8 the hedonic quality.
V.
Prediction Quality
6 belong to the scale Attractiveness, which is neither pragmatic nor hedonic) in the full UEQ for each participant. The same was done for the scales pragmatic and hedonic quality of the short version.
Regarding the pragmatic quality we calculated the difference between the mean of the four items of the pragmatic quality scale of the UEQ-S and all twelve items of the Efficiency, Perspicuity and Dependability scales in the full UEQ for each participant.
Following that pattern, we compared the difference between the four items of the hedonic quality scale of the UEQ-S with the mean of the eight items of the Stimulation and Originality scales in the full UEQ.
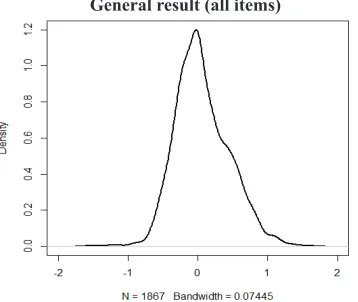
The distribution of these differences (kernel density plots) is shown in Fig. 4, Fig. 5 and Fig. 6.
General result (all items)
Fig. 4. Distribution of the difference per participant between the full UEQ and the short version UEQ-S for the overall value.
Pragmatic Quality
Fig. 5. Distribution of the difference per participant between the full UEQ and the short version UEQ-S for pragmatic quality.
Hedonic Quality
Fig. 6. Distribution of the difference per participant between the full UEQ and the short version UEQ-S for hedonic quality.
The mean and standard deviation of the observed differences are 0.06 (0.39) for all items (Fig. 4), -0.09 (0.46) (Fig. 5) for the items concerning pragmatic quality and -0.03 (0.45) (Fig. 6) for the items concerning hedonic quality. Please note that the UEQ scale ranges from -3 to +3, so these differences concerning the scale means are quite small.
In all three cases the distribution of the observed differences is nearly symmetrical around zero, thus there is no systematic over- or underestimation based on the reduced number of items in the short version UEQ-S. It is evident that the short version is able to predict the values of the full version quite accurately.
VI.
An Evaluation Study
In a first study with the short version 47 students judged the user experience of different well-known products. Each student could choose to judge either Amazon, Skype or Wikipedia with an online version of the UEQ-S. We only report results for Amazon, since for the other two products there were simply not enough data to draw meaningful conclusions.
The consistency of the pragmatic quality and hedonic quality scales was reasonably high. The corresponding Cronbach Alpha values were 0.85 (pragmatic quality) and 0.81 (hedonic quality).
The scale means for Amazon (N=31 students decided to judge Amazon) were 1.09 for pragmatic and 0.51 for hedonic quality. These values are quite similar to the values obtained in an older study with a similar target group (German students) and the full UEQ. In this study the mean value for the Efficiency, Perspicuity and Dependability UEQ scales was 1.17 and the mean value for Stimulation and Originality was 0.66. Thus, the short version UEQ-S seems to approximate the long version expectedly well.
A main component analysis of this data set shows the expected factor structure once more. The loading of the items of the two extracted factors (factors were extracted according to the Kaiser-Guttman criterium, loadings after varimax rotation) are shown in Table 2.
TABLE II. Factor Loadings on the Two Extracted Factors of the Short Version UEQ-S for the Full Data Set of the Study (47 Participants)
Item pragmatic qualityFactor 1 hedonic qualityFactor 2
clear / confusing 0.825 -0.209
inefficient / efficient 0.833 0.255
complicated / easy 0.849 -0.033
obstructive / supportive 0.789 0.215
boring / exiting 0.274 0.701
not interesting / interesting 0.220 0.806
conventional / inventive -0.047 0.841
usual / leading edge -0.221 0.809
VII. Language Versions
The items of the UEQ-S are a subset of the UEQ items. Accordingly, all the available translations of the UEQ can be used, i.e. the UEQ-S is directly available in all languages for which a full version exists (German, English, French, Italian, Russian, Spanish, Portuguese, Turkish, Chinese, Japanese, Indonesian, Dutch, Estonian, Slovene, Swedish, Greek, Polish, Hindi, and Bulgarian).
The translated version of the UEQ-S can simply be created by choosing the corresponding items from the full UEQ of the desired language.
behavior of the full UEQ as well as the German version. We cannot verify this for all translations yet, since we do not have access to sufficiently large data sets for all of them. So far, this is only possible for some languages.
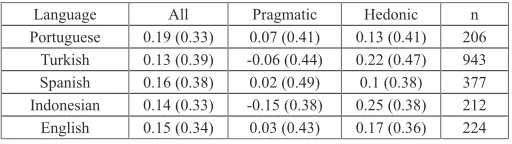
Table 3 shows the measured deviation per participant between the short version and the corresponding values for the long version for five languages (same computation method as described in the validation of the German short version above).
TABLE III. Deviations between Short Version UEQ-S and Full Version
Language All Pragmatic Hedonic n
Portuguese 0.19 (0.33) 0.07 (0.41) 0.13 (0.41) 206
Turkish 0.13 (0.39) -0.06 (0.44) 0.22 (0.47) 943
Spanish 0.16 (0.38) 0.02 (0.49) 0.1 (0.38) 377
Indonesian 0.14 (0.33) -0.15 (0.38) 0.25 (0.38) 212
English 0.15 (0.34) 0.03 (0.43) 0.17 (0.36) 224
The data shows that for these languages the fit between the short version and the full version of the UEQ is good enough to allow a practical application of the UEQ-S. For example, for the English version we can expect that the mean of the eight items of the UEQ-S deviates 0.15 (on average) from the mean of all 26 UEQ items. For the four UEQ-S items of the pragmatic quality scale the deviation from the mean of all twelve UEQ items of the Efficiency, Dependability and Perspicuity scales is 0.03 on average. For the four UEQ-S items of the hedonic scale the deviation from the mean of all eight UEQ items of the scales Stimulation and Originality averages at 0.17. Thus, as in the case of the German version, the approximation is quite good.
VIII. Limitations of the Short Version UEQ-S
We described the design of the UEQ’s short version UEQ-S. For a UX professional who wants to plan an evaluation the question arises which of the two versions should be used. Obviously, the short version has some advantages concerning the number of questions and accordingly the time the participants need to fill out the questionnaire.
However, this comes at a price. The full UEQ gives a detailed feedback concerning 6 different aspects of UX, i.e. measures on the Attractiveness, Efficiency, Perspicuity, Dependability, Stimulation and Originality scales. This is lost in the short version that only distinguishes between pragmatic and hedonic quality.
Given the fact that even a full UEQ requires only 3-5 minutes, the usage of the UEQ-S should be limited to the scenarios described in the beginning of this paper. The short version should only be used in situations where a full UEQ can not be applied at all. Otherwise, the loss of detailed information is not compensated by saving time in filling out the questionnaire.
IX. Conclusion
We described the design and validation of a short version of the UEQ. It consists of only eight of the 26 items of the UEQ. The short version, which is named UEQ-S, contains two subscales (pragmatic and hedonic quality; 4 items each) and a total value reflecting the overall user experience.
It was shown that the short version is able to predict the behavior of the full version concerning pragmatic and hedonic quality. The mean value obtained by the four items of the short version approximates the values obtained by averaging all 12 pragmatic items (from the Efficiency, Perspicuity and Dependability scales) and all 8 hedonic items (from the Stimulation and Originality scales) of the full version.
In a first application study concerning Amazon done with German
students, the scales showed a high level of consistency. In addition, the measured mean for the pragmatic and hedonic quality approximates the values obtained by the full UEQ collected in a previous study.
The short version UEQ-S is only intended for specific scenarios which do not allow employing a full UEQ. The UEQ-S does not allow measuring the detailed UX qualities Attractiveness, Efficiency, Perspicuity, Dependability, Stimulation and Novelty, which are part of the UEQ report. It is, in general, quite useful to gather these detailed values when it comes to interpreting the results and define areas of improvement [3].
Thus, the short version UEQ-S only allows a rough measurement on higher level meta-dimensions. Our recommendation therefore is to only use the short version UEQ-S in the scenarios described in this paper. The short version should not replace the usage of the full version in standard scenarios, for example after usability tests. In such scenarios, the small gain in efficiency does not compensate for the loss of detailed information on the single scales and therefore more detailed quality aspects.
References
[1] Preece, J.; Rogers, Y. & Sharpe, H. (2002): Interaction design: Beyond human-computer interaction. New York: Wiley.
[2] Schrepp, M.; Held, T. & Laugwitz, B.: The influence of hedonic quality on the attractiveness of user interfaces of business management software. Interacting with Computers 18, pp. 1055-1069 (2006).
[3] Schrepp, M.; Hinderks, A. & Thomaschewski, J. (2014). Applying the User Experience Questionnaire (UEQ) in Different Evaluation Scenarios. In: Marcus, A. (Ed.): Design, User Experience, and Usability. Theories, Methods, and Tools for Designing the User Experience. Lecture Notes in Computer Science, Volume 8517, pp. 383-392, Springer International Publishing.
[4] Laugwitz, B.; Schrepp, M. & Held, T. (2006). Konstruktion eines Fragebogens zur Messung der User Experience von Softwareprodukten. [Construction of a questionnaire for the measurement of user experience of software products] In: A.M. Heinecke & H. Paul (Eds.): Mensch & Computer 2006 – Mensch und Computer im Strukturwandel. Oldenbourg Verlag, pp. 125-134.
[5] Laugwitz, B.; Schrepp; M. & Held, T. (2008). Construction and evaluation of a user experience questionnaire. In: Holzinger, A. (Ed.): USAB 2008, LNCS 5298, pp. 63-76.
[6] Hassenzahl, M. (2001). The effect of perceived hedonic quality on product appealingness. International Journal of Human-Computer Interaction, 13(4), pp. 481-499.
[7] Rauschenberger, M.; Schrepp, M.; Perez-Cota, M.; Olschner, S. & Thomaschewski, J. (2013): Efficient Measurement of the User Experience of Interactive Products. How to use the User Experience Questionnaire (UEQ). Example: Spanish Language Version. In: International Journal of Interactive Multimedia and Artificial Intelligence, 2(1), pp. 39-45.
[8] Schrepp, M. (2015). User Experience Questionnaire Handbook. DOI: 10.13140/RG.2.1.2815.0245. Available under: https://www.researchgate. net/publication/281973617_User_Experience_Questionnaire_Handbook.
[9] Schrepp, M.; Hinderks, A. & Thomaschewski, J. (2016). User Experience mit Fragebögen evaluieren - Tipps und Tricks für Datenerhebung, Auswertung und Präsentation der Ergebnisse. S. Hess & H. Fischer (Hrsg.): Mensch und Computer 2016 – Usability Professionals. http:// dx.doi.org/10.18420/muc2016-up-0016.
[10] Santoso, H.B.; Schrepp, M.; Isal, R.Y.K.; Utomo, A.Y. & Priyogi, B. (2016). User Experience Questionnaire: Development of an Indonesian Version and Its Usage for Product Evaluation. The Journal of Educators Online-JEO January 2016 ISSN 1547-500X Vol 13 Number 1, pp. 58-79.
[11] Pérez Cota, M.; Thomaschewski, J.; Schrepp, M. & Goncalves, R. (2014). Efficient Measurement of the User Experience. A Portuguese Version. Procedia Computer Science. 5th International Conference on Software Development and Technologies for Enhancing (27), pp. 491-498. DOI: 10.1016/j.procs.2014.02.053
Journal of Interactive Multimedia and Artificial Intelligence, 4(4), pp. 40-44. DOI: 10.9781/ijimai.2017.445
Martin Schrepp
Martin Schrepp has been working as a user interface designer for SAP AG since 1994. He finished his diploma in mathematics in 1990 at the University of Heidelberg (Germany). In 1993 he received a PhD in Psychology (also from the University of Heidelberg). His research interests are the application of psychological theories to improve the design of software interfaces, the application of Design for All principles to increase accessibility of business software, measurement of usability and user experience, and the development of general data analysis methods. He has published several papers concerning these research fields.
Andreas Hinderks
Andreas Hinderks graduated with a diploma in Computer Science and is Master of Science in Media Informatics by the University of Applied Science Emden/Leer. He has worked as a business analyst and a programmer from 2001 to 2016. Back then, he focused on developing user-friendly business software. Currently, he is a freelancing business analyst and senior UX architect. Furthermore he is a Ph.D. student at the University of Seville, Spain. He is involved in research activities dealing with UX questionnaires, process optimization, information architecture, and user experience since 2011.
Jörg Thomaschewski