NITROGEN FERTILIZATION AND OVER/RRIGATION OF SPRING AND WINTER WhEAT 1 J. h. Smith, C. L. Douglas, and M. J. LeBaron 2
When fall or spring wheat is irrigated early in the spring before the available soil moisture is depleted, the yellowing that frequently results is
a symptom of reduced crop vigor. Robins and Domingo (1) observed no benefit from irrigating spring wheat before the boot stage unless severe moisture stress developed. They also found that reductions in early vegetative growth and
plant height that resulted from drought greatly reduced susceptibility to lodging during and following later irrigations. Although irrigation may be necessary for emergence under extreme drought conditions, Salter and Goode (2) found that water applied before emergence reduced grain yield. They concluded that water stress during the shooting and earing stages of growth, when
development of the reproductive organs is taking place, would cause the great-est yield loss.
The experiments reported here show the influence of excessive irri-gation and nitrogen fertilization on grain and straw yield, and on protein content of spring- and fall-seeded wheat.
MATERIALS AND METHODS
Nugaines wheat was seeded with a grain drill in rows spaced 6 inches apart in plots 112 by 32 feet on Portneuf silt loam soil October 7, 1966, on the University of Idaho, Twin Falls Branch Agricultural Experiment Station at Kimberly. The treatments were replicated four times and arranged in a split-plot design. The split-plots were irrigated 1 week after planting. Lemhi wheat was seeded March 28, 1967 in alternate 11- and 13-inch spaced rows with individual planters mounted on a tool bar and the plots were corrugated for irrigation in the wide-spaced rows. Both wheat varieties were fertilized with ammonium ni-trate using a calibrated 8-foot spreader on March 27 and 28, 1967. Nitrogen rates were 0, 80, and 160 lbs per acre on the Nugaines and 0, 50, and 100 lbs per acre on the Lemhi wheat.
Three moisture levels were maintained by irrigating when tensiometers placed at 18 inches read 0.65 bars (II); when tensiometers placed at 18 inches read 0.45 bars (I 2); and when tensiometers placed at 12 inches read 0.45 bars
(1 3) (Table 1). This corresponded to 20, 23, and 25% moisture by weight, and represents use of approximately 50, 30, and 20% of the available water. Irri-gation periods were approximately 12 hours each. Water was applied in corru-gates 24 inches apart.
The wheat was harvested with a 6-foot self-propelled combine. Grain yields were measured, and straw yields were determined by cutting 30 square feet of each plot with a small sickle-bar mower, weighing, threshing, and sub-tracting the weight of grain. Protein content of the grain was determined by dye absorption, by Mr. Martin Wise at the University of Idaho Grain Laboratory at Aberdeen, Idaho.
'
Proceedings Twenty-first Annual Fertilizer Conference of the Pacific Northwest, Salt Lake City, Utah, July 14-16, 1970.
2
a multi-step process which first converts the potassium values to a double salt and isolates it prior to conversion to potassium sulfate. The process is carried out under carefully controlled conditions of temperature and brine composition.
Annual capacity of the potassium sulfate plant will be 240,000 tons (125,000 tons K20). GSL's product prepared in this manner shows remarkably purity - 52% K20 equivalent (or higher) with less than 0.1% chloride. Three grades of varying screen sizes will be available: standard, fine and (by mid 1971) granular.
All products are dust free and free flowing. Typical specifications are given in the following table.
POTASSIUM SULFATE
TYPICAL PRODUCT SPECIFICATIONS
Chemical Specifications Granular Standard Fine
K
20 52.5 53.0 52.5
Cl 0.1 0.1 0.1
H 2 O 0.1 0.1 0.1
Physical Specifications
(Tyler Standard Sieve Sizes) + 6 Mesh
+ 8 Mesh + 14 Mesh
2% 21-25%
95%
+ 20 Mesh 2-16%
+ 28 Mesh 22-47%
+ 35 Mesh 62-73%
+ 48 Mesh 90% 7%
+ 65 Mesh 95% 27-29%
+100 Mesh 47-98%
+150 Mesh 100%
Bulk Density lbs/cft.
Loose 76 87 84
Tapped 82 97 97
Table
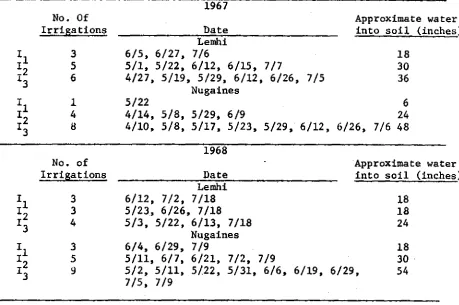
1.
Irrigation schedule. z l _2 J 3 No. Of Irrigations 1967Date Approximate waterinto soil (inches) 3 5 6 6/5, 5/1, 4/27, 6/27, 5/22, 5/19, Lemhi 7/6 6/12,
5/29,6/15, 7/76/12, 6/26, 7/5
18 30 36 Nugaines
1 5/22 6
I
2 4 4/14, 5/8, 5/29, 6/9 24
1
3 8 4/10, 5/8, 5/17, 5/23, 5/29, 6/12, 6/26, 7/6 48 1968
No. of
Irrigations Date Approximate waterinto soil (inches) Lemhi 1 i 2 1 3 3 3 4 6/12, 5/23, 5/3, 7/2, 6/26, 5/22, 7/18 7/18 6/13, 7/18 1
8
18 24 Nugaines3 6/4, 6/29, 7/9 18
132' 5 5/11, 6/7, 6/21, 7/2, 7/9 30
13 9 5/2, 5/11, 5/22, 5/31, 6/6, 6/19, 6/29, 54 7/5, 7/9
Treatments for 1968 were the
same as
1967 except all the plots wereplanted with spaced-row planters similar to the Lemhi wheat in 1967. Nugaines was planted November 1, 1967 and Lemhi wheat on March 22, 1968 for harvest in August 1968. Nitrogen
was
applied March 22, 1968 at 0, 110, and 220 for Nugaines and at 0, 57, and 114 lbs per acre on Lemhi wheat. Temperature and rainfall data for the two growing seasons are given in Table 2. Soil samples were taken periodically during the growing seasons and analyzed for nitrate.RESULTS AND DISCUSSION
Only the first increment of nitrogen fertilizer significantly increased the grain yields of Lemhi and Nugaines wheat in 1967 (Table 3). The greatest mean grain yields with both the Nugaines and Lemhi wheat varieties were ob-tained with the least amount of water. In both cases interactions between nitrogen fertilization and irrigation were significant. The 12 and 13 treat-ments decreased yields below the Il treatment without added nitrogen and smaller decreases or slight increases in yield resulted for the wetter treat-ments when nitrogen was'added.
Table 2. Air temperatures and precipitation during the 1967 and 1968 growing seasons at Kimberly, Idaho. (From ESSA Records).
1967 Precipitation
Inches Largest Single stormInches Date Max. Air Temperature, F.Min. Mean
March 1.20 0.39 29 51.5 28.1 39.8
April 1.90 .81 28 51.8 30.7 41.3
May .58 .31 10 67.1 41.0 54.1
June 2.38 .48 14 72.2 48.2 60.2
July .2% .16 17 88.8 55.8 72.3
August .01' .01 27 89.5 54.2 71.8
September .28 .14 28 79.6 47.2 63.4
October .94 .48 28 62.6 32.4 47.5
1968
March 1.00 0.37 17 54.4 29.5 42.0
April .44 .32 5 55.8 30.7 43.3
May .93 .31 14 67.4 40.8 54.1
June .93 .48 9 76.1 49.4 62.8
July trace 87.9 53.3 70.7
August 3.23 1.27 21 75.8 49.3 62.2
Table 3. 1967 Lemhi and Nugaines grain yields. Treatment
Grain Yield Irrigationa l
Mean
zi 1 3
lbs/acre bu/acre
Lemhi
0 66.0 44.9 49.6 53.5 a2
50 64.2 54.8 58.5 59.2 b
100 62.0 60.4 64.3 62.2 b
Mean 64.1 b 53.4 a 57.5 a
Nugaines
0 99.1 83.2 82.2 88.2 a
80 100.4 95.3 95.8 97.2 b
160 94.0 101.1 94.2 96.5 b
Mean 97.8 b 93.2 ab 90.7 a
1 Irrigations see Table 1.
2Duncan multiple range comparisons were applied at
the 0.05 significance level.
The highest nitrogen application increased grain protein content in both wheat varieties (Table 5). The two wetter treatments decreased protein content below that found with the 11 irrigation treatment. No significant interactions were observed between nitrogen and irrigation.
Table 4. 1967 Lemhi and Nugaines straw yields. N
Treatment
Straw Yields Irrigations 1
Mean 1
2
lbs/acre lbs/acre
Lemhi
0 9,100 3,700 5,600 6,100 a2
50 9,600 5,900 6,200 7,200 b
100 8,000 6,400 7,600 7,300 b
Mean 8,900 b 5,300 a 6,500 a
Nugaines
0 11,300 11,400 12,000 11,600 a
80 12,300 11,500 11,600 11,800 a
160 13,000 15,100 12,100 13,400 a
Mean 12,200 a 12,700 a 11,900 a
Table 5. Protein content of Nugaines and Lemhi wheat in 1967.
N Wheat Protein
Irrigations'
Treatment 1
1 12 13 Mean
lbs/acre percent
Lemhi
0 12.7 9.9 10.8 10.8 a2
50 13.1 9.6 9.4 10.7 a
100 13.5 10.9 11.1 11.8 b
Mean 13.1 b 10.1 a 10.0 a
Nugaines
0 9.8 8.8 8.6 9.1 a
80 10.2 9.3 10.3 10.0 a
160 12.6 10.4 10.6 11.2 b
Mean 10.9 b 9.5 a 9.8 a
1 Irrigations as shown in Table 1.
2Duncan multiple range comparisons were applied at the 0.05 significance level.
abrupt temperature change from daily maxima in the low 70's to average daily maxima near 90 F for the third and fourth weeks of June and the month of July may have produced atmospheric drought that reduced the wheat yield (2). The 1967 wheat yields in the area were generally below normal, presumably because of adverse climatic developments.
that the yellowing is associated with nitrogen deficiency resulting from leaching nitrate from the immediate root zone of the young Lemhi wheat plants. Nitrification may also have been slowed by lower soil temperatures that re-sulted from irrigation. Maximum soil temperatures were decreased 4 to 10 degrees and minimum soil temperatures were decreased 2 to 4 degrees F for 7 days following irrigation on May 3, 1968.
Soft white wheat that is used for milling pastry flour should have a protein content below about 9.5 to 10.0% for best baking characteristics. Soil fertility on the Lemhi wheat plots was high enough to produce wheat with higher than optimum protein content. Excessive irrigation decreased the pro-tein content in all the 12 and 13 treatments but some of them remained higher than optimum. Nugaines wheat also had protein higher than optimum in some treatments. Although excessive irrigation decreased the protein content, a more efficient and
desirable
method of obtaining lower protein would ,be to use less nitrogen.The response to nitrogen in 1968 was good; each increment of nitrogen increased yields of Lemhi wheat, and the first increment increased Nugaines wheat yields (Table 6). Excessive irrigation decreased wheat yields of both varieties. The first irrigation (May 3) of Lemhi wheat caused yellowing and stunting from which the wheat never recovered. When no nitrogen was added, the 13 treatment decreased Lemhi wheat yields 52% and Nugaines wheat yields about 25%. Nitrogen fertilization almost eliminated yellowing and improved yields of both wheat varieties, compensating for overirrigation. Statistical interactions between irrigation and nitrogen were significant for Lemhi but not for Nugaines wheat. This indicates that the more extensive growth of Nugaines wheat early in the season may have decreased its sensitivity to over-irrigation.
Table 6. 1968 Lemhi and Nugaines grain yields. N
Treatment
Grain Yield Irrigationa l
Mean 1
1 12 13
lbs/Scre bu/acre
Lemhi
0 64.9 55.9 30.8 50.5 a2
57 67.6 66.7 58.0 64.1 b
114 70.1 75.2 69.0 71.4 c
Mean 67.5 b 65.9 b 52.6 a
Nugaines
0 93.8 96.0 70.3 86.7 a
110 119.2 120.6 109.2 116.3 b
220 128.8 124.8 113.6 122.4 b
Mean 113.9 b 113.8 b 97.7 a
1 lrrigations as shown in Table 1. 2
117
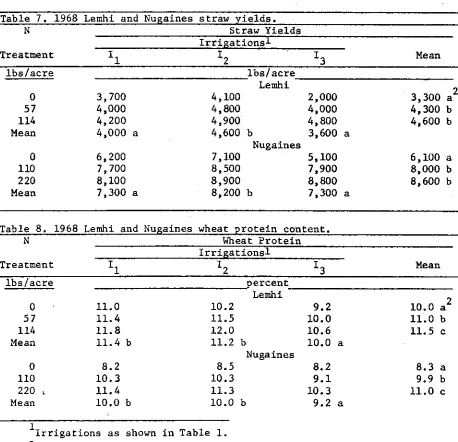
With both wheat varieties, the first increment of nitrogen increased straw yields but the increases from the second increment of nitrogen were not
statistically significant (Table 7). As was observed in previous years, the straw yield of Nugaines was about twice as great as that of Lemhi. Yields for both varieties were highest with the intermediate irrigation treatment.
The protein content of both wheat varieties was fairly high, increasing with each increment of nitrogen and decreasing with the 13 irrigation treatment
(Table 8). Interactions between nitrogen and irrigation were significant at the 0.05 significance level for Nugaines but not for Lemhi wheat protein.
Table 7. 1968 Lemhi and Nugaines straw yields.
N Straw Yields
Irrigations)
12 1
3
lbs/acre Lemhi
4,100 2,000
4,800 4,000
4,900 4,800
4,600 b 3,600 a Nugaines
7,100 5,100
8,500 7,900
8,900 8,800
8,200 b 7,300 a
Treatment 1
1 lbs/acre
0 3,700
57 4,000
114 4,200
Mean 4,000 a
0 6,200
110 7,700
220 8,100
Mean 7,300 a
Mean
3,300 a2
4,300 b 4,600 b
6,100 a 8,000 b 8,600 b
Table 8. 1968 Lemhi and Nugaines wheat protein content.
N Wheat Protein
Irrigations) Treatment I l
1 2 13 Mean
lbs/acre percent
Lemhi
0 11.0 10.2 9.2 10.0 a2
57 11.4 11.5 10.0 11.0 b
114 11.8 12.0 10.6 11.5 c
Mean 11.4 b 11.2 b 10.0 a
Nugaines
0 8.2 8.5 8.2 8.3 a
110 10.3 10.3 9.1 9.9 b
220 11.4 11.3 10.3 11.0 c
Mean 10.0 b 10.0 b 9.2 a
1
Irrigations as shown in Table 1.
SUMMARY
Nugaines and Lemhi wheat were grown in 1967 and 1968 with three nitrogen fertilization rates and three irrigation treatments each year. When no
nitrogen was applied to the Lemhi wheat, the check plots with optimum irri-gation (II) yielded approximately 65 bu/acre. Irrigating too early (April 27, 1967 or May 3, 1968) caused yellowing and stunting and the wheat yielded 50 bu/acre in 1967 and 31 bu/acre in 1968. Nugaines wheat yields were decreased from 99 to 82 bu/acre in 1967 and from 94 to 70 bu/acre in 1968 on the nitrogen check plots with overirrigation. Wheat yields in 1967 were below normal because of adverse weather conditions in late June and July during flowering and head-ing. Nitrogen fertilization compensated, for the most part, for excessive irrigation with both wheat varieties and increased yields to those of the best check plots. Maximum yields of 66 and 101 bu/acre in 1967, and 75 and 129 bu/acre in 1968 were obtained with Lemhi and Nugaines wheat by nitrogen ferti-lization and proper irrigation.
Lemhi wheat straw yields averaged about 6,900 and 4,100 lbs/acre in 1967 and 1968 while Nugaines straw yields were almost twice as great with 12,250
and 7,600 lbs/acre in 1967 and 1968. These large straw yields should effectively maintain soil organic matter but may require special handling and management in relation to the crop following wheat.
heavy nitrogen fertilization treatments increased wheat protein levels above the 9.5 to 10.0 percent desirable for best baking quality in soft white wheat used for pastry. Overirrigation decreased wheat protein. A more de-sirable method of decreasing wheat protein would be to
use
less nitrogen fertilizer.LITERATURE CITED
1. Robins, J. S. and C. E. Domingo. 1962. Moisture and nitrogen effects on irrigated spring wheat. Agron. J. 54(2):135-138.