Discovering Exclusive Patterns in Frequent Sequences
International Journal of Data Mining, Modelling and Management
2010 2(3), pp.252-267
Weiru Chen, Jing Lu, Malcolm Keech
Copyright © 2010 Inderscience Enterprises Ltd.
Discovering exclusive patterns in frequent sequences
Weiru Chen
Faculty of Computer Science and Technology,
Shenyang Institute of Chemical Technology, Shenyang China E-mail: WillC@china.com
Jing Lu*
School of Computing and Communications,
Southampton Solent University, East Park Terrace, Southampton UK E-mail: Jing.Lu@solent.ac.uk
*Corresponding Author
Malcolm Keech
Faculty of Creative Arts Technologies and Science, University of Bedfordshire, Park Square, Luton UK E-mail: Malcolm.Keech@beds.ac.uk
Abstract: This paper presents a new concept for pattern discovery in frequent
sequences with potentially interesting applications. Based on data mining, the approach aims to discover exclusive sequential patterns (ESP) by checking the relative exclusion of patterns across data sequences. ESP mining pursues the post-processing of sequential patterns and augments existing work on structural relations patterns mining. A three phase ESP mining method is proposed together with component algorithms, where a running worked example explains the process. Experiments are performed on real-world and synthetic datasets which showcase the results of ESP mining and demonstrate its effectiveness, illuminating the theories developed. An outline case study in workflow modelling gives some insight into future applicability.
Keywords: frequent sequences; sequential patterns post-processing;
exclusive sequential patterns (ESP); ESP mining; workflow modelling.
Biographical notes: Professor Weiru Chen is the Dean of the Faculty of
Computer Science and Technology at the Shenyang Institute of Chemical Technology (SYICT), China. He received his BSc in Computer Application (1985) from Dalian University of Technology, China, and MSc in Computer Science and Application (1988) from Northeastern University, China. His research interests include software architecture, software reliability engineering, data mining and grid computing, and he is also a Director of the Liaoning Computer Federation in China.
2006 from the University of Bedfordshire in the area of knowledge discovery and data mining.
Dr Malcolm Keech is Associate Dean, Creative Arts Technologies & Science at the University of Bedfordshire. He has worked extensively in computing and IT development and management, both in the academic and industrial sectors. While Malcolm’s original subject background lies in mathematics (BA Oxford, MSc/PhD Manchester), his professional experience includes periods at the London School of Economics, the Universities of London and Manchester, Florida State University, British Telecom and British Aerospace.
1 Introduction
Discovering sequential patterns from very large databases is an important data mining application. The conceptual approach and original mining method were first introduced by Agrawal & Srikant (1995) using a sequence database as input, where each data sequence consists of a list of items, and given a user-specified minimum support threshold. Sequential patterns mining aims therefore to find all of the frequent sub-sequences in the sequence database, i.e. those sub-sequences whose ratios of occurrence exceed the minimum support threshold.
Sequential patterns mining has featured in many application domains, e.g. the analysis of customer behaviour to discover frequent buying patterns; analysis of web access to discover user navigation patterns; prediction of natural disasters; and analyses of DNA and patients’ medical records. Driven by the applications, several techniques for sequential patterns mining have been proposed in the literature (Pei et al., 2001; Zaki, 2001; Lin and Lee, 2005).
With the successful implementation of efficient and scalable algorithms for mining sequential patterns, related research areas have emerged. For example, frequent episodes in event sequences (Mannila et al., 1997; Atallah et al., 2004); path traversal patterns in web logs (Chen et al., 1998; Li et al., 2005); periodic patterns in time-stamped databases (Yang et al., 2001; Sheng et al., 2006); and structural relation patterns in sequence databases (Lu, Chen et al., 2008) all take the mining of sequential patterns to novel structured forms.
Structural relation patterns mining has motivated the graph-based modelling of concurrent sequential patterns (Lu, Chen et al., 2010) and has also been applied in the web mining context for the identification of concurrency across web access patterns (Lu, Keech et al., 2009). This paper will focus on exclusive patterns, proposing specifically exclusive sequential patterns, and a corresponding mining method is described and explained through a running worked example. The relevance of the exclusive methodology is highlighted within the context of workflow modelling.
The remainder of the paper is structured as follows: the idea of exclusion in frequent sequences is introduced in section 2 and exclusive sequential patterns (ESP) are defined formally. In section 3, an ESP mining method is presented, which is specified along with its component algorithms. An experimental evaluation using real and synthetic datasets is given in section 4 which showcases the results of ESP mining. In section 5, we describe potential applications as well as indicate future research directions by suggesting a model to represent ESPs graphically.
2 Exclusion and Exclusive Sequential Patterns
This section first reviews the basic concepts in sequential patterns mining and then introduces formally the definition of exclusive sequential patterns and the problem of mining ESPs.
2.1 Preliminaries
We adopt the notation used in Prefixspan (Pei et al., 2001) for sequential patterns mining. Let I={i1,…, it} be a set of t items. A data sequence S=<s1,…, sl> is an
ordered list of items, where siI, 1≤i≤l, and si is also called an element of the
sequence. The number of items in a sequence is called the length of the sequence. A data sequence of length l is called an l-sequence.
A sequence S1=<X1, X2,…, Xu> is contained in another sequence S2=<Y1,
Y2,…, Yv> if uv and there exist integers 1≤i1<i2<…<iu≤v such that
Xj=
j
i
Y (1≤j≤u), and it is denoted by S1S2. If sequence S1 is contained in sequence
S2, then S1 is called a sub-sequence of S2 and S2 a super-sequence of S1.
A sequence database (SDB) is a set {S1, S2, …, Sn}, where each Si (1≤i≤n) is a
data sequence. The support in SDB of any given data sequence S is defined as Sup(S)=|{Si:SSi}|/n, where |…| denotes the number of sequences. Given a
fraction minsup (0minsup1) as the minimum support threshold, S is called a sequential pattern in SDB if Sup(S)≥minsup. A sequential pattern is called a maximal sequence if it is not contained in any other sequential patterns.
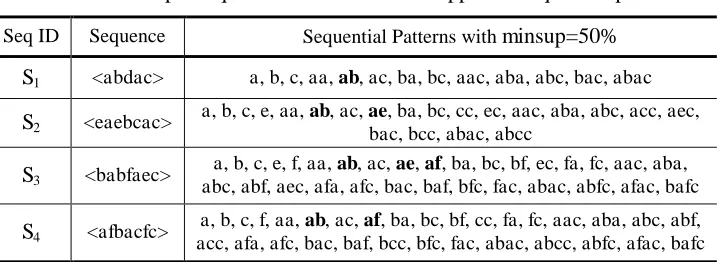
Table 1 A sample sequence database and its supported sequential patterns
Seq ID Sequence Sequential Patterns with minsup=50% S1 <abdac> a, b, c, aa, ab, ac, ba, bc, aac, aba, abc, bac, abac
S2 <eaebcac>
a, b, c, e, aa, ab, ac, ae, ba, bc, cc, ec, aac, aba, abc, acc, aec, bac, bcc, abac, abcc
S3 <babfaec>
a, b, c, e, f, aa, ab, ac, ae, af, ba, bc, bf, ec, fa, fc, aac, aba, abc, abf, aec, afa, afc, bac, baf, bfc, fac, abac, abfc, afac, bafc
S4 <afbacfc>
a, b, c, f, aa, ab, ac, af, ba, bc, bf, cc, fa, fc, aac, aba, abc, abf, acc, afa, afc, bac, baf, bcc, bfc, fac, abac, abcc, abfc, afac, bafc
2.2 Problem Definition
Given a sequence database SDB={S1, S2,…, Sn}; let , be two of the sequential
patterns mined from SDB with minimum support threshold minsup and assume that , are not contained in each other.
With regard to a particular data sequence SSDB, sequential patterns and have an exclusive relationship if and only if one of them has occurred in S but not both, i.e. (( S)( S))(( S)( S)). This is represented by [ – ]S,
where the notation ‘–’ represents the exclusive relationship.
It may be interesting to detect exclusive relationships within the whole sequence database SDB or within a particular sub-set of SDB, i.e. those data sequences where either or or both appear. The exclusive degree can thus be absolute or relative as defined respectively below.
Definition 1. The absolute exclusion of sequential patterns and is defined by
exclusion( , )=|{Sk:[ – ]Sk}|/n (1)
where SkSDB and 1≤k≤n, while the relative exclusion of sequential patterns
and is defined by
exclusion( , )=|{Sk:[ – ]Sk}|/|{Sk:( Sk)( Sk)| (2)
It can be seen from formula (1) that absolute exclusion is defined as the fraction of data sequences that contains either or (not both); while the denominator of formula (2) is the number of relevant data sequences from SDB, i.e. the sub-set which contains either or (or both), and forms part of a relative measure.
Example 2 For the sequential patterns pair ab and ae shown in bold in Table 1, according to Definition 1, both its absolute exclusion and relative exclusion are the same, i.e. exclusion(ab,ae)=2/4=50%.
For another pair of sequential patterns ae and af, also shown in bold, the absolute exclusion can be calculated as
exclusion(ae,af)=2/4=50%; while its relative exclusion is
exclusion(ae,af)=2/367%.
Another percentage value, the minimum exclusion threshold (0<minexc≤1), is introduced below to check the exclusive relationship of sequential patterns. The absolute exclusion of a pair of sequential patterns (e.g. and ) is related to the total number of data sequences, while the focus of relative exclusion is on those data sequences which support either (or both) of or . We will use relative exclusion throughout the rest of the paper as the standard.
Definition 2. Let minexc be the user-specified minimum exclusion. If exclusion( , )minexc
is satisfied, then and are called Exclusive Sequential Patterns (ESP). This is represented by ESP=[ – ] where there is no particular order, i.e. [ – ]=[ – ]. Therefore, further to Example 2, if minexc=65%, then only ae and af constitute an exclusive sequential pattern given by ESP=[ae–af]; if minexc=50%, there are two exclusive patterns, i.e. ESP={[ae–af], [ab–ae]}.
Problem statement: given a sequence database SDB={S1, S2,…, Sn} and
sequential patterns mining results {sp1,sp2,…,spm} (i.e. sequential patterns which
satisfy a minimum support threshold minsup), exclusive sequential patterns mining aims to discover the set of all exclusive patterns beyond a given user-specified minimum exclusion minexc.
Definition 3. An exclusive sequential pattern ESP1=[a1–a2] is contained in
another exclusive pattern ESP2=[b1–b2] if (a1b1)(a2b2)(a1b2)(a2b1).
This is denoted by ESP1ESP2. Exclusive sequential patterns are called maximal
if they are not contained in any other exclusive patterns.
For example, among exclusive sequential patterns [e–f], [e–af], [e–abf], [e– abfc] and [aec–abfc], because [e–f][e–af][e–abf][e–abfc][aec–abfc], the maximal exclusive pattern is [aec–abfc].
Extending the exclusive relationship to three sequential patterns , and results in [ – –]S, that is (( S)( S)(S))(( S)( S)(S))
(( S)( S)(S)). And, more generally, let {sp1,sp2,…,spr} be a set of
r sequential patterns mined under minimum support minsup. If they are not contained in each other, then [sp1–sp2–…–spr]S represents r sequential patterns
which are exclusive with respect to data sequence S.
Definition 4. The absolute exclusion of sequential patterns sp1,sp2,…,spr is
defined as
exclusion(sp1,sp2,…,spr)=|{Sk:[sp1–sp2–…–spr]Sk}|/n
where SkSDB and 1≤k≤n, while the relative exclusion of sequential patterns
sp1,sp2,…,spr is defined as
exclusion(sp1,sp2,…,spr)=|{Sk:[sp1–sp2–…–spr]Sk}|/|Sk:(i=1,...,r), spiSk |.
If exclusion(sp1,sp2,…,spr)minexc is satisfied, then sp1,sp2,… and spr are
called Exclusive Sequential Patterns.
3 ESP Mining Method and Algorithms
pair constitutes an exclusive sequential pattern using Definitions 1 and 2 under a given minimum exclusion threshold. How to find all the possible exclusive combinations from a sequential patterns set is a challenging issue. This section will discuss the mining method for ESPs with a focus in particular on the search for pairs of exclusive patterns.
3.1 Support Data Structure
Before proposing the ESP mining method and component algorithms, a compact data structure called support vector, Supp(spi), is defined for every sequential
pattern spi (1im) as:
Supp(spi)=
n 2 1 v v v ,
where vk=1 (1kn) if sequential pattern spi (1im) is contained in data
sequence Sk (1kn), i.e. spiSk; otherwise vk=0.
For example, for the SDB in Table 1 and sequential patterns ae and af from the set SP,
Supp(ae)= 0 1 1 0 and Supp(af)= 1 1 0 0 .
Putting all the support vectors together forms a support matrix, Supp[SDB,SP], with data sequences Sk (1kn) as rows and sequential patterns
spi (1im) as columns:
sp1 … spi … spm
S1 v11 … v1i … v1m
… … … …
Sk vk1 … vki … vkm
… … … …
Sn vn1 … vni … vnm
Supp[Sk,spi]=vki=1 if spiSk (1kn, 1im), i.e. sequential pattern spi (1im)
is contained in data sequence Sk (1kn); otherwise Supp[Sk,spi]=vki=0.
3.2 Pairwise Exclusion Method
Now we split the problem of mining exclusive sequential patterns into three phases and explain the approach based on the exclusion of pairs of patterns with the running example. Consider the sequence database SDB={<abdac>, <eaebcac>, <babfaec>, <afbacfc>} and sequential patterns SP={a, b, c, e, f, aa, ab, ac, ae, af, ba, bc, bf, cc, ec, fa, fc, aac, aba, abc, abf, acc, aec, afa, afc, bac, baf, bcc, bfc, fac, abac, abcc, abfc, afac, bafc} from Table 1 with minexc=65%.
Phase 1. Initialisation. Construct the support matrix Supp[SDB,SP] – delete columns spd (1dm) from Supp[SDB,SP] where Supp[Sk,spd]=1 (k, 1kn).
All 1s means these sequential patterns are supported by all the data sequences and they are not able to constitute an ESP with any other sequential pattern.
Construct the support matrix Supp[SDB,SP], which has four data sequences as rows and 35 sequential patterns as columns. By eliminating the columns with all 1s, this results in Table 2.
Table 2 A support matrix example
e f ae af bf ec fa fc abf ... afa afc bfc fac abfc afac bafc
S1 0 0 0 0 0 0 0 0 0 ... 0 0 0 0 0 0 0
S2 1 0 1 0 0 1 0 0 0 ... 0 0 0 0 0 0 0
S3 1 1 1 1 1 1 1 1 1 ... 1 1 1 1 1 1 1
S4 0 1 0 1 1 0 1 1 1 ... 1 1 1 1 1 1 1
Phase 2. Exclusion Checking. We need to repeatedly check the exclusion of a given pair of sequential patterns and determine whether or not they constitute an exclusive pattern. First of all, generate all the possible pairs of sequential patterns (spi,spj), where 1im, 1jm, ij and they are not contained in each other. Then,
for each pair of sequential patterns (spi,spj), repeat the following:
a) Sum their support vectors as
Supp[Sk,spi]+Supp[Sk,spj];
b) Count the total number of entries in the resulting vector above which have value 1 and 2, denoted by w1 and w2 respectively;
c) Calculate the exclusion from
exclusion(spi,spj)= w1/(w1+ w2)
d) If exclusion(spi,spj)≥minexc, then spi and spj constitute an exclusive
sequential pattern [spi–spj].
For example, some of the possible combinations of the sequential patterns from Table 2 are: (e,f), (e,af), (e,bf), (e,fa), (e,fc), (e,abf), (e,afa), (e,afc), (e,bfc), (e,fac), (e,abfc), (e,afac),…, (ae,af),…, (afa,bfc), (afa,fac), (afa,abfc), (afc,bfc), (afc,fac), (bfc,fac), (bfc,afac), (fac,abfc), (abfc,afac).
Combinations such as (e,ae), (ec,aec) or (fc,abfc) are not taken further because one of their patterns is contained by the other in the pair.
Consider the shaded pair (ae,af) in Table 2 for example and sum the support vectors as follows:
Supp[Sk,ae]+Supp[Sk,af]=
2 1 1 0
.
Counting the total number of entries in the vector, i.e. w1=2 and w2=1, leads to
an exclusion(ae,af) of 2/(2+1)67%65%; therefore ae and af constitute an exclusive sequential pattern given by ESP=[ae–af].
afac], [af–aec], [bf–ec], [bf–aec], [ec–fa], [ec–fc], [ec–abf], [ec–afc], [ec–bfc], [ec–fac], [ec–abfc], [ec–afac], [fa–aec], [fc–aec], [abf–aec], [aec–afa], [aec–afc], [aec–bfc], [aec–fac], [aec–abfc], [aec–afac],..., [aec–abcc], [aec–bafc], [abcc– abfc], [abcc–afac]}.
Phase 3. Optimisation. Find the maximal exclusive sequential patterns according to Definition 3 and delete all non-maximal patterns from ESP.
For example, [e–f][e–af][e–abf][e–abfc][aec–abfc], [f–ae][f–aec], [ae–af][ae–abf][aec–afac],…,[ae–bf][ae–bfc][aec–abfc]. Deleting the exclusive patterns which are contained in other exclusive patterns results in the set of six maximal exclusive sequential patterns:
[ae–abcc], [aec–abfc], [aec–afac], [aec–bafc], [abcc–abfc], [abcc–afac]. The three phases described above for pairwise exclusion can be extended to multi-ESP mining, where the mutual exclusion of sequential patterns is sought more generally. The initialisation phase remains the same while checking the exclusion of sequential patterns sp1,sp2,…,spr in phase 2 is performed according
to Definition 4. An extension of Definition 3 would embrace the optimisation phase reducing the exclusive sequential patterns found to the maximal set.
3.3 Algorithm Development
Following the pairwise exclusion method, we develop algorithms corresponding to each phase above. Notation is used to simplify the algorithms proposed in pseudo code below:
SubSeq(spi) – represents a set of sub-sequences of sequential patterns spi.
esp – represents a particular exclusive sequential pattern; esp[1] is the first sequential pattern and esp[2] is the second of the pair.
Algorithm 1 Initialisation
Input: Sequence database SDB={S1, S2, …, Sn} and sequential patterns
SP={sp1,sp2,…,spm}.
Output: Support matrix Supp[n,m]. Method:
(1) Define an empty support matrix Supp[n,m] with n rows and m columns (2) for each sequential pattern spiSP do
(3) {for each data sequence SkSDB do
(4) {if spiSk //spi is occurred in Sk
(5) Supp[k,i]=1; (6) else
(7) Supp[k,i]=0;}
(8) delete spi from Supp if Supp(k,i)=1, k=1,…,n}
Algorithm 2 Exclusion checking and ESP output
Input: Support matrix Supp[n,m], sub-sequence sets SubSeq(spi) and
user-specified minimum exclusion minexc. Output: Exclusive sequential patterns ESP. Method:
(2) for (i=1; im; i++) do //get the first of the pair of sequential patterns (3) {for (j=i+1; jm; j++) do //get the second of the pair (4) {w1=0; w2=0;
(5) if (spiSubSeq(spj))(spjSubSeq(spi))
//i.e. spi and spi are not contained in each other
(6) {for (k =1; kn; k++) do (7) {w=Supp[k,i]+Supp[k,j];
(8) Case w=1 //only one of spi or spj occurred in Sk
(9) w1=w1+1;
(10) Case w=2 //both spi and spj occurred in Sk
(11) w2=w2+1;
(12) excl= w1/(w1+w2); //exclusion(spi,spi)
(13) if excl≥minexc
(14) {espq=[spi–spj]; //a new exclusive sequential pattern
(15) ESP=ESPespq; q=q+1;}}
(16) }}}
Algorithm 3 Optimisation
Input: Exclusive sequential patterns ESP={esp1,esp2,…,espq}.
Output: Maximal exclusive sequential patterns. Method:
(1) for (r=1; rq; r++) do // while ESP is not empty (2) {for (s=r+1; s≤q; s++) do
(3) {if (espr[1]SubSeq(esps[1])espr[1]SubSeq(esps[2]))
(espr[2]SubSeq(esps[1])espr[2]SubSeq(esps[1]))
//espr is contained in another exclusive sequential pattern esps
(4) ESP=ESP - espr;}} // delete espr from ESP
These algorithms complete the pairwise exclusion method for the discovery of exclusive sequential patterns. While it is non-trivial to extend the approach to the general case, this will be the subject of future work.
4 Experiments
The empirical analysis of the proposed ESP mining method was performed on a real dataset as well as a synthetic dataset that was especially created to test the exclusive sequential patterns mining algorithms.
4.1 Customers Orders Dataset
The Orders dataset corresponds to customer purchase data made up of Customer IDs, Order IDs and Product IDs. It contains data collected from 1,821 customers’ behaviour between 28 January 2000 and 31 March 2000, and it includes 3,420 records (i.e. 3,420 purchases), 1,917 orders and 999 different kinds of product. Table 3 illustrates the format and contents of the Orders data.
Table 3 Format/content of the Orders dataset
Customer ID Order ID Product ID
… … …
62 3550 19155
62 30018 40393
96 100 13147
132 136 13147
184 4124 40353
184 4124 44477
184 4124 45371
184 23126 35289
224 228 13143
224 228 14087
… … …
Sequential Patterns Mining
The method and algorithms for ESP mining described in section 3 have been implemented using Microsoft Visual C++, where sequential patterns mining within certain minimum support thresholds (minsup) will be performed first. We use the PrefixSpan algorithm available from the IlliMine system package, a partially open-source data mining package at http://illimine.cs.uiuc.edu/, last accessed 7 August 2009. Table 4 illustrates the sequential patterns mining results under different minsup for the Orders dataset.
Table 4 Sequential patterns mining results on the Orders dataset
minsup (%) Number of k-sequences 1-sequence 2-sequence
3 1 -
2.5 2 -
2 4 -
1.5 11 -
1 23 -
0.5 64 1
Exclusive Sequential Patterns Mining
Based on the sequential patterns discovered above, user-specified exclusion thresholds (minexc) are set to mine pairs of exclusive patterns. Table 5 highlights the number of exclusive sequential patterns mined under different minsup and minexc combinations.
Table 5 ESP mining results on the Orders dataset
minsup Pairwise Combinations
ESP numbers under different minexc
100% 99% … 91% … 70% …
2.5% 1 1 1 … 1 1 1 1
2% 6 5 6 … 6 6 6 6
1.5% 55 50 51 … 55 55 55 55
1% 253 228 229 … 249 … 253 253
Table 5 shows that, under a specific minsup, the number of ESPs increases to the asymptote of pairwise combinations as minexc decreases – as shown in the shadow part of the table. We are more interested in the exclusive patterns discovered as minsup increases (i.e. those sequential patterns supported by more data sequences) and with larger minexc (i.e. the probability of these sequential patterns being exclusive is higher). In this example, there is one ESP=[39961– 40341] when minsup=2.5% and minexc=100%. This exclusive pattern not only corresponds to products 39961 and 40341 having been purchased by at least 2.5% customers (i.e. 46 out of 1,821), but also these products are 100% exclusive, i.e. any customers who bought one of them did not buy the other one.
Relationship Between minexc and minsup
Table 5 demonstrates that the minimum exclusion thresholds minexc can be quite large compared with the small minsup values in this case. There could be some relationship between these two thresholds and it is worth considering this further to indicate guidelines for future parameter setting.
The minimum support implies that, for any single sequential pattern , the probability of it occurring in data sequences is P, where minsup≤P≤1; and the probability of it not occurring in data sequences is (1-P). For any two sequential patterns and , the probability of them both occurring together in a data sequence is P*P=P2; the probability of neither of them occurring in a data sequence is (1-P) 2; the probability of either of them occurring in a data sequence is 1-(1-P)2; and the probability of one and only one of them occurring in a data sequence is (1-(1-P) 2)- P2.
Applying this elementary analysis to the definition of (relative) exclusion in formula (2), the probability of sequential patterns and being (relatively) exclusive will be:
P P P P P P Pexc 2 1 ) 1 ( 1 ) 1 ( 1 ) ( 2 2 2 (3)
Pexc(P). For example, when P=minsup=2.5~1% (from Table 5), the probability of any pair of sequential patterns being exclusive is calculated as between 98.7% and 99.5%. That is, the most interesting ESPs should be found when minexc is set around 98-100%.
4.2 Synthetic Dataset
In this section, we performed ESP mining experiments on a large-scale synthetic dataset which was drawn from the IBM Almaden data generator – http://www.almaden.ibm.com/cs/projects/iis/hdb/Projects/data_mining/datasets/s yndata.html, last accessed 7 August 2009 – which has been used in sequential patterns mining studies (Agrawal and Srikant, 1995; Pei et al., 2001).
This synthetic dataset generator produces a database of sequences whose characteristics can easily be controlled by the user. It requires the specification of the average number of transactions in a sequence |C|, the average number of items in a transaction |T|, the average length of maximal potentially large sequences |S|, the number of different items |N| and the number of data sequences |D|. For example, C50-T1-S4-N50-D10K means that the dataset contains 10,000 data sequences and 50 different items, where the average number of items in a transaction (i.e. event) is set to 1 and the average number of transactions per data sequence is set to 50.
Sequential Patterns Mining
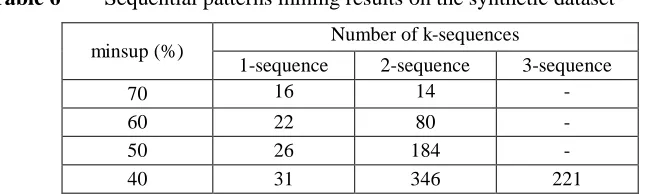
Table 6 illustrates the relationship between minsup and the number of sequential patterns found in the C50-T1-S4-N50-D10K synthetic dataset as a result of sequential patterns mining.
Table 6 Sequential patterns mining results on the synthetic dataset
minsup (%) Number of k-sequences
1-sequence 2-sequence 3-sequence
70 16 14 -
60 22 80 -
50 26 184 -
40 31 346 221
The table shows that, (e.g.) when minsup=60%, there are 22 sequential patterns with a unique item and 80 sequential patterns with two items.
Exclusive Sequential Patterns Mining
Before performing ESP mining, formula (3) has been used to predict the probability of exclusion for the four minsup values (70~40%) in Table 6 and the results are:
Using these Pexc values as a guideline, a corresponding series of minexc has been used for the synthetic dataset and Table 7 shows the ESP mining results.
Table 7 ESP mining results on the synthetic dataset
(minsup=70%)
minexc ≥45.5% 45% 44.5% 44% 43.5% 43%
No. of ESPs 0 4 10 18 35 53
(minsup=60%)
minexc ≥58% 57.5% 57% 56.5% 56% 55.5%
No. of ESPs 0 1 6 15 50 109
(minsup=50%)
minexc ≥67% 66.5% 66% 65.5% 65% 64.5%
No. of ESPs 0 8 37 112 257 508
(minsup=40%)
minexc ≥76.5% 76% 75.5% 75% 74.5% 74%
No. of ESPs 0 3 24 241 1092 3241
It can be seen from the range of shaded minexc values in Table 7 that Pexc is close to the point beyond which no ESPs are discovered. Therefore, formula (3) can potentially be used to guide how to set up the minimum exclusion threshold to obtain a limited number of the most useful exclusive patterns.
5 Applications of ESP
Exclusive Sequential Patterns mining is a new technique based on traditional sequential patterns mining and, as such, it can be applied to the corresponding range of domains. For example, when using a database with transactions performed by customers at any instant, it is possible to predict what would be the customers’ regular buying or non-buying behaviour, based on their past transactions; or one could analyse medical records of patients for temporal patterns between symptoms, diagnosis, treatment and examination results. Other applications include web access patterns mining and process analysis of scientific experiments.
Among the original control-flow patterns there are five basic types: sequence, parallel split, synchronization, exclusive choice and simple merge. Figure 1 shows the latter four constructs graphically.
Figure 1 Graphical representation of workflow control patterns
A AND
B
C
A AND B
C
Parallel Split Synchronization
A XOR
B
C
A XOR B
C
Exclusive Choice Simple Merge
The parallel split pattern allows a single thread of execution to be split into two (or more) branches which can execute tasks concurrently. Synchronization comes into play once the control node receives input on one of its incoming branches, at a point in the workflow process where multiple parallel activities converge into one single thread of execution. The concurrent sequential patterns mining and modelling proposed by Lu, Chen et al. (2008, 2010) can discover and represent parallel split and synchronization patterns, i.e. it is applicable to this first aspect of workflow model design.
The exclusive choice pattern is defined as being a location in a process where the flow can be split into two or more alternative branches. The pattern is exclusive in that only one of the alternatives may be chosen for the process to continue. Simple merge is defined similarly as being a location in a process where a set of alternative incoming branches forms a single exclusive path. It is natural to consider how exclusive sequential patterns can be applied to these two workflow control patterns as an extension of current research.
The use of graph-based modelling in data mining has led to the development of a novel model called Sequential Patterns Graph (SPG) that explores the inherent relationship among sequential patterns (Lu et al., 2004). In this model, nodes of SPG correspond to items in a sequential pattern and directed edges are used to denote the sequence relation between two elements. The idea has been adapted for modelling concurrent sequential patterns (and called ConSP-Graph) with two special nodes, called fork nodes and synchronizer nodes respectively, to represent the concurrent relationship (Lu, Chen et al., 2010).
Figure 2 Graphical representation of ESP
b
e
f
a
e
a
b
a
c
c
f
c
(i) [aec–abfc] (ii) a[e–bf]c
–
–
Two special nodes can be characterised to represent the exclusive relationships in Figure 2(ii): the start node a here can be seen as a type of exclusive fork node, allowing independent execution of its alternative branches to nodes e and b, where only one of them is chosen; the final node c can be seen similarly as an exclusive synchronizer node, with alternative branches from nodes e and f allowing no more than one outgoing sequential relation (and none in this case).
The expression and construction method of ConSP-Graph can be adapted to a potential ESP-Graph representation, where the notation ‘–’ is used in the model for connecting exclusive paths. The formal definition and approach for this is another research direction to be pursued.
References
Aalst, W.M.P. van der, Hofstede, A.H.M. ter, Kiepuszewski, B. and Barros, A.P. (2003) ‘Workflow patterns’, Distributed and Parallel Databases, Vol. 14, No. 3, pp.5-51.
Agrawal, R. and Srikant, R. (1995) ‘Mining sequential patterns’, Proceedings of 11th International Conference on Data Engineering, Taipei, Taiwan, IEEE Computer Society Press, pp.3-14.
Atallah, M.J., Gwadera, R. and Szpankowski, W. (2004) ‘Detection of Significant Sets of Episodes in Event Sequences’, Proceedings of the 4th International Conference on Data Mining, pp.3-10.
Chen, M.S., Park, J.S. and Yu, P.S. (1998) ‘Efficient data mining for path traversal patterns’, IEEE Transactions on Knowledge and Data Engineering, Vol. 10, No.2, pp.209-221.
Kohavi, R., Brodley, C., Frasca, B., Mason, L. and Zheng, Z.J. (2000). ‘KDD -Cup 2000 Organizers' Report: Peeling the onion’, SIGKDD Explorations, Vol. 2, No. 2, pp.86-98.
Lin, M.Y. and Lee, S.Y. (2005) ‘Fast discovery of sequential patterns through memory indexing and database partitioning’, Journal of Information Science and Engineering, Vol. 21, No. 1, pp.109-128.
Lu, J., Wang, X.F., Adjei, O. and Hussain, F. (2004) ‘Sequential patterns graph and its construction algorithm,’ Chinese Journal of Computers, 27(6), pp.782-788.
Lu, J., Chen, W. R., Adjei, O. and Keech, M. (2008) ‘Sequential patterns post-processing for structural relation patterns mining,” International Journal of Data Warehousing & Mining, 4(3), pp.71-89.
Lu, J., Keech, M. and Chen, W. R. (2009) ‘Concurrency in web access patterns mining’, International Conference on Data Mining, World Academy of Science, Engineering and Technology, Vol. 58, pp.600-609, ISSN 2070-3724.
Lu, J., Chen, W. R. and Keech, M. (2010) ‘Graph-based modelling of concurrent sequential patterns’, International Journal of Data Warehousing & Mining, 6(2), to appear.
Mannila, H., Toivonen, H. and Verkamo, A.I. (1997) ‘Discovery of frequent episodes in event sequence’, Data Mining and Knowledge Discovery, Vol. 1, No. 3, pp.259-289.
Pei, J., Han, J.W., Mortazavi-Asl, B. and Pinto, H. (2001) ‘PrefixSpan: Mining sequential patterns efficiently by prefix-projected pattern growth’, Proceedings of the 7th International Conference on Data Engineering, Heidelberg, Germany, pp.215-224.
Russel, N., ter Hofstede, A., Aalst, W.M.P. van der. and Mulyar, N. (2006) ‘Workflow Control-flow Patterns. A revised View’, BPM Centre Report, BMP-06-22, http://is.tm.tue.nl/staff/wvdaalst/BPMcenter/
Sheng, C., Hsu, W. and Lee, M.L. (2006) ‘Mining Dense Periodic Patterns in Time Series Data’, Proceedings of the 22nd International Conference on Data Engineering, pp.115.
White, S. (2004) ‘Process Modeling Notations and Workflow Patterns’, The Workflow Handbook 2004, Future Strategies Inc., Lighthouse Point, pp. 265-294.
Yang, J., Wang, W. and Yu, P.S. (2001) ‘Infominer: Mining Surprising Periodic Patterns’, Proceedings of the 7th ACM SIGKDD International Conference on Knowledge Discovery and Data Mining, pp. 395-400.