Copyright © The Author(s). All Rights Reserved. Published by American Research Institute for Policy Development DOI: 10.15640/jibe.v7n2a7 URL: https://doi.org/10.15640/ jibe.v7n2a7
Human Development Index and the Forming Factors:
The Effect of Global
Competitiveness Index in Ten ASEAN Countries
Edy Suandi Hamid
1Abstract
This research aims to identify and to analyze the influence of the main factors forming the Human Development Index (HDI) toward the Global Competitiveness Index (GCI). This research was conducted for the ten ASEAN countries. The analytical method used is the granger causality panel and panel data regression. Analysis of the non-hierarchical clustering panel is also used to divide the country into two clusters. The dependent variable used in this research is the Global Competitiveness Index (GCI). Independent variables used in the research are the Life Expectancy at Birth, Expected Years of Schooling, Mean Years of Schooling, and Gross National Income (GNI) per capita.Data is obtained from UNDP, UNESCO, and the World Bank from 2010-2015. This research found that HDI and its forming factors affect the level of global competitiveness. The analysis concludes that: (1) High Cluster; Brunei Darussalam, Malaysia, Singapore, Thailand and the rest are in the middle-low Cluster. (2) All of the independent variables affect the dependent variable partially.
Keywords: Human Development Index, the Global Competitiveness Index, ASEAN, Competitiveness.
Introduction
The more open economies around the world since the last three decades has forced many countries changed its policy.The same situation also occurred in Indonesia. In the reign of first President, Sukarno, promoted the concept of “Berdikari”, tends to lead to a closed economy. It was gradually changed during on the next government and started to open their economy toward global connection. In economy, it is certainly not efficient if a nation must produce all their own needs. The term of “Berdikari” should be interpreted as: (1) ability to produce the goods and services that can potentially be produced, either for their raw materials, technological mastery, or in possession of skills that can be produced in an efficient and competitive; (2) bargaining power ability in economic relations with other countries.
The main aspect that must be considered in analyzing and observing the independence of the nation is its nation's competitiveness (Sabadie & Johansen, 2010). The index is commonly used to measure the competitiveness is the Global Competitiveness Index (GCI) released the World Economic Forum (WEF). As shown in the Table 1.1, Singapore occupies the second position globally. It is an achievement of a country in ASEAN. Indonesia and Thailand are country with medium levels of competitiveness. This situation is a challenge to improve the nation's independence in the context of globalization.
Table 1.1 GCI Rank of ASEAN Countries
Rank Score Country
3 5.71 Singapore
23 5.17 Malaysia
46 4.52 Brunei Darussalam
32 4.72 Thailand
36 4.68 Indonesia
56 4.35 Philippines
55 4.36 Vietnam
98 3.91 Lao
94 3.93 Cambodia
Source: The Global Competitiveness report WEF 2017-2018.
In developing countries, human resources is instrumental in the development of a country (Dao, 2011). Efforts to strengthen the competitiveness of a nation, especially in the economic field is influenced by the quality and quantity of human resources. On the other hand, developing countries tend to have problems in improving the capacity and skills of its human resources.
Although there are many indicators possibly used to measure the state of human resources development, the most commonly used and recognized indicator is Human Development Index (HDI) (Anand & Sen, 2000). Developing countries would almost certainly occupy middle class of the Human Development Index even lower. The main problem of human resources in developing countries is the concentration of employment in the traditional and informal sectors. Traditional and informal sector is very easily affected by natural phenomena and the shifting preferences of the public.
Most ASEAN countries, excepting Singapore, can be characterized as developing countries with low HDI. According to the UNDP report in 2017, Philippines, Indonesia and Vietnam have medium level of human development, while Malaysia and Thailand are on the high level of human development. Singapore and Brunei Darussalam are the only two ASEAN countries that achieve a very high level of human development. If it is viewed from the side of the trend, Human Development Index across the ASEAN countries to grow positively. The development is a sign of improvement in the factor components that make up the Human Development Index.
Table 1.2 Rank and Value HDI of ASEAN Countries
Source: UNDP Human Development Report (2017, 2014, 2015) and World Bank (2013)
It is important to understand the fact that the value of HDI represents the value of the factors that compose it (Labutkova, Bednarova, & Valentova, 2016). Human Development Index has three basic dimensions that include longevity and health, knowledge, and standards of decent life. These dimensions are represented by the following variables: life expectancy at birth, expected years of schooling, mean years of schooling, and GNI per capita (2011 PPP$). There has been some previous research on HDI that investigate whether HDI and its components truly reflect the progress in human development. Based on previous studies on the competitiveness of nations, human resources are key factor that determines the competitiveness of a country.
Therefore, a question that immediately arises whether HDI is truly an important factor that affects competitiveness of a nation. This study aims to investigate whether the components that make up HDI affect
HDI Ranks HDI Value
2017 1990 1995 2000 2005 2010 2011 2012 2013 2014 2017
9 Singapore 0.756 n.a. 0.826 0.852 0.892 0.894 0.895 0.901 0.912 0.932
39 Brunei Darussalam 0.773 0.787 0.792 0.801 0.805 0.854 0.855 0.852 0.856 0.853
57 Malaysia 0.616 0.659 0.691 0.726 0.744 0.766 0.769 0.773 0.779 0.802
83 Thailand 0.546 0.581 0.600 0.631 0.654 0.686 0.690 0.722 0.726 0.755
113 Philippines 0.552 0.569 0.597 0.619 0.649 0.651 0.654 0.660 0.668 0.699
116 Indonesia 0.479 0.508 0.540 0.575 0.620 0.624 0.629 0.684 0.684 0.694
competitiveness in ASEAN countries. First, it tries to identify the components that compose HDI and how the global competitiveness index (GCI) is constructed. Second, it constructs a model of how GCI is determined in order to explain the behavior of the global competitiveness of nations.
Literature Review
Human Development Index is an index used to measure how well human development has taken place in a country (Martinez, 2012). Research on the level of global competitiveness is still not a done deal. Much of the literature is a form of review of phase to global competitiveness, such as E–Governance Development (2010), review the phases of global competitiveness.
However, several studies examine relationships between the Human Development Index and global competitiveness. Studies by Anand & Sen (2000), Cahill (2002), Khodabakhshi (2011), show how the real sector of the economy, including global competitiveness, influence the Human Development Index. The study that focuses on the behavior of competitiveness as a dependent variable is nearly absent.
Theoretically, human development will affect competitiveness. This is because humans are the main factor determining global competitiveness. The transmission goes the following. The qualified human resources will generate positive and significant economic growth, which in turn enhance the global competitiveness. Accordingly, this study proposes a hypothesis that Life Expectancy at Birth, Expected Years of Schooling, Mean Years of Schooling, and Gross National Income per Capita (2011 PPP $) affect positively the Global Competitiveness Index (GCI).
Research Methodology Methods of Data Analysis
The data are secondary data and taken from various sources: the UNDP reports, the World Bank, the UNESCO, and the World Economic Forum. The data cover the period 2010-2015 and include the ten ASEAN countries: Brunei Darussalam, Cambodia, Indonesia, Laos, Malaysia, Myanmar, the Philippines, Singapore, Thailand, and Vietnam. Next is performing clustering of the data into classes using the non-hierarchical clustering method.
The data are analyzed in the following steps. First, the data are clustered to get clusters of the corresponding ten ASEAN countries. Second, a panel unit root test is then conducted to determine the maximum degree of integration of the data. Next, a panel Granger causality testis conducted to identify directions of causality among the variables. Finally, a panel for each cluster of data is tested.
Clustering
Clustering is divided into two types of data mining, first clustering is the hierarchical model, the second model of the non-hierarchical (Labutkova, Bednarova, & Valentova, 2016). Clustering definitions used in this study is a grouping of data with a certain set of similarities. If you look at the data characteristics and diversity of data, as well as the purpose of research, then the clustering technique can use non-hierarchical clustering much simpler. Countries are individually classified into several clusters according to the standard distance of Squared Euclidian (Labutkova, Bednarova, & Valentova, 2016):
(1)
In which:
is distance between and
, it also shows that , j = 1, 2,... P, and is the sample of variable j.
Panel Granger Causality
Causality test is a test of two variables that indicate a relationship of mutual influences. Testing causality is a statistical test conducted to determine the direction. The most common test of causality is proposed by Engel and Granger that made them receive the Nobel in 2003.
It can be said that the purpose of this test is to see if the variable Y temporally precedes the variable X or the opposite. The ultimate goal is to see if the variables X and Y interplay with each other (two ways). Mathematically, it can be written as follows:
(2)
Where: Y and X are the two of interest, Uit = error term, m = Total lag
Panel Data Analysis
Recent analysis using panel data analysis for each cluster that has been prepared. A quantitative approach was conducted to see the effect of Life Expectancy at Birth, Expected Years of Schooling, Mean Years of Schooling, GNI per Capita (2011 PPP $) on the Global Competitiveness Index in both the short and long term in ASEAN.
Approach with panel data provide some alternative models are common, fixed and random effects. Before determining the model of the approach needs to be some significance test passed the significance test models such as fixed effect (Chow Test), and a random effect significance test (Hausman test). A panel data equation of the selected model that attempts to capture the behavior of the CGI is then estimated. The equation is as follows.
LnGCIit = β0 +β1 Ln (LEB) it + β2Ln (EYS) it+β3 Ln (MYS) it+ β4 Ln (GNIC) it+ 𝑒it (3)
Where, GCI is Global Competitiveness Index, LEB is Life Expectancy at Birth, EYS is Expected Years of Schooling, MYS is Mean Years of Schooling, GNIC is GNI per Capita (2011 PPP $), β0 is Constant; β1, β 2, β3, β4 are
The regression coefficients; 𝑒it is error term; I is Country and it is Time; all variables are stated in natural logarithm.
Result and Discussion Panel Clustering Analysis
The used data is the most recent data and the most complete. Based on the clustering process, it was found that the minimum distance between cluster centers obtained from the iteration process is 7.4 and statistically significant at 5 percent level. It shows that there are differences in the variables in the clusters formed. In other words, the process of clustering successfully differentiates the value of each variable and the distinction valid. Based on the result two clusters are obtained. The cluster one has four members, and cluster two have six members. Table 4.1 presents the two clusters. The cluster one is a cluster with higher scores. The cluster two is a cluster of lower scores. While the former includes Brunei Darussalam, Malaysia, Singapore, and Thailand, the letter comprises Cambodia, Indonesia, Laos, Myanmar, the Philippines, and Vietnam.
The clustering result shows that the division of clusters generally corresponds to the characteristics of the countries. The division is into two clusters only and the analysis does not identify the characteristics to divide the countries into more varied classes. In addition to simplify the discussion, the purpose of the analysis is to maintain the availability of the number of cross-country data.
Table 4.1 Results of Clustering
Cluster 1 Cluster 2
Brunei Darussalam Cambodia
Malaysia Indonesia
Singapore Laos
Thailand Myanmar
Panel Granger Causality Analysis
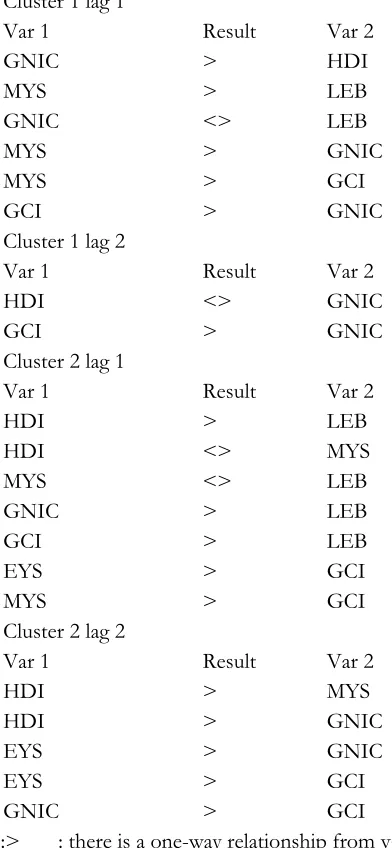
Analysis Granger causality based on the previous clustering process. Thus causality resulting panel into two. The results of the first causality was to cluster the first and second causality result is for the cluster two. Testing lag based co-integration between variables showed up on the lag of two, that is, the most well used lag is the lag of less than two. Causality test results are shown in Table 4.2. The table is a summary of the test results are more fully shown in the attachment. In the cluster one, it is found that the life expectancy at birth has a two-way relationship with Gross National Income per Capita. In developing countries that are at a take-off stage to become a developed country, life expectancy greatly affects GNI, and vice versa, GNI affects life expectancy. Another interesting finding is that the average level of education is found to influence the three variables at once, namely life expectancy, national income, and competitiveness. In a country that is moving toward a developed country, educational factors undeniably influence the development of its competitiveness.
In the cluster two a two-way relationship is found, namely between Human Development Index and the average length of school. The other two-way relationship is between the average length of schooling and life expectancy.
Table 4.2 Summary of Granger Causality Test
Cluster 1 lag 1
Var 1 Result Var 2
GNIC > HDI
MYS > LEB
GNIC <> LEB
MYS > GNIC
MYS > GCI
GCI > GNIC
Cluster 1 lag 2
Var 1 Result Var 2
HDI <> GNIC
GCI > GNIC
Cluster 2 lag 1
Var 1 Result Var 2
HDI > LEB
HDI <> MYS
MYS <> LEB
GNIC > LEB
GCI > LEB
EYS > GCI
MYS > GCI
Cluster 2 lag 2
Var 1 Result Var 2
HDI > MYS
HDI > GNIC
EYS > GNIC
EYS > GCI
GNIC > GCI
There is also a two-way relationship between Human Development Index and the average length of school, and between the average length of schooling and life expectancy. In the cluster two, it is also found that education factor, the average level of school and school expectations affect the competitiveness of nations. The findings are good on the first lag, meaning that the effect in the same year, and lag two, meaning that affect the years thereafter. In ASEAN countries proved that the maximum field of education can improve the nation's competitiveness. Other factors such as the Gross National Income per capita is only capable of affecting the competitiveness of the lag two, it shows a degree of influence cannot be perceived in the same year.
Panel Data Regression Analysis
Estimated Generalized Least Squares (EGLS) panel method makes it possible to eliminate the error specifications such as heteroscedasticity and autocorrelation (Gujarati, 2003). This section presents the analysis of panel data. The analysis uses techniques of multiple linear regression data processing with panel data EGLS.
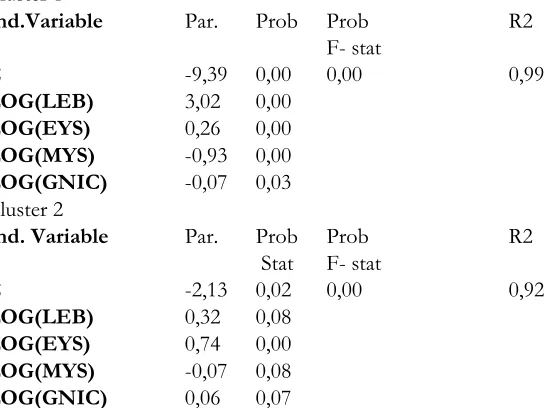
As noted earlier that the data can be estimated with a panel of three different models, namely the first model of common effect, both the fixed effect model, the three models of random effect. Selection of appropriate model requires testing that can be justified. The test results will give the conclusion model that is far from being false or biased. Data used after clustering indicates that the panel of data processing for the cluster one is not possible to use a random effect because the number of cross-section less than the number of variables. For cluster one, the significance test models indicate that the model is more suitable panel fixed effect. For cluster two, no consistency test of significance common model so that the model can be used. So, common effect model is chosen for the cluster two. In accordance with a model that is built on the chapter study method, the panel data processing results can be seen in Table 4.3.
For the cluster one all the independent variables are found to have statistically significant effects on the global competitiveness index at 5 percent level, whereas for the cluster two all the independent variables have statistically significant effects on the global competitiveness index at 5 and 10 percent levels. The hypothesis is not fulfilled for the variables MYS and GNI for the cluster one. This means that an increase in GNI tends to reduce GCI. The lack of data for some countries might be responsible for this anomalous result.
Table 4.3 Summary of Panel Data Regression
Cluster 1
Ind.Variable Par. Prob Prob
F- stat
R2
C -9,39 0,00 0,00 0,99
LOG(LEB) 3,02 0,00
LOG(EYS) 0,26 0,00
LOG(MYS) -0,93 0,00
LOG(GNIC) -0,07 0,03
Cluster 2
Ind. Variable Par. Prob
Stat
Prob F- stat
R2
C -2,13 0,02 0,00 0,92
LOG(LEB) 0,32 0,08
LOG(EYS) 0,74 0,00
LOG(MYS) -0,07 0,08
LOG(GNIC) 0,06 0,07
Furthermore, these anomalies is very possible the growth of variable value in absolute terms that have been stable. Experienced stable condition on the state of the emphasis of its own cluster. The focus of development has been diverted to the other side of humanity development. The variable EYS produces a positive impact on GCI with the elasticity of 0.25.
Variable LEB has a positive effect on GCI. The cluster one of competitiveness in most favorably affected by these variables. In the cluster one that can be said is a group of developed countries began to shift human development. Health side emphasized that the state is able to provide to the public expectations about the quality of life. Health side shown by the life expectancy is the most substantial variable that influence on the Global Competitiveness Index. Past over transformation better acceleration through the development of human health with the elasticity of 3.02. Improvement of human quality in the countries in the cluster one provides an overview of the most substantial contribution to global competitiveness
Cluster two are occupied by countries with mid-low class provides a different result. Variable LEB has a positive effect on GCI with the elasticity of 0.31. Increasing healthy life is very difficult to do in a short time in the developing countries. For a country, it took a matter of years to improve public health. People residing in cluster two countries tend to have life expectancy at birth is low. Some countries even decreased the numbers of these expectations for some time. In addition to the factors of government, other very important factor is the awareness of their own community. People also tend to have income inadequate to improve the quality of their lives. Their low personal income makes them impossible to have a special budget for health care.
The expected years of schooling, (EYS) has a positive effect on GCI with an elasticity about0.74.The positive effect of EYS is strongly experienced in developing countries. Most children show strong wills to enroll in schools. Accordingly, governments in those countries have spent a great amount of money to improve the quality of education. In some countries, they even have implanted a policy of free 9 year schooling. These policies tend have succeeded in elevating the global competitiveness of the cluster two countries.
As for the mean years of schooling (MYS), it negatively affects GCI, not as expected by the hypothesis. Improper influence is indicated to arise from the transformation of the direction of change of schooling. Some countries have average length of schooling with negative growth for several years. This decline indicates fewer people are able to attend school up to higher education. This situation has a negative impact on the global competitiveness. These negative relationships need to be reversed by further emphasizing the importance of school through public dissemination.
In addition to increased spending on education, attempts to improve literacy are more required. The national culture is a potential that can encourage people sentiment to upgrade the nation’s school participation rate. GNIC has the smallest elasticity to cluster two. In developing countries such as those in clusters of two, so is small GNI growth. No significant growth has not been able to significantly encourage global competitiveness. Therefore, the improvement of competitiveness through improving per capita GNI tends to require quite a long time. Since increased per capita income does not automatically transform into improved quality of education.
Conclusion
From the analysis, it can be concluded:
a.There is a two-way relationship between Human Development Index and Mean Years of Schooling, while Mean Years of Schooling and Expected Years of Schooling granger cause the Global Competitiveness Index and Human Development Index. It shows human development and global competitiveness of ASEAN countries in terms of educationis influenced predominantly through.
b.The panel data estimation found that every independent variable affects the dependent variable.
1.In the cluster one, Life Expectancy at Birth and Expected Years of Schooling positively affect Global Competitiveness Index, while Mean Years of Schooling and per capita GNI have negative effect on Global Competitiveness Index.
2.In the cluster two, Life Expectancy at Birth, Expected Years of Schooling, and per capita GNI positively affect Global Competitiveness Index, whereas Mean Years of Schooling negatively affect Global Competitiveness Index.
5.2.Limitations and direction for future research
Based on the findings the following, there are four suggestions concluded from this research:
b. Increased competitiveness through improving the HDI is a major aspect that needs to be supported. HDI determinant variables proved able to influence the GCI. The ASEAN countries need to improve the quality variables so that an increase in HDI, followed by an increase in GCI.
c.This study still has certain limitations, such as the data source. For further development, it is advisable to use other estimation by simultaneously extending the observations.
References
Anand, S., & Sen, A. (2000). The Income Component of the Human Development Index. Journal of Human Development and Capabilities, 1, 83-106.
Benatar, S. R., Gill, S., & Bakker, I. (2011). Global Health and the Global Economic Crisis. American Journal of Public Health, 101(4), 646-653.
Bossel, H. (1999). Indicators for Sustainable Development: Theory, Method, Applications. Winnipeg, Manitoba, Canada: the International Institute for Sustainable Development.
Cahill, M. B. (2002). Diminishing Returns to GDP and the Human Development Index. Applied Economics Letters, 9, 885-887.
Dao, M. Q. (2011). Changes in Human Development in Developing Countries: an Empirical Assessment. Perspective on Global Development and Technology, 10, 288-299.
Donaubauer, J., Meyer, B. E., & Nunnenkamp, P. (2016). A New Global Index of Infrastructure: Construction, Rankings and Applications. The World Economy Journal, 236-257.
E-Governance Development. (2010). Global Competitiveness Index Shows Switzerland Leading. Journal of E-Governance, 33, 21-24.
Engineer, M., & King, I. (2013). Maximizing Human Development. Canadian Journal of Economics, 46(2), 497-525. Gujarati, D. N. (2003). Basic Econometric (4th ed.). New York: McGraw-Hill.
Haar, L. N. (2014). Do Patterns of Trade and International Competitiveness Support the Case for Industrial Policy? Journal of Policy Studies, 35(3), 221-245.
Jogwu, O. (2004). Adult Illiteracy: the Root of African Underdevelopment. Journal of Education, 130(3), 490-498. Kadarusman, Y., & Nadvi, K. (2013). Competitiveness and Technological Upgrading in Global Value Chains:
Evidence from the Indonesian Electronics and Garment Sectors. European Planning Studies, 21(7), 1007-1028. Khodabakhshi, A. (2011). Relationship between GDP and Human Development Indices in India. International Journal
of Trade, Economics and Finance, 251-254.
Labutkova, S., Bednarova, P., & Valentova, V. H. (2016). Economic Inequalities and the Level of Decentralization in European Countries: Cluster Analysis. Comparative Economic Research, 19, 28-46.
Lechman, E. (2014). Changing Patterns in the Export of Goods versus International Competitiveness. A Comparative Analysis for Central-East European Countries in the Period 2000-2011. Comparative Economic Research, 17(2), 62-77.
Lee, C. (2010). An Institutional Perspective of National Competitiveness. The Singapore Economic Review, 55(4), 671-683. Lerner, R. M. (2001). Concepts and Theories of Human Development. New Jersey: Lawrence Erlbaum Associates. Martinez, R. (2012). Inequality and the New Human Development Index. Applied Economics Letter Journal, 19, 533-535. Sabadie, J., & Johansen, J. (2010). How Do National Economic Competitiveness Indices View Human Capital?
European Journal of Education, 45(2), 236-257.
Sabatini, F. (2008). Social Capital and the Quality of Economic Development. KYKLOS, 61(3), 466-499.
Smith, W., & L, D. (2007). Emerging Economies Coming on Strong. Journal of Issues in Science and Technology, 85-89. Thomas, G., & Naude, W. (2011). Entrepreneurship and human development: a capability approach. Journal of Public
Economics, 95(3-4), 216-224.