The Thirty-Third AAAI Conference on Artificial Intelligence (AAAI-19)
Visual-Semantic Graph Reasoning for Pedestrian Attribute Recognition
Qiaozhe Li,
1,3Xin Zhao,
1,3Ran He,
2,3,4Kaiqi Huang
1,3,41CRISE, CASIA,2CRIPAC & NLPR, CASIA
3University of Chinese Academy of Sciences
4CAS Center for Excellence in Brain Science and Intelligence Technology
[email protected],{xzhao,rhe,kqhuang}@nlpr.ia.ac.cn
Abstract
Pedestrian attribute recognition in surveillance is a chal-lenging task due to poor image quality, significant appear-ance variations and diverse spatial distribution of different attributes. This paper treats pedestrian attribute recognition as a sequential attribute prediction problem and proposes a novel visual-semantic graph reasoning framework to address this problem. Our framework contains a spatial graph and a directed semantic graph. By performing reasoning using the Graph Convolutional Network (GCN), one graph captures spatial relations between regions and the other learns poten-tial semantic relations between attributes. An end-to-end ar-chitecture is presented to perform mutual embedding between these two graphs to guide the relational learning for each other. We verify the proposed framework on three large scale pedestrian attribute datasets including PETA, RAP, and PA-100k. Experiments show superiority of the proposed method over state-of-the-art methods and effectiveness of our joint GCN structures for sequential attribute prediction.
Introduction
Pedestrian attribute recognition aims to make prediction of a set of attributes as the semantic descriptions of a pedestrian image. It has recently drawn a remarkable amount of atten-tions due to its promising applicaatten-tions in face verification (Kumar et al. 2009), person retrieval (Siddiquie, Feris, and Davis 2011), and person re-identification (Layne et al. 2012; Wang et al. 2018). Although it’s easy to state, however, rec-ognizing pedestrian attributes in real-world surveillance sce-narios can be extremely challenging due to three factors: (1) Some attributes only relate to a small part of regions, which could be affected by ambiguous details caused by limited image resolution; (2) The appearance of pedestrian images is diversified caused by pose variation, viewpoint change, oc-clusion, background distraction, etc., which make it difficult to learn reliable image representations; (3) A pedestrian im-age usually contains multiple correlated attributes and each attribute may locate at different part regions according to its semantic characteristics. All these factors make it difficult to learn an effective attribute recognition model.
To deal with the above mentioned problems, it’s desir-able to jointly explore the spatial and semantic relations
Copyright c2019, Association for the Advancement of Artificial Intelligence (www.aaai.org). All rights reserved.
of attributes. However, such relations have not been fully exploited in traditional methods. Earlier methods solve the attribute recognition problem by learning a separate bi-nary classifier for each of the attributes (Deng et al. 2014; Sudowe, Spitzer, and Leibe 2015). In such way, the re-lationships between attributes are simply ignored. To as-sociate attributes with their corresponding regions, some methods employ auxiliary pose or part supervision infor-mation to learn part-based models (Zhang et al. 2014; Li et al. 2016c) and others formulate recognition as a weakly supervised localization problem using attention mechanism (Liu et al. 2017b; Zhu et al. 2017; Sarafianos and Kakadiaris 2018). While better recognition accuracy can be achieved with spatial context learning, these methods fail to capture semantic relations of attributes.
To model attribute relations at semantic level, some meth-ods employ probabilistic graphical models (Chen, Gal-lagher, and Girod 2012) or structured inference models (Hu et al. 2016). Based on statistical hand-crafted features or a holistic deep representation model, these methods fail to consider spatial distribution of different attributes. The recognition task can also be formulated as a sequential pre-diction process by adopting sequential encoder-decoder ar-chitecture (Wang et al. 2017) to model the high-order de-pendencies among attributes. Although benefiting from the sequential prediction framework, the pairwise relations be-tween attributes may not be described. Besides, the encoder-decoder model is deep considering RNN unrolling, which is difficult to optimize as the length of prediction sequence increases.
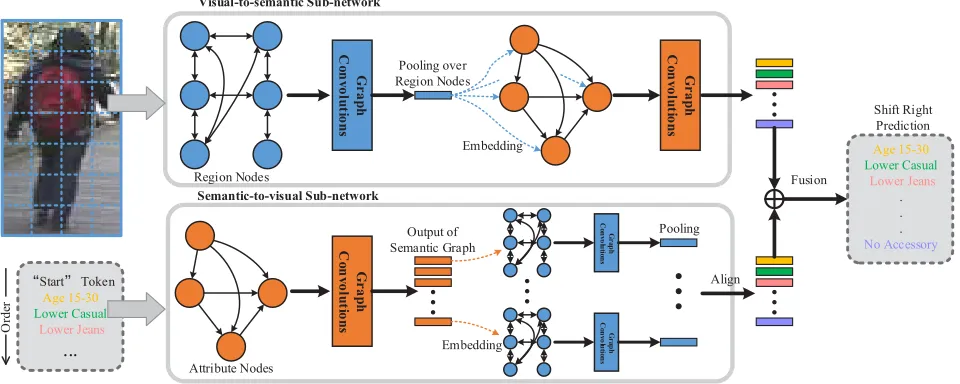
the two graphs are mutually embedded as additional inputs to guide the relational learning for each other. It’s achieved by two sub-networks, which decompose the mutual embed-ding into two separate feed-forward streams to avoid the existence of closed loops. In the first sub-network, the spa-tial graph is first introduced to capture similarity and topo-logical relations between image regions. The spatial con-text representation, which is obtained by performing aver-age pooling over the outputs of all region nodes, is then em-bedded into semantic space to guide relational learning be-tween attributes on the directed semantic graph. In the sec-ond sub-network, a directed semantic graph is first adopted to model semantic dependencies of attributes along the pre-diction path. The output of each attribute node is embed-ded into spatial graph to perform semantic-aware feature learning for next attribute. The two sub-networks are ag-gregated together to perform joint spatial and semantic re-lational learning for sequential attribute recognition.
The contributions of this paper are: (1) A visual-semantic graph reasoning framework is proposed to jointly model spa-tial and semantic relations for sequenspa-tial pedestrian attribute prediction. (2) A novel end-to-end architecture is presented based on spatial and semantic graphs, which not only cap-ture spatial relations between regions and potential seman-tic relations between attributes by performing graph convo-lutions inside each graph, but also model the relations be-tween regions and attributes by performing mutual embed-ding between the two graphs to guide the relational learning for each other. (3) The proposed method is evaluated on 3 large-scale pedestrian attribute benchmarks including PETA (Deng et al. 2014), RAP (Li et al. 2016a) and PA-100k (Liu et al. 2017b). Experiments show superiority of the proposed method over state-of-the-art methods and effectiveness of our joint GCN structures for sequential attribute prediction.
Related Work
Pedestrian Attribute Recognition
Pedestrian attribute has been applied in a variety of vision tasks (Layne et al. 2012; Jaha and Nixon 2014; Wang et al. 2018). Earlier pedestrian attribute models (Zhu et al. 2013; Deng et al. 2014) treated multiple attributes independently and trained a sperate classifier for each of the attributes. Later, CNNs have been introduced for image feature learn-ing and joint multi-attribute classification (Sudowe, Spitzer, and Leibe 2015; Li, Chen, and Huang 2015). These deep methods are based on holistic image representations, and may have limited capability to recognize attributes covering fine-grained details. Motivated by part-based models (Bour-dev, Maji, and Malik 2011), (Zhang et al. 2014) and (Li et al. 2016c) employed body-part detectors for feature representa-tions to recognize human attributes. However, the part detec-tors trained with auxiliary images make strong assumptions on image qualities, which may introduce additional noise when applied in surveillance data. Some methods formu-late attribute recognition as a weakly supervised localization problem using attention mechanism. (Liu et al. 2017b) pro-posed multi-directional attention modules to learn attention-strengthened features at multiple levels and scales.
(Sarafi-anos and Kakadiaris 2018) extended the work of (Zhu et al. 2017) by adding penalties on attention masks which have high prediction variance and introducing a weighted loss function for an attention aggregation model. Although recognition accuracy has been significantly improved, the generated attention masks are regularized by typical con-volution operations, which make the semantic relations be-tween attributes less interpretable.
On the other hand, semantic relations between attributes have also been studied. (Chen, Gallagher, and Girod 2012) explored the mutual dependencies between cloth attributes using the Conditional Random Fields (CRFs). However, such graphical inference model fails to take spatial context into consideration, thus may not be able to describe the un-derlying spatial relations between attributes. Moreover, the attribute classifiers and CRF are optimized separately in-stead of being unified into an end-to-end inference model. Motivated by recent success of sequential multi-label pre-diction models (Wang et al. 2016; Liu et al. 2017a), (Wang et al. 2017) proposed a RNN encoder-decoder based frame-work to jointly learn image level context and attribute level sequential correlation. As the RNN encoder-decoder mainly characterizes high-order dependencies of attributes, the pair-wise relations may not be described.
Graphical Models
Reasoning on pairwise relations has been proved to be ben-eficial to a variety of vision tasks including object recogni-tion (Gkioxari et al. 2018; Chen et al. 2018), video under-standing (Ma et al. 2018), and action recognition (Gkioxari, Girshick, and Malik 2015). In multi-label image classifica-tion problem, CRF is often applied to model the dependen-cies between multiple labels (Xue et al. 2011; Li, Zhao, and Guo 2014; Li et al. 2016b). However, these methods also fail to explore label relations in spatial layout. Instead of per-forming iterative mean-field approximation, simpler graph-based neural networks (Scarselli et al. 2009; Li et al. 2015; Marino, Salakhutdinov, and Gupta 2017) have been pro-posed to unify the inference procedure into an end-to-end model. In this paper, the Graph Convolutional Network (GCN) (Kipf and Welling 2017), which was originally pro-posed to perform semi-supervised classification in language processing, is utilized for relational reasoning. The GCN serves as basic layers for the proposed framework to jointly model the spatial and semantic relations between pedestrian attributes.
Approach
ćStartĈ Token Age 15-30
Lower Casual Lower Jeans
...
G
r
a
p
h
C
o
n
v
o
lu
tio
n
s
G
r
a
p
h
C
o
n
v
o
lu
tio
n
s
G
r
a
p
h
C
o
n
v
o
lu
tio
n
s
G
ra
p
h
C
on
vo
lu
tio
n
s
G
ra
p
h
C
on
vo
lu
tio
n
s
Fusion Region Nodes
Attribute Nodes
Embedding
Pooling
Align Semantic-to-visual Sub-network
Pooling over Region Nodes
Output of Semantic Graph
Embedding Age 15-30
Lower Casual Lower Jeans
. . .
No Accessory
Visual-to-semantic Sub-network
Shift Right Prediction
O
rd
er
Figure 1: Overview of the proposed visual-semantic graph reasoning framework. It consists of two sub-networks, which perform mutual embedding between the spatial and semantic graphs in complementary ways to achieve joint visual-semantic reasoning.
Graph Convolutional Network
The Graph Convolutional Network (GCN) is proposed to perform reasoning on graphs. Unlike standard convolutions which operate on a local regular grid, the graph convolutions compute the response of a node based on its neighbors de-fined by the graph relations. Thus, message passing is per-formed inside the graphs with the graph convolutions. Let
Z∈RN×ddenotes the input features of the graph, whereN
denotes the number of entities,dis the number of the feature
channels. Mathematically, graph convolutions for one layer can be represented as:
G=AZW (1)
whereA ∈ RN×N represents the adjacency matrix of the
graph, which can either be pre-defined or learned from data.
W is the weight matrix of the layer. To achieve effective
training, two non-linear operations including Layer Normal-ization (Ba, Kiros, and Hinton 2016) and ReLU activation are usually applied after each convolutional layer before the features are forwarded to the next layer.
Visual-semantic Graph Reasoning
Given a pedestrian imageI, our goal is to make prediction of
its attributesy1, ...,yK. It’s intrinsically a multi-label
clas-sification problem since a pedestrian image can be annotated by multiple attributes. Since attribute recognition is formu-lated as a sequential prediction problem, the joint probability
overy1, ...,yK can be modeled in the chain rule as,
P(y1, ...,yK|I) = K Y
k=1
P(yk|I,y0, ...,yk−1) (2)
In our framework, the relations between image regions are modeled on a spatial graph and the dependencies between attributes are modeled on a semantic graph with directed edges. The joint reasoning is performed in a mutually guided
way with two sub-networks, which will be introduced in de-tails in the following.
Visual-to-semantic Sub-network. In this sub-network,
the spatial graph is first used to learn image feature repre-sentations to capture spatial relations between different body parts of the whole pedestrian image. The learned spatial con-text is then embedded into semantic space to guide relational learning between attributes on the directed semantic graph. In spatial graph, each node corresponds to one specific im-age part region and the relations between regions are mod-eled by edges. Two types of spatial relations including simi-larity relations and topological relations are described. They are respectively modeled by two sub-graphs, which share the nodes but employ different edges.
The first sub-graph measures visual similarity in image feature space. Assuming that the input of the spatial graph
X = (x1,x2, ...,xM)T consists of the visual features
ex-tracted from a convolutional neural network, whereM
de-notes the number of locations of the convolutional feature
maps andxicorresponds toi-th image region. The pairwise
similarity between every two part regions can be computed by the function,
Fs(xi,xj) =ϕs(xi)Tϕ0s(xj) (3)
whereϕs(x) =wsxandϕ0s(x) =w0sxdenote two different linear transformations of the visual features. The weight
ma-tricesws ∈Rd×dandw0s ∈Rd×dcan be learned through
back propagation. After being computed using Eq.(3), the similarity adjacency matrix is normalized using a softmax function along each row,
Asa(i, j) =
exp(Fs(xi,xj)) PM
j=1exp(Fs(xi,xj))
(4)
with its neighbor regions. The edge values capturing the topological relations between body parts can be computed as,
Asl(i, j) =
exp(−dij/∆) PM
j=1exp(−dij/∆)
(5)
where dij denotes pixel-level distance between the two
parts, and∆is the scaling factor. Softmax is also performed
as normalization on each row so that the sum of all edge weights connected to one part is 1.
With the edge weights of both sub-graphs, the outputs of the spatial graph are computed by combining the two sub-graphs together,
Gs=AsaXWsa+AslXWsl (6)
whereWsa ∈R
d×d andW sl ∈R
d×dare weight matrices
for two sub-graphs. After convolution operations, average pooling is performed over all nodes of spatial graph to obtain
the spatial context representationgs∈Rd.
Conditioned on spatial context, the directed semantic graph is employed to perform relational learning in semantic space. In this graph, each node corresponds to one specific
semantic attribute. Given a pedestrian image, we useR =
(r0,r1, ...,rK) ∈ Rf×(K+1) to denote the embedding
ma-trix of its ground-truth semantic attributes aligned according
to a prediction order, where each columnri ∈Rf is an
em-bedding vector andr0 denotes the “start” token. To make
use of order information, positional encoding (Gehring et al. 2017) is performed by embedding the absolute position
of attributes P = (p0,p1, ...,pK) ∈ Rf×(K+1), where
pi ∈ Rf. They are combined together to obtain
seman-tic attribute representations on an ordered prediction path
E = (e0,e1, ...,eK) ∈ Rf×(K+1), whereek = rk+pk.
Further, spatial context is embedded into each node by the function,
C=E⊕(Usgs) (7)
whereUs∈Rf×ddenotes the learnable projection matrix.
⊕operation is computed by adding the embedding vector
to each column of matrixE. Thei-th columnci ∈ Rf of
C ∈Rf×(K+1)is the input representation ofi-th node. To
ensure the prediction of current attribute only has relations
with previously known outputs, thei-th node is only
con-nected with nodes whose subscript≤i. For those connected
edges, the edge weights can be computed as,
Fˆe(ci,cj) =ϕˆe(ci)Tϕ0ˆe(cj) (8)
whereϕˆe(·) andϕ0ˆe(·) are linear transformation functions
with weight matriceswˆe ∈ Rf×f andw0eˆ ∈ Rf×f.
Simi-larly,Aeˆ∈R(K+1)×(K+1)is also computed by normalizing
the connected edge weights along each row, and its upper triangular elements will be 0. The convolutions on semantic graph can be represented as,
Gˆe=AeˆCTWeˆ (9)
whereWeˆ∈Rf×fdenotes the weight matrix.
After performing convolutions on semantic graph, the
output representationsGˆe∈R(K+1)×fare used for
sequen-tial attribute prediction. The output supervision is obtained by right shifting the input sequence by one position, which
means the output ofk-th nodegk
ˆ
e ∈ Rf is used to predict
(k+1)-th attribute according to the prediction order.
Semantic-to-visual Sub-network. In this sub-network,
the directed semantic graph is first adopted to capture se-mantic relations between attributes. At each prediction step, the output of current attribute node is embedded into spatial graph to perform semantic-aware feature learning to predict the next attribute. In this sub-network, attribute nodes are
represented by E = (e0,e1, ...,eK) ∈ Rf×(K+1) and its
edge values can be computed as,
Fe(ei,ej) =ϕe(ei)Tϕ0e(ej) (10)
where the weights of functions ϕe(·)andϕ0e(·)are
differ-ent from Eq.(8). Similarly, currdiffer-ent attribute is only con-nected with previous existed attributes in the adjacency
ma-trix. After obtaining the normalized adjacency matrixAe∈
R(K+1)×(K+1), the convolution operations can be
repre-sented as,
Ge=AeETWe (11)
where We ∈ Rf×f denotes the weight matrix. Ge ∈
R(K+1)×f are outputs of the attribute nodes, in which each
row gk
e ∈ Rf denotes the semantic representation at k-th
step.
The learned semantic representation is embedded into each region node of the spatial graph. Thus, the input
rep-resentations of region nodes atk-th prediction step can be
computed as,
Dk =X⊕(Uegke)
T (12)
whereUe ∈Rd×f is used to projectgke into image feature
space. The edge values capturing the similarity between re-gion nodes can be represented as,
Fkˆs(dki,dkj) =ϕˆs(dki)
Tϕ0
ˆ
s(d k
j) (13)
wheredki ∈ Rd isi-th row ofDkrepresenting thei-th
im-age region embedded with current semantic representation. In such way, visual features related to different attributes can be extracted by learning different relations between regions guided by semantic context. The weight matrices of func-tionsϕˆs(·)andϕ0ˆs(·)are shared across entire sequential pre-diction process in consideration of computation efficiency. The convolution operations on spatial graph can be repre-sented as,
Gksˆ=AksˆaDkWˆsa+AslD
kW
ˆ
sl (14)
where the first term characterizes similarity relations be-tween regions guided by semantic context. In second term,
the adjacency matrixAslremains unchanged to preserve the
topological structure. After convolution operations, average
pooling is performed over all region nodes ofGk
ˆ
s to obtain
the representationgkˆs ∈Rdatk-th step. TotallyK+1
repre-sentationsg1
ˆ
s, ...,g K+1 ˆ
s can be obtained by embedding each
Training and Inference
The two sub-networks are unified into an end-to-end model to jointly perform visual-semantic graph-based reasoning. At each prediction step, the current output representations of the two sub-networks are concatenated together to pre-dict the next attribute. The output supervision is obtained by right shifting the ground-truth attributes aligned according to the pre-defined prediction order and adding an additional “end” token at the last position. The conditional probability
atk-th predication step can be represented by,
P(yk|I,y0, ...,yk−1)∝exp(Wy
gkeˆ−1 gksˆ−1
) (15)
whereWy ∈ R(C+1)×(d+f)is the weight matrix andC is
the total number of attributes.
The entire network is trained with BCE loss after nor-malizing the probability scores with softmax function. Dur-ing the trainDur-ing process, the computation of output repre-sentations and back-propagation can be parallelized across all nodes in the graph, which is in contrast with traditional RNN encoder-decoder based methods which perform infor-mation propagation through the entire long-range sequences. To boost the performance of sequential prediction meth-ods, some policies have been proposed to explore prediction paths, such as beam search (Wang et al. 2016) and order en-semble (Wang et al. 2017). In this paper, the later scheme is adopted since it shows more reliable results compared with the former. Besides, the prediction orders are also defined similar as (Wang et al. 2017).
In the testing stage, the proposed model performs sequen-tial multi-attribute prediction given each pedestrian image. At each prediction step, current attribute is predicted
condi-tioned on visual information of imageIand previously
pre-dicted attributesy∗k= arg maxP(yk|I,y0, ...,yk−1). Once predicted, current attribute is added as nodes in the seman-tic graph and used for next prediction. This procedure is re-peated until the “end” token is met or the model reaches its maximum prediction length.
Experiments
Datasets. The proposed method is evaluated on three
pub-licly available pedestrian attribute datasets: (1) The PEdes-Trian Attribute (PETA) dataset (Deng et al. 2014) con-sists of 19, 000 person images collected from 10 small-scale person datasets. Each image is labelled with 61 bi-nary attributes and 4 multi-class attributes. This paper fol-lows the same experimental protocal as (Deng et al. 2014; 2015). The whole dataset is randomly divided into three non-overlapping partitions: 9500 for training, 1900 for ver-ification, and 7600 for evaluation. 35 attributes whose pos-itive ratios are higher than 5% are used for evaluation. (2) The Richly Annotated Pedestrian (RAP) attribute dataset (Li et al. 2016a) contains 41,585 images drawn from 26 indoor surveillance cameras. Each image is labelled with 69 binary attributes and 3 multi-class attributes. Following the official protocol (Li et al. 2016a), the whole dataset is split into 33,268 training images and 8,317 test images.
Dataset Method Metric
mA Acc Pre Recall F1
PETA
MRFr2 75.60 - - - -ELF-mm 75.21 43.68 49.45 74.24 59.36 FC7-mm 76.65 45.41 51.33 75.14 61.00 FC6-mm 77.69 48.31 54.06 76.49 63.35 ACN 81.15 73.66 84.06 81.26 82.64 Deep-Mar 82.89 75.07 83.68 83.14 83.41 HP-net 81.77 76.13 84.92 83.24 84.07
JRL 85.67 - 86.03 85.34 85.42
VeSPA 83.45 77.73 86.18 84.81 85.49 MsVAA 84.59 78.56 86.79 86.12 86.46 Ours 85.21 81.82 88.43 88.42 88.42
RAP
MRFr2 - - - - -ELF-mm 69.94 29.29 32.84 71.18 44.95 FC7-mm 72.28 31.72 35.75 71.78 47.73 FC6-mm 73.32 33.37 37.57 73.23 49.66 ACN 69.66 62.61 80.12 72.26 75.98 Deep-Mar 73.79 62.02 74.92 76.21 75.56 HP-net 76.12 65.39 77.33 78.79 78.05 JRL 77.81 - 78.11 78.98 78.58 VeSPA 77.70 67.35 79.51 79.67 79.59 MsVAA - - - -
-Ours 77.91 70.04 82.05 80.64 81.34
PA100k
Deep-Mar 72.70 70.39 82.24 80.42 81.32 HP-net 74.21 72.19 82.97 82.09 82.53
Ours 79.52 80.58 89.40 87.15 88.26
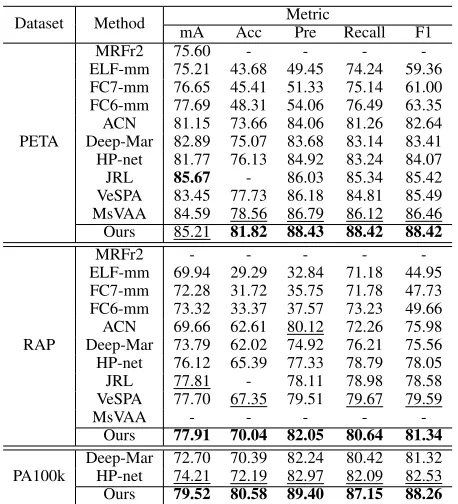
Table 1: Comparisons against 10 state-of-the-art methods on
three datasets. 1st and 2nd best results in bold fonts and
underlined, respectively.
51 binary attributes are used to evaluate the recognition performance. (3) The PA-100k Dataset (Liu et al. 2017b) consists of 100,000 pedestrian images from 598 outdoor scenes. Each image is described with 26 commonly used at-tributes. The whole dataset is split into training, validation and test sets with a ratio of 8:1:1 (Liu et al. 2017b). For both PETA and RAP datasets, the multi-class attributes are con-verted into binary attributes as in (Deng et al. 2014; 2015; Li et al. 2016a).
Performance Metrics. Five metrics are adopted to
evalu-ate attribute recognition performance. (1) Class-based: For each attribute class, the classification accuracy of positive and negative samples are computed respectively and then averaged as the recognition score for this attribute. mA is then computed by averaging the recognition scores over all attributes (Deng et al. 2014). (2) Instance-based: Ac-curacy, precision, recall and F1-score are used to measure instance-based (Li et al. 2016a) attribute recognition re-sults. For accuracy, precision and recall, we first compute the scores of predicted attributes against the groundtruth for each test image and then average the scores over all test images. The F1-score is computed based on precision and recall. Different from mA that assume independence be-tween attributes, instance-based evaluation metrics consider the inter-attribute correlation.
Compared Methods. The proposed method is compared
personalLarger60accessoryMuffler personalMaleaccessoryHat
hairLong
footwearLeatherShoesupperBodyShortSleeve lowerBodyJeanspersonalLess30upperBodyOther
lowerBodyTrouserscarryingNothinglowerBodyFormalupperBodyFormalcarryingBackpackpersonalLess60personalLess45accessoryNothing lowerBodyShortSkirt
carryingMessengerBag lowerBodyCasualupperBodyPlaidupperBodyCasual
carryingPlasticBagslowerBodyShortsfootwearSneakersupperBodyTshirt footwearShoescarryingOther
upperBodyJacket upperBodyThinStripes
footwearSandalsupperBodyLogoupperBodyVNeck accessorySunglasses
mA
0.5 0.6 0.7 0.8 0.9
1 PETA
ResNet-50 Ours
Female shoes-Bootshs-LongHair
Clerk lb-Jeans
lb-TightTrouserslb-LongTrousers ub-VestCustomerub-Shirt
action-Callingshoes-Leather lb-Skirt action-Pusinghs-Glasses
lb-Dress
action-CarrybyHand ub-Jacket
attach-HandTrunk ub-Cotton
attach-SingleShoulderBag attach-Backpack
hs-Hat
attach-HandBaghs-BlackHair shoes-Clothattach-Otherlb-ShortSkirtAgeLess16ub-TShirtshoes-Sportattach-Boxub-SuitUp
ub-ShortSleevehs-BaldHead Age17-30
attach-PlasticBag action-Pulling
Age31-45 attach-PaperBag
ub-Tight ub-Sweatershoes-Casualhs-MufflerBodyFat
action-CarrybyArm action-Holding
action-Gathering BodyNormalaction-TalkingBodyThin
mA
0.5 0.6 0.7 0.8 0.9
1 RAP
ResNet-50 Ours
Back LongSleeve
Female ShortSleeve
Shorts Trousers
Front UpperStrideUpperSplice
Side Glasses
Skirt&DressUpperLogoLowerStripeBackpackUpperPlaidAgeOver60HandBagShoulderBagLongCoatLowerPattern Age18-60
Hat
AgeLess18 boots
HoldObjectsInFront
mA
0.5 0.6 0.7 0.8 0.9 1
PA-100k
ResNet-50 Ours
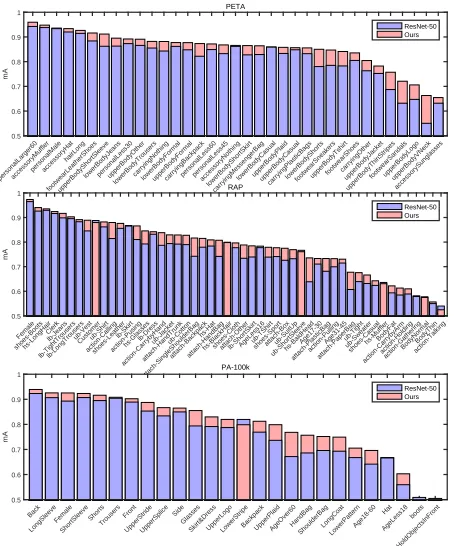
Figure 2: Mean Accuracy (mA) for all attributes on three datasets. Baseline and our method are marked with blue and red bars respectively.
proximity relations between different images; (2) ELF-mm (Gray and Tao 2008) employs SVM classifier with En-semble of Localized Features (ELF) for attribute recogni-tion; (3)-(4) FC7-mm and FC6-mm replace the hand-crafted ELF features with CNN features (FC7 and FC6 output of the AlexNet); (5) Attributes Convolutional Network (ACN) (Sudowe, Spitzer, and Leibe 2015) jointly trains a mono-lithic CNN model for all attributes, which allows to share weights and transfer knowledge among different attributes; (6) DeepMAR (Li, Chen, and Huang 2015) is a joint at-tribute learning model which considers inter-atat-tribute cor-relation by weighted cross entropy loss function; (7) Hy-draPlus Network (HP-net) (Liu et al. 2017b) is an tion based method that employs multi-directional atten-tion modules to train multi-level and multi-scale attenatten-tion- attention-strengthened features for pedestrian analysis; (8) Joint Re-current Learning (JRL) model (Wang et al. 2017) consid-ers attribute recognition as a sequence-to-sequence mapping problem and employs RNN encoder-decoder to jointly learn image level context and attribute level sequential correlation. (9) View-sensitive Pedestrian Attribute (VeSPA) model (Sar-fraz et al. 2017) jointly learns a coarse view predictor and view-dependent image features for attribute inference. (10) MsVAA (Sarafianos and Kakadiaris 2018) is based on vi-sual attention aggregation on multi-scales, combined with additional penalties on attention masks and a weighted loss function.
Implementation Details. In this paper, ResNet-50 is used to extract convolutional features for pedestrian images. The
Dataset Method Metric
mA Acc Pre Recall F1
PETA
ResNet-50 81.27 76.69 87.33 82.76 84.99 Gs 81.65 76.80 87.94 83.44 85.63
Ge 83.85 79.65 87.05 86.09 86.56
Gs→e 84.96 81.10 87.91 87.84 87.87
Ge→s 84.32 80.92 87.63 86.76 87.19
Ours 85.21 81.82 88.43 88.42 88.42
RAP
ResNet-50 75.12 66.67 81.66 76.52 79.00 Gs 75.54 67.35 81.34 76.37 78.78
Ge 75.95 68.74 80.94 78.63 79.76
Gs→e 76.86 69.57 80.93 79.54 80.23
Ge→s 76.54 69.76 80.86 79.04 79.94
Ours 77.91 70.04 82.05 80.64 81.34
PA100k
ResNet-50 76.31 76.76 88.62 83.22 85.84 Gs 77.05 76.82 88.75 83.45 86.02
Ge 78.54 78.93 88.45 86.41 87.42
Gs→e 79.03 79.54 88.87 86.75 87.80
Ge→s 78.54 78.95 88.53 86.18 87.34
Ours 79.52 80.58 89.40 87.15 88.26
Table 2: Effect of each component of the proposed network.
1stand 2ndbest results inboldfonts and underlined.
output of last convolutional layer (output of “Res 5c” block) is used as the visual input to spatial graph. The original
pedestrian images are resized to 128×256 pixels.
Stochas-tic gradient descend algorithm (Sutskever et al. 2013) is em-ployed for training, with momentum of 0.9, and weight de-cay of 0.0005. The batch size is set to 32. The initial learning
rate is set to10−3for the first 20 epoches, and decreased to
10−4for the second 20 epoches. The model is implemented
with pytorch.
Comparison to the State-of-the-Arts
Table 1 shows evaluations on three datasets. The proposed method shows the best performance on all three datasets measured by five evaluation metrics, except it achieves second best score in mA on PETA dataset. Though JRL model reports a minor gain in mA on PETA dataset, how-ever, our method outperforms JRL in precision, recall and
F1-score with a significant margin (2.40%, 3.08%, and
3.00%, respectively). MsVAA method has achieved
sec-ond best scores on 4 instance-based metrics, despite adopt-ing a stronger ResNet-101 baseline. On RAP dataset, ACN model presents the second best score in precision but with a much lower recall. It indicates that ACN tends to miss some attributes in recognition by simply adopting a holis-tic representation model. In contrast, the proposed method achieves significant improvement on all instance-based met-rics due to the visual-semantic graph-based reasoning. JRL and VeSPA show competitive results on this dataset. On PA-100k dataset, the proposed method has achieved greater per-formance improvement. It further demonstrates the effec-tiveness of the proposed method in modelling the spatial and semantic relations of attributes on graphs.
Ablation Study
Quantitative Evaluation. Besides the comparison with
pro-PETA
RAP
PA-100k
Groundtruth: Age31-45, BodyNormal, Customer,hs-BlackH air, ub-Jacket, lb-LongTrousers, shoes-Leather, attach-HandTrunk, attach-Other, action-Pulling
ResNet-50: Age31-45, Customer, hs-BlackH air, ub-Jacket, lb-LongTrousers,shoes-Casual,attach-Other,
action-CarrybyHand(True: 6, False: 2, Miss: 4)
Ours: Age31-45, BodyNormal, Customer, hs-BlackH air, ub-Jacket, lb-LongTrousers, shoes-Leather, attach-HandTrunk, action-Pulling (True: 9, False: 0, Miss: 1)
Groundtruth: Age 30-45, Lower Casual, Upper Casual, Upper Jacket, Leather Shoes, Male, No Accessory, Lower Trousers
ResNet-50:Age 30-45,Carrying Backpack, Lower Casual, Upper Casual, Male, No Accessory, Lower
Trousers,Upper Other (True: 6, False: 2, Miss: 2)
Ours: Age 30-45, Lower Casual, Upper Casual,
Leather Shoes, Male, No Accessory, Lower
Trousers (True: 7, False: 0, Miss: 1)
Groundtruth: Female, Age17-30, BodyNormal, Customer, hs-LongHair, hs-BlackH air, ub-Cotton, lb-TightTrousers, shoes-Sport, attach-Other, action-Calling
ResNet-50:Female, Age17-30,BodyThin, Customer, hs-LongHair, hs-BlackH air, ub-Cotton, lb-TightTrousers,shoes-Boots (True:7, False: 2, Miss: 4) Ours: Female, Age17-30, BodyNormal, Customer, hs-LongHair, hs-BlackH air, ub-Cotton,lb-LongTrousers,
lb-TightTrousers, shoes-Sport, attach-Other, action-Calling (True: 11, False: 1, Miss: 0) Groundtruth: Age 15-30, Carrying Backpack, Lower
Casual, Upper Casual, Male, No Accessory, Lower Shorts, Upper ShortSleeve, Sneakers, Upper Tshirt
ResNet-50: Age 15-30, Lower Casual, Upper Casual, No Accessory, Upper ShortSleeve(True: 5, False: 0, Miss: 5)
Ours: Age 15-30, Carrying Backpack, Lower Casual, Upper Casual, Male, No Accessory, Lower Shorts, Upper ShortSleeve, Sneakers, Upper Tshirt (True: 10, False: 0, Miss: 0)
Groundtruth: Age18-60, Side, Glasses, Backpack, LongSleeve, UpperSplice, Trousers
ResNet-50:Female,Age18-60, Side, LongSleeve,
Trousers (True: 4, False: 1, Miss: 3)
Ours: Age18-60, Side, Glasses, Backpack,
LongSleeve, UpperSplice, Trousers (True: 7, False:
0, Miss: 0)
Groundtruth:Female, Age18-60, Back, HandBag, LongSleeve, UpperStride, Trousers
ResNet-50:Female, Age18-60, Back, HandBag, ShoulderBag, ShortSleeve, Trousers (True: 5, False: 2, Miss: 2)
Ours:Female, Age18-60, Back, HandBag,
LongSleeve, UpperStride, Trousers (True: 7, False:
0, Miss: 0)
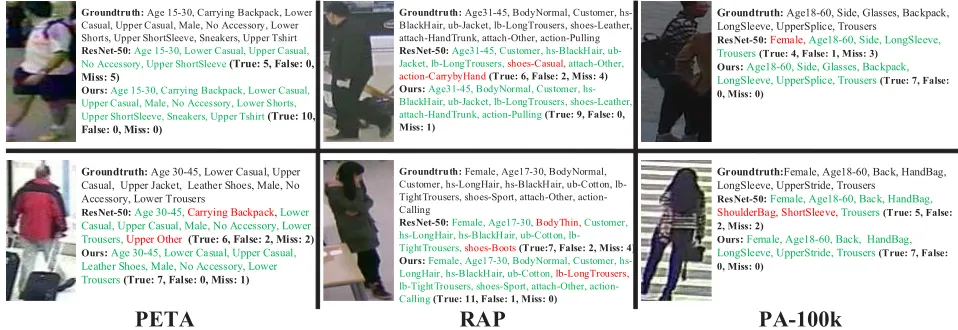
Figure 3: Qualitative evaluation of some pedestrian images from three datasets. The correct and wrong predictions are marked in green and red, respectively.
posed network, which is shown in Table 2. (1) The origi-nal ResNet-50 is used as the baseline which is fine-tuned on each of the datasets. (2) A spatial graph is added on top of the final convolutional layer of ResNet-50 to explore the spatial relations between different image regions. The out-put representation of spatial graph is then average-pooled and followed by a classification layer. (3) A directed seman-tic graph is adopted to model semanseman-tic dependencies be-tween attributes during training, which directly use ResNet-50 FC features as visual input. (4)-(5) Each of the two sub-networks is used to perform attribute recognition inde-pendently. These models are compared with the proposed method in the same experimental settings.
Fig.2 reports the overlapped histograms of mean Accu-racy (mA) on all three datasets for all attributes by baseline ResNet-50 model and the proposed method. The bars are sorted in descending order according to the larger mA be-tween the two methods at one attribute. It is evident that the proposed method has achieved significant performance gain on most attributes on all three datasets. For some attributes which either only cover small parts of the images (“Sandals” and “V-neck” in PETA, “BaldHead” and “Attach-PaperBag” in RAP) or require deduction from contextual information (“action-Calling” in RAP, “AgeOver60” in PA-100k), the improvement is particularly prominent. This can be con-tributed to the effectiveness of visual-semantic graph rea-soning in attribute recognition.
Qualitative Evaluation. Fig.3 shows instance-based
recognition results of some pedestrian images from three datasets. For each examplar image, the correct and wrong predicted attributes are respectively marked in green and red color. The true, false and missed numbers of predicted attributes are also given. Results show that the baseline model is prone to miss some attributes in recognition, espe-cially those describing fine-grained pedestrian details. This is consistent with the reported relatively low recall rate of baseline model in qualitative evaluation. On the other hands, by performing visual-semantic graph-based reasoning, the
proposed method has recognized more detailed attributes while making less mistakes. In both RAP exemplars, the baseline model has failed to recognize the person’s actions. This may caused by its limited capability to infer with contextual clues. In first exemplar of PA-100k, the person is partially occluded. This brings disturbance to baseline model, which predicts sex incorrectly and fails to recognize the attributes of “Glasses”, “Backpack”, and “UpperSplice”. In second image of PA-100k, the person’s appearance is distracted by zebra crossing from background, which leads to incorrect recognition of upper-body attributes. In contrast, all attributes are corrected predicted with the proposed method.
Conclusions
A visual-semantic graph reasoning framework is proposed to jointly model spatial and semantic relations for sequen-tial attribute prediction. It is achieved by performing mu-tual embedding between the spatial and semantic graphs to guide the relational learning for each other using two sub-networks. Experimental results on PETA, RAP and PA-100k pedestrian attribute datasets demonstrate that the proposed graph-based reasoning framework significantly outperforms a wide range of state-of-the-art methods. Moreover, the proposed method is shown to be more effective in recog-nizing some hard attributes against a variety of challenge factors.
Acknowledgement
References
Ba, J. L.; Kiros, J. R.; and Hinton, G. E. 2016. Layer
nor-malization. InarXiv preprint arXiv:1607.06450.
Bourdev, L.; Maji, S.; and Malik, J. 2011. Describing peo-ple: A poselet-based approach to attribute classification. In
ICCV, 1543–1550.
Chen, X.; Li, L.-J.; Fei-Fei, L.; and Gupta, A. 2018. Iterative
visual reasoning beyond convolutions. InCVPR.
Chen, H.; Gallagher, A.; and Girod, B. 2012. Describing
clothing by semantic attributes. InECCV, 609–623.
Deng, Y.; Luo, P.; Loy, C. C.; and Tang, X. 2014. Pedestrian
attribute recognition at far distance. In ACM Multimedia,
789–792.
Deng, Y.; Luo, P.; Loy, C. C.; and Tang, X. 2015.
Learn-ing to recognize pedestrian attribute. In arXiv preprint
arXiv:1501.00901.
Gehring, J.; Auli, M.; Grangier, D.; Yarats, D.; and Dauphin, Y. N. 2017. Convolutional sequence to sequence learning.
InICML, 1243–1252.
Gkioxari, G.; Girshick, R.; Doll´ar, P.; and He, K. 2018.
Detecting and recognizing human-object interactions. In
CVPR.
Gkioxari, G.; Girshick, R.; and Malik, J. 2015. Contextual
action recognition with r* cnn. InICCV, 1080–1088.
Gray, D., and Tao, H. 2008. Viewpoint invariant pedes-trian recognition with an ensemble of localized features. In
ECCV, 262–275.
Hu, H.; Zhou, G.-T.; Deng, Z.; Liao, Z.; and Mori, G. 2016. Learning structured inference neural networks with label
re-lations. InCVPR, 2960–2968.
Jaha, E. S., and Nixon, M. S. 2014. Soft biometrics for
subject identification using clothing attributes. InIJCB, 1–
6.
Kipf, T. N., and Welling, M. 2017. Semi-supervised
classi-fication with graph convolutional networks. InICLR.
Kumar, N.; Berg, A. C.; Belhumeur, P. N.; and Nayar, S. K. 2009. Attribute and simile classifiers for face verification.
InICCV, 365–372.
Layne, R.; Hospedales, T. M.; Gong, S.; and Mary, Q. 2012.
Person re-identification by attributes. InBMVC.
Li, Y.; Tarlow, D.; Brockschmidt, M.; and Zemel, R. 2015.
Gated graph sequence neural networks. arXiv preprint
arXiv:1511.05493.
Li, D.; Zhang, Z.; Chen, X.; Ling, H.; and Huang, K. 2016a. A richly annotated dataset for pedestrian attribute
recogni-tion. InarXiv preprint arXiv:1603.07054.
Li, Q.; Qiao, M.; Bian, W.; and Tao, D. 2016b. Condi-tional graphical lasso for multi-label image classification. In
CVPR, 2977–2986.
Li, Y.; Huang, C.; Loy, C. C.; and Tang, X. 2016c. Hu-man attribute recognition by deep hierarchical contexts. In
ECCV, 684–700.
Li, D.; Chen, X.; and Huang, K. 2015. Multi-attribute learn-ing for pedestrian attribute recognition in surveillance
sce-narios. InACPR, 111–115.
Li, X.; Zhao, F.; and Guo, Y. 2014. Multi-label image clas-sification with a probabilistic label enhancement model. In
UAI.
Liu, F.; Xiang, T.; Hospedales, T. M.; Yang, W.; and Sun, C. 2017a. Semantic regularisation for recurrent image
annota-tion. InCVPR, 4160–4168.
Liu, X.; Zhao, H.; Tian, M.; Sheng, L.; Shao, J.; Yi, S.; Yan, J.; and Wang, X. 2017b. Hydraplus-net: Attentive deep
fea-tures for pedestrian analysis. InICCV, 350–359.
Ma, C.-Y.; Kadav, A.; Melvin, I.; Kira, Z.; AlRegib, G.; and Graf, H. P. 2018. Attend and interact: Higher-order object
interactions for video understanding. InCVPR.
Marino, K.; Salakhutdinov, R.; and Gupta, A. 2017. The more you know: Using knowledge graphs for image
classi-fication. InCVPR, 20–28.
Sarafianos, N., and Kakadiaris, I. A. 2018. Deep imbal-anced attribute classification using visual attention
aggrega-tion. arXiv preprint arXiv:1807.03903.
Sarfraz, M. S.; Schumann, A.; Wang, Y.; and Stiefelhagen, R. 2017. Deep view-sensitive pedestrian attribute inference
in an end-to-end model. InBMVC.
Scarselli, F.; Gori, M.; Tsoi, A. C.; Hagenbuchner, M.; and Monfardini, G. 2009. The graph neural network model.
IEEE Transactions on Neural Networks20(1):61–80. Siddiquie, B.; Feris, R. S.; and Davis, L. S. 2011. Image ranking and retrieval based on multi-attribute queries. In
CVPR, 801–808.
Sudowe, P.; Spitzer, H.; and Leibe, B. 2015. Person at-tribute recognition with a jointly-trained holistic cnn model. InICCV Workshops, 87–95.
Sutskever, I.; Martens, J.; Dahl, G.; and Hinton, G. 2013. On the importance of initialization and momentum in deep
learning. InICML, 1139–1147.
Wang, J.; Yang, Y.; Mao, J.; Huang, Z.; Huang, C.; and Xu, W. 2016. Cnn-rnn: A unified framework for multi-label
image classification. InCVPR, 2285–2294.
Wang, J.; Zhu, X.; Gong, S.; and Li, W. 2017. Attribute recognition by joint recurrent learning of context and
corre-lation. InICCV, 531–540.
Wang, J.; Zhu, X.; Gong, S.; and Li, W. 2018. Transfer-able joint attribute-identity deep learning for unsupervised
person re-identification. InCVPR.
Xue, X.; Zhang, W.; Zhang, J.; Wu, B.; Fan, J.; and Lu, Y. 2011. Correlative multi-label multi-instance image
annota-tion. InICCV, 651–658.
Zhang, N.; Paluri, M.; Ranzato, M.; Darrell, T.; and Bour-dev, L. 2014. Panda: Pose aligned networks for deep
at-tribute modeling. InCVPR, 1637–1644.
Zhu, J.; Liao, S.; Lei, Z.; Yi, D.; and Li, S. 2013. Pedestrian attribute classification in surveillance: Database and
evalua-tion. InICCV Workshops, 331–338.
Zhu, F.; Li, H.; Ouyang, W.; Yu, N.; and Wang, X. 2017. Learning spatial regularization with image-level
supervi-sions for multi-label image classification. InCVPR, 2027–