Abstract — Road traffic is a problem which is increasing in cities with large population. Unrelated to this fact the number of portable and wearable devices has also been increasing throughout the population of most countries. With this advent, the capacity to monitor and register data about people habits and locations as well as more complex data such as intensity and strength of movements has created an opportunity to contribute to the general wealth and comfort within these environments. Ambient Intelligence and Intelligent Decision Making processes can benefit from the knowledge gathered by these devices to improve decisions on everyday tasks such as deciding navigation routes by car, bicycle or other means of transportation and avoiding route perils. The concept of computational sustainability may also be applied to this problem. Current applications in this area demonstrate the usefulness of real time system that inform the user of certain conditions in the surrounding area. On the other hand, the approach presented in this work aims to describe models and approaches to automatically identify current states of traffic inside cities and use methods from computer science to improve overall comfort and the sustainability of road traffic both with the user and the environment in mind. Such objective is delivered by analyzing real time contributions from those mobile ubiquitous devices to identifying problematic situations and areas under a defined criteria that have significant influence towards a sustainable use of the road transport infrastructure.
Keywords — Traffic Expression, Smart Cities, Computational
Sustainability
I. INTRODUCTION
URRENT trends such as smart cities and the internet of things has focused attention towards the quality of living and well-being inside big cities . It is also believed that most people will be living inside cities until 2050. If true, such statement would predict the increase of road traffic in cities that were not neither originally designed nor prepared to handle such influxes of traffic. Ambient Intelligence (AmI) is a multi-disciplinary subject that is equipped with procedures that may help solving such problems taking advantage of fields such sensing systems, pervasive devices, context awareness and recognition, communications and machine learning. It is currently applied in a number of applications and concepts in fields like home, office, transport, tourism, recommender and safety systems, among others [1] .
Road traffic analysis is an expensive and time consuming task which traditionally involves direct evaluation and field
studies to assess and evaluate the impact of the flux of traffic in certain cities. An alternative to this is simulation experiments provide possible scenarios under which some assessment can be made. However, the downside of simulation lies in the use simplified models that are thought to mimic reality when in fact they may differ to some degree. Ubiquitous sensorization may be used to assess current traffic conditions, avoiding the use of costly field studies. Example of ubiquitous sensitization can already be found in certain areas such as traffic cameras and smart pressure detectors to assess traffic flow in specific points. This sensing is limited to the area it is implemented and does not provide information outside its operating range [2], [3]. More complex studies can be made with portable ubiquitous devices that follow drivers either because there a sensing device in the vehicle or the person driving carries a portable sensing device able to capture data related to driving. The nature of mobile ubiquitous devices also enable the possibility of direct analysis of driver behavior and community habits (points of congestion, high speed hazardous corners, aggressive sites) assessed trough the statistical treatment of driving records and offer safer alternatives for navigation with such information. These models have a direct impact diagnosing the current state of traffic and traffic behaviors to each route that may be used in modern GPS navigation systems, as an additional parameters.
Other approaches for the use of ubiquitous sensing devices involve real-time safety assessment, in [4] and [5] where a set of indicators is used to assess driving safety. Such indicators take into consideration the time of reaction, vehicle breaking time and whether or not there is a collision course. Yet, the analysis is still limited to the visible surrounding area and activities such as identification of other vehicles within the nearby space with the help of video interfaces disregarding sources of information outside that scope. In transport applications inside an area also known as Smart Cars, the AmI system must be aware not only of the car itself and its surroundings, but also of the driver's physical and physiological conditions and of the best way to deal with them [6]. The driver's behavior is important with several authors proposing machine learning and dynamic models to recognize different behaviors in drivers [7]. There are also examples of applications integrating AmI and ubiquitous principles in driving and traffic analysis. In [8], it is described a monitoring and driving behavior analysis system for emerging hybrid vehicles. The system is fully automated, non-intrusive with multi-modal sensing, based on smartphones. The application
Assessing Road Traffic Expression
Fábio Silva, Cesar Analide, Paulo Novais
,
Department of Informatics, University of Minho
-21- runs while driving and it will present personalized quantitative information of the driver's specific driving behavior. The quality of the devices used to perform such monitoring have a direct relationship to the quality of the measurement, thus, in this case, it is the main source of measurement error which needs to be controlled and contained to known error values order to make this study effective to production use. Other advantages include the possibility to increase information quality and create new routing styles in existing navigation systems taking into consideration aspects such as driver’s driving style or accident or hazardous events rate during the routing planning phase.
Other approaches to analysis of driving behavior can be found in [9] a mobile application assesses driving behavior, based on the identification of critical driving events, giving feedback to the driver. The I-VAITS project [6] is yet another example that pretends to assist the driver appropriately and unobtrusively, analyzing real-time data from the environment, from the car and from the driver itself, by the way the driver uses the different elements of the car, their movements or image processing of their face expressions. In [10], in the context of a car safety support system, an ambient agent-based model for a car driver behavior assessment is presented. The system uses sensors to periodically obtain information about the driver's steering operation and the focus of the driver's gaze. In the case of abnormal steering operation and unfocused gaze, the system launches proceedings in order to slow down, stop the car and lock the ignition.
An alternative approach to the use ubiquitous sensing is to gather information about the condition of the environment the driver is in, mapping it to further use. In the Nericell system [11], from Microsoft Research, monitors road and traffic conditions using the driver’s smartphone and corresponding incorporated sensors, but it can also detect honking levels, road condition and potholes as an example.
In what refers to devices used, there are today a wide range of options that can be used. The most effective should be portable devices that are always present and can perform complex tasks while not requiring user’s direct attention. In such list, there are devices like smartphones, smartwatches, and intelligent wristbands. Those offer the advantage of accompanying user from one situation to another, however there are devices that can be used that are more specialized such as the internal computer of a car. In this last case the object itself becomes part of the car which might increase its production cost while on the other hand multi-purpose portable devices might suffice to the work described.
The work described in this paper tries to enhance ubiquitous sensing for driving applications with the objective to support the concept known as sustainable driving. It requires the gathering of information about traffic condition but also, consciousness about sustainability dimensions such as environment, economic and social. With this in mind optimization should consider more than just economic aspects of driving, but also consider fuel emissions and social aspects
such as driver’s status, attention and driving style. Such work should complement existing other works and act as a platform for smart city traffic assessments. Moreover, the information generated by such system may be useful to third party systems which may use the knowledge base in their management applications and management systems.
II.COMPUTATIONAL SUSTAINABILITY
A. Computational Problem
The term computational sustainability is used by researcher such as Carla Gomes [12] to define the research field where sustainability problems are addressed by computer science programs and models in order to balance the dimensions of sustainability. It is accepted that the world ecosystem is a complex sustainability problem that is affected by human and non-human actions. In order to tackle these problems complex management systems should be put in practice in order to predict a number of attributes related to the sustainable problem at hand. Nevertheless, the pairing between computer science and the study of sustainability is as old as the awareness of sustainability and the availability computing systems. It is a fact that, as computational power capacity increased over time so did the complexity and length of the models used to study sustainability. The advent and general availability of modern techniques from artificial intelligence and machine learning allowed better approaches to the study of sustainability in a wide range of domains such as smart cities and transport systems.
Classical computational sustainability problems are not only found in smart grids, pollution, and distribution of energy but also city traffic. Considering the definition of sustainability and the topic of traffic expression, the use of computational methods to monitor and assess and optimize the transport efficiency are already used in systems today [2], [13], [14]. Nevertheless, the efficiency problem need to consider all dimensions of sustainability in order to become complete. The systems need to concern the optimization of not only traffic flow, economy and emission but also emissions, safety, and driver awareness.
B. Sustainable Driving
Traffic assessment is directly related to trending topics such as ubiquitous and pervasive methods that allow the balancing of economic, environmental and social factors needed for
sustainable development. A new emerging and
interdisciplinary area, known as Computational Sustainability, attempts to solve problems which are essentially related to decision and optimization problems in correlation to welfare and well-being. Due to its importance, some researchers have discussed and proposed quantification methods, and modelling process for sustainability [15], [16].
Often, decision and assessment are based on measurements and information about historical records. Indicator design provides an explanation on why such decisions are being made and it often uses information fusion to create and update its values. From a technological point of view, indicator analysis uses different and sometimes nonstandard data which sounds feasible by technological data gathering software that collect, store and combine data records from different sources. In the case of transportation systems, the assessment of the impact of a given driving pattern is made over sustainability indicators, like fuel consumption, greenhouse gas emissions, dangerous behavior or driving stress in each driver’s profile.
Applications and systems that deal with this information acquisition and reasoning are already present in the literature. A system to estimate a driver profile using smartphone sensors, able to detect risky driving patterns, is proposed in [17]. It was verified whether the driver behavior is safe or unsafe, using Bayesian classification. It is claimed that the system will lead to fuel efficient and better driving habits. In [18], and in addition to car sensory data, physiological data was continuously collected and analyzed (heart rate, skin conductance, and respiration) to evaluate a driver's relative stress. The CarMa, Car Mobile Assistant, is a smartphone-based system that provides high-level abstractions for sensing and tuning car parameters, where by developers can easily write smartphone applications. The personalized tuning can result in over 10% gains in fuel efficiency [19]. The MIROAD system, Mobile-Sensor-Platform for Intelligent Recognition Of Aggressive Driving [20], is a mobile system capable of detecting and recognizing driving events and driving patterns, intending to increase awareness and to promote safety driving, and, thus, possibly achieving a reduction in the social and economic costs of car crashes.
In [21], an android application is depicted which makes use of internal vehicle sensors to assess driving efficient patterns. With information about throttle, breaking and consumption the application is able to provide driving hints in real time according to a set of predefined rule matrixes. In this case the application is focused on fuel efficiency. A more compressive study for the use of driving and traffic data can be found in [22]. This analysis considers the availability of data internal vehicle sensors, traffic data through internet services and historic driving patterns records to help the creation of more efficient navigation plans.
From the systems reviewed, there is clear focus on the lower level problem towards sustainable driving. The interest for the consideration of the sustainable problem across all of its dimensions is not the primary target of these systems but rather themes like safety, efficiency and driving profile through event detection. These applications do however fit in the category of computational sustainability as computational tool that may be used on a subset of the driving sustainability problem.
Our interpretation of the application of computational sustainability in sustainable driving is represented in figure 1, where sustainable driving is obtained through 3 types of problems that can be applied to each dimension of the classical definition of sustainability separately or in conjunction. Those 3 problems consider constraints optimization and reasoning problems, acquiring and storing information through sensorization statistics and machine learning procedure and building dynamic models that can express the state of the environment and its participants so that the impact of decisions may be assessed.
In this work, the theme of sustainable driving will be addressed using a ubiquitous system for data acquisition integrated in a sustainability framework for the building of dynamic models that express the behavior of traffic and its conditions.
III. DRIVING EVALUATION
A. PHESS Driving System
The People Help Energy Savings and Sustainability (PHESS) project is being developed to help drive awareness towards the need for sustainable and energy efficient behaviors [23]. The framework is based on distributed system of multi-devices that generate data towards the creation and maintenance of indicators in the platform [24]. In order to drive awareness, specialized modules were developed that target user attention, mood and engagement. Through a set of
Social
Environment Economic
Constraint Restritions Reasoning Optimization
Dynamic Models
Machine Learning Statistical Analysis Sensorization Sustainable
Driving
-23- usage real world scenarios the platform is being demonstrated across different applications [25].
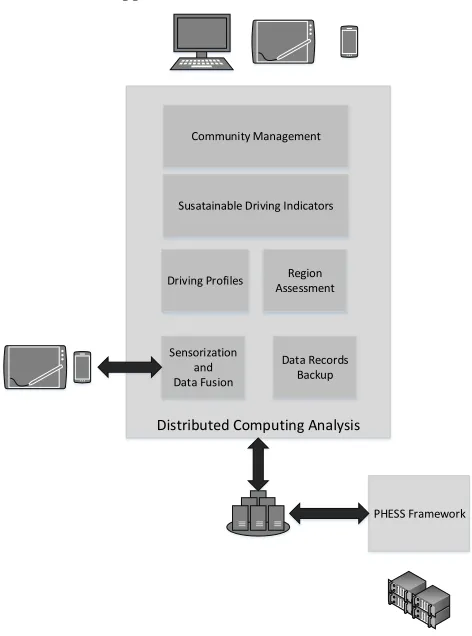
In regards to the work presented in this paper, the driving scenario is being targeted. Figure 2, illustrates the system designed to monitor, assess efficiency and sustainability in driving actions. As a building blocks to assess sustainable driving the system uses both driving profiles from the data gathered while driving, event detection from the analysis of such data and indicators defined in the PHESS platform. The indicator definition is made with application both in the driving profile definition and the analysis of regions in cities. That procedure reduces complexity while it does not lose much of the information in the aggregation of data records and information and becomes more meaningful.
B. Indicator Development
In order to produce information about traffic flow and route safety it is necessary to gather information about relevant information about driving patterns. The focus of our analysis was derived from indicators accepted in related studies in the literature review. Towards this effect it was considered the following indicators:
Average velocity;
Average fuel consumption;
Intensity of acceleration and breaking;
Number of breaking and accelerating events per time unit;
Standard deviation of velocity, intensity of breaking
and acceleration and number of breaking and accelerations;
Number of turn events based on curvature detection; Intensity of force exerted in the vehicle during turns; All of the indicators defined and built upon ubiquitous mobile sensorization, thus limited to their sensing abilities. Even so, some of the indicator defined are obtained through simple statistical procedures over the recorded data like average speed, number of breaks and standard deviations. The intensity of acceleration and breaking events is a more challenging task. Due to the usage of mobile smartphones, sensor access is not easily controllable. Efficiency measures make data reading uneven in time meaning sometimes there is oversampling where others there is under sampling. In order to mitigate such problem the assessment is made using the linear slope from the line connecting an initial and final velocity over a period of time as presented in equation 1. Such slope provides a mean to assess intensity that is independent of the size of the time interval.
i f
i f
t t
v v Slope
(1)
Number of breaking and accelerating events are measured in time windows, referenced as per unit of time. Defining an event window is helpful because only accelerations and breaking inside such window are considered and can be analyzed and compared between time windows.
Average fuel consumption is obtained from the fusion of user input data and the distance travelled. As an initial setup the user is required to configure the smartphone with a number of initial variables such as vehicle model and vehicle average consumptions. The aggregation of different vehicles in a large scale analysis makes this indicator more relevant for analysis.
Curve and turn detection is a special event due to characteristic and driving difficulty. Due to car handling, driving inside curvatures can present a risky task specially if driven at too much speed or under high breaking or accelerating intensity. As a consequence, for this analysis, a special strategy is employed which monitor the degree of curvature trough smartphone sensors.
)) (
cos( * ) cos( * ) sin(
)) sin( * ) cos( ), cos( * ) tanh(sin(
2 2 2
2
2 2
2 1
2
Direction
(2)
Equation 2 demonstrates the formula used to track angle difference in the direction between two points. As the curvature becomes more intense the road curvature is identified as potentially more dangerous than others. The intensity of forces while driving inside curvatures is monitored using the intensity of the accelerometer vector, equation 3.
Distributed Computing Analysis
PHESS Framework Driving Profiles
Community Management
Susatainable Driving Indicators
Data Records Backup Region Assessment
Sensorization and Data Fusion
2 2 2
z y
x Acc Acc
Acc
Intensity (3)
The indicator analysis uses a three level classification scheme based on the statistical occurrence of the indicator value being accessed. For the classification definition, quartiles are used as a mean to identify outlier data in each indicator and classify it differently. Consequently the procedure adopted was to order the sample data records and classify data between the 80-95% quartile as yellow events, the data above the 95% quartile as red events and the rest as green events. This leads to the assumption that most drivers will have an adequate driving style for the most of their trips. In table 1 it is presented, the classification for each indicator represented in this paper.
C. Driving Profile
The usage of roads can be affected by driver’s driving patterns. It is accepted that some drivers have a predisposition to drive more aggressively than others and there are significant deviations in their behaviors. Our approach uses this thought to gather the driving records from a community of users to classify different driving patterns to different people and link that data geographically in later analysis. The driving profile is based on the indicator defined in this papers plus attributes that respect directly to the person’s driving profile. Thus the list of driving attributes considers the indicator plus the list of attributes:
Time of day;
Trip average duration;
Standard deviation of trip duration;
Average maximum and minimum velocity per trip; Number of cars driven.
With those measures, a complete profile can be designed and executed in applications that monitor current driver’s performance. In [26], [27] other parameters were used to collect data from ordinary drivers in real traffic situations, such as wheel rotation, engine speed, ambient temperature, use of breaks and fuel consumption. In these studies, GPS data was also monitored, where each driving pattern was attributed to street type, street function, street width, traffic flow and codes for location in the city (central, semi-central, peripheral). It was concluded that the street type had the most influence on the driving pattern. The analysis of the 62 primary calculated parameters, resulted in 16 independent driving pattern factors, each describing a certain dimension of the driving pattern. When investigating the effect of the independent driving pattern factors on exhaust emissions, and on fuel consumption, it was found that there already studies with a common number of factors amongst the literature. Due to the decision to implement a pervasive system over mobile sensorization the work here described will account the attributes that are able to be collected by smartphone applications.
While these attributes characterize driving in a long term analysis, such strategy might miss spontaneous events that
occur sporadically. An example of such is a sudden break with high intensity. In order to deal with these one-off events, other attributes are of relevance:
Force exerted in the car;
Slope of the line connecting initial to final
velocity during breaking and accelerating
events;
Degree of the curvature of the road and force
exacted in the car.
It is important to stress that these attributes are already accounted in the driving profile because they are also defined as indicators in the PHESS platform.
D.City Analysis
The usage of roads can be affected by driver’s driving patterns. It is accepted that, if the majority of drivers have a predisposition to drive more aggressively in certain areas than others, then those areas are more dangerous. Our approach uses this thought to gather the driving records from a community of users and use them to calculate potential hazardous spots inside cities. Most evaluations are made using standard driving attributes, matured in the literature over a number of studies across different authors and projects. This kind of analysis is only possible with a dedicated user community that constantly updates and makes use of the platform supporting these models.
There is information that is dependent on external conditions of traffic and not related with driving itself. The platform developed will try to assess external condition using context estimation from the data gathered. The strategy employed uses indicator data linked with geographical data to define such context information. The indicator data is aggregated over a squares of geographical regions and their average value is computed. The granularity of the assessment is dependent on the size of the squared region. Nevertheless, such approach with an appropriate level of granularity is able to assess regions with high congestions rates or with high average speed, as an example. In this case, the velocity recorded by users is aggregated inside each square of terrain. The same analysis is available for other indicators in this systems and displayed in the same manner. Value added information produced in the system is published using a range of public web services. These web services provide public information about current traffic and driving conditions as well as, modelling analysis based on the historical data available in the platform.
-25- dangerous in one situation might not be in another. Usually, driving patterns are defined and associated to the speed profile of the driver, but it can be expanded to other variables, as gear changing, and big changes on the acceleration [27]. Experiments with communities are often used to provide real time analysis of geographic conditions and events, with examples of such in the Waze platform [14]. However, they are the lacking features of historic analysis and historical supported suggestions.
The aim of this work is to focus on intangible and soft attributes which we define as attributes that are not directly observed by data records but rather computed with techniques from static analysis and machine learning processes. Such attributes should be used to find hidden patterns of road usage that might be missed in standard traffic flow simulations. Examples of such errors in simulation include driving aggravation due to unforeseen events even with normal traffic conditions.
IV. ANALYSIS AND DISCUSSION OF STUDY RESULTS
Although this work is not using the internal data from vehicle sensor system as in past research [26], the approach followed in this work uses smartphone data for ubiquitous and pervasive monitoring. Data gathering is made through sensors, which is pre-processed internally with data fusion methodologies to enrich data and provide richer information. The number of variables used to assess driving patterns is based on the indicators and driving profiles defined.
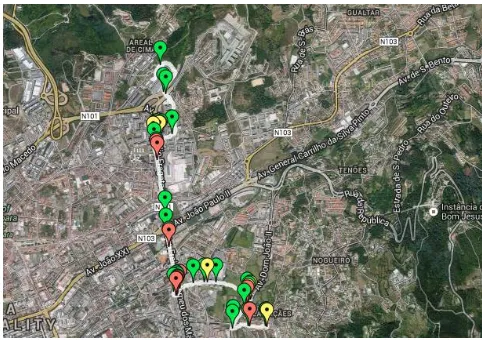
Using indicator assessment over normal car trips in the system it is possible to take note on each point detected by the GPS sensor the indicator classification. An example of such mechanism is present in figure 3.
Each view can be personalized taking into account all indicators or a subset of them according to their interest to the analysis. Using the indicator classification it is also possible to assess whether or not there are dangerous systematic behavior in each driver’s driving profile. Such task may be accomplished by assessing each indicator present in the profile. Other approach would be to directly compare driver’s inside the community by their driving profile attributes.
The model described in this article was tested as a complimentary module to a sustainability framework PHESS. Its aims are to produce and generate knowledge that can be used to perform decisions and suggestions that have a direct impact on sustainability and the sustainability of user’s actions. More than a responsibility framework, it is intended to increase awareness to sustainable problems that arise from user’s own actions and road usage by drivers.
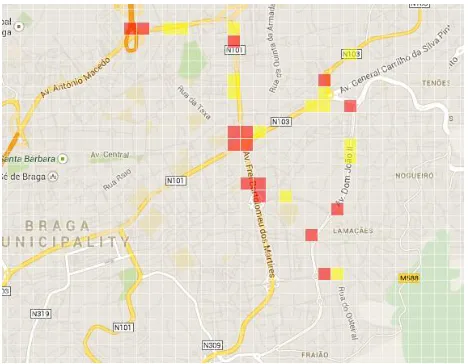
Taking into consideration a test city with a community of 10 users, it is possible to assess the sample metrics and indicators defined. Using the strategy described in the section city analysis a demonstrative example of the region grid classification of indicator is made in figure 4. In order to analyze the classification and demonstrate that the scale has been appropriated to detect a small but significant set of yellow and red events. Such detection mechanisms can be improved with more technical data about dangerous events or even adjust the quartiles used for classification, nevertheless the proposed approach provides satisfactory results.
Each event is characterized in the map, and for the user it is possible to see the information relevant to that assessment. On the other hand, figure 4 does not provide event level explanation but rather a set of filters with each indicator defined that may alter the map zone classifications according to whether or not they are selected.
The map covered by the identification of low and high average speed squares is within the expected range but varies according the time of day, however the location of squares is preserved although with different averages. Our approach, identifies such metrics on daily basis but the identified spots are within 10% to 15% of the visible map.
As with the analysis on figure 3, the analysis present in figure 4 may only include a subset of indicators in its representation thus simplifying the analysis of the map.
The results provided are based on web services which take information from the central distributed system to deliver information to graphical tools that display the information. In this case standard webpages were used.
While the results are satisfactory, future development should improve the social dimension of sustainable driving defining indicator directly associated with driver actions and emotions.
V.CONCLUSION
The use of pervasive devices already adopted by communities of users possess enough information and computing ability to build collaborative systems to tackle complex tasks. City traffic evaluation is one of such problems that are costly to audit and diagnose structural problem but can be simplified with crowd computing. Results are seem as satisfactory are reliable with the possibility to adjust according to specifics needs or needed improvement. The use of mobile sensors does constitute an additional effort to mitigate external influences such user involuntary movement, measurement and coverage errors. Nevertheless, the outputs generated in this platform were also found of relevance to the study of sustainability, where the intangible metrics and the structures employed to the indicator analysis pave the way to building sustainability assessing indicators able to join general purpose sustainability assessment frameworks such as the platform PHESS in discussion in this work.
In future iterations there are plan to update from grid analysis to road detection and road analysis becoming more accurate. Also, the validation of experiments on other cities are planned in order to prove both resilience and adaptation of the system. Integration of metrics found by this platform in common navigation systems are planned on the long term project, thus influencing routing options of people and acting as a true pervasive and ubiquitous object directing people away from dangerous situations into more comfortable and safe environments
VI. REFERENCES
[1] H. Nakashima, H. Aghajan, and J. C. Augusto, Handbook of Ambient
Intelligence and Smart Environments. Springer, 2009.
[2] T. Bellemans, B. De Schutter, and B. De Moor, “Data acquisition , interfacing and pre-processing of highway traffic data ∗,” vol. 19, pp. 0– 2, 2000.
[3] G. Leduc, “Road Traffic Data : Collection Methods and Applications,” 2008.
[4] A. Laureshyn, A. Svensson, and C. Hydén, “Evaluation of traffic safety, based on micro-level behavioural data: theoretical framework and first implementation.,” Accid. Anal. Prev., vol. 42, no. 6, pp. 1637–46, Nov. 2010.
[5] M. M. Minderhoud and P. H. Bovy, “Extended time-to-collision measures for road traffic safety assessment.,” Accid. Anal. Prev., vol. 33, no. 1, pp. 89–97, Jan. 2001.
[6] A. Rakotonirainy and R. Tay, “In-vehicle ambient intelligent transport systems (I-VAITS): towards an integrated research,” in Proceedings. The 7th International IEEE Conference on Intelligent Transportation
Systems (IEEE Cat. No.04TH8749), 2004, pp. 648–651.
[7] J. Sun, Z. Wu, and G. Pan, “Context-aware smart car: from model to prototype,” J. Zhejiang Univ. Sci. A, vol. 10, no. 7, pp. 1049–1059, Jul. 2009.
[8] K. Li, M. Lu, F. Lu, Q. Lv, L. Shang, and D. Maksimovic, “Personalized Driving Behavior Monitoring and Analysis for Emerging Hybrid Vehicles,” in Proceedings of the 10th International Conference on
Pervasive Computing, 2012, pp. 1–19.
[9] J. Paefgen, F. Kehr, Y. Zhai, and F. Michahelles, “Driving Behavior Analysis with Smartphones: Insights from a Controlled Field Study,” in Proceedings of the 11th International Conference on Mobile and
Ubiquitous Multimedia, 2012, pp. 36:1–36:8.
[10] T. Bosse, M. Hoogendoorn, M. A. C. A. Klein, and J. Treur, “A Component-Based Ambient Agent Model for Assessment of Driving Behaviour,” in Ubiquitous Intelligence and Computing, vol. 5061, F. Sandnes, Y. Zhang, C. Rong, L. Yang, and J. Ma, Eds. Springer Berlin Heidelberg, 2008, pp. 229–243.
[11] P. Mohan, V. N. Padmanabhan, and R. Ramjee, “Nericell,” in Proceedings of the 6th ACM conference on Embedded network sensor
systems - SenSys ’08, 2008, p. 323.
[12] C. Gomes, “Computational Sustainability.,” IDA, 2011.
[13] H. Lee, W. Lee, and Y.-K. Lim, “The Effect of Eco-driving System Towards Sustainable Driving Behavior,” in CHI ’10 Extended Abstracts
on Human Factors in Computing Systems, 2010, pp. 4255–4260.
[14] Waze Ltd, “Waze,” 2014. [Online]. Available: https://www.waze.com/. [Accessed: 23-Sep-2014].
[15] V. Todorov and D. Marinova, “Modelling sustainability,” Math.
Comput. Simul., vol. 81, no. 7, pp. 1397–1408, 2011.
[16] A. Kharrazi, S. Kraines, L. Hoang, and M. Yarime, “Advancing quantification methods of sustainability: A critical examination emergy, exergy, ecological footprint, and ecological information-based approaches,” Ecol. Indic., vol. 37, Part A, no. 0, pp. 81–89, 2014. [17] H. Eren, S. Makinist, E. Akin, and A. Yilmaz, “Estimating driving
behavior by a smartphone,” in 2012 IEEE Intelligent Vehicles
Symposium, 2012, no. 254, pp. 234–239.
[18] J. A. Healey and R. W. Picard, “Detecting Stress During Real-World Driving Tasks Using Physiological Sensors,” IEEE Trans. Intell. Transp. Syst., vol. 6, no. 2, pp. 156–166, Jun. 2005.
[19] T. Flach, N. Mishra, L. Pedrosa, C. Riesz, and R. Govindan, “CarMA,”
in Proceedings of the 9th ACM Conference on Embedded Networked
Sensor Systems - SenSys ’11, 2011, p. 135.
[20] D. A. Johnson and M. M. Trivedi, “Driving style recognition using a smartphone as a sensor platform,” in 2011 14th International IEEE
Conference on Intelligent Transportation Systems (ITSC), 2011, pp.
1609–1615.
[21] R. Ara, R. De Castro, and R. E. Ara, “Driving Coach : a Smartphone Application to Evaluate Driving Efficient Patterns,” vol. 1, no. 1, pp. 1005–1010, 2012.
[22] A. Fotouhi, R. Yusof, R. Rahmani, S. Mekhilef, and N. Shateri, “A review on the applications of driving data and traffic information for vehicles׳ energy conservation,” Renew. Sustain. Energy Rev., vol. 37, pp. 822–833, Sep. 2014.
-27- [23] F. Silva, D. Cuevas, C. Analide, J. Neves, and J. Marques,
“Sensorization and Intelligent Systems in Energetic Sustainable Environments,” in Intelligent Distributed Computing VI, 2013, vol. 446, pp. 199–204.
[24] F. Silva, C. Analide, L. Rosa, G. Felgueiras, and C. Pimenta, “Social Networks Gamification for Sustainability Recommendation Systems,” in Distributed Computing and Artificial Intelligence, Springer, 2013, pp. 307–315.
[25] F. Silva, C. Analide, L. Rosa, G. Felgueiras, and C. Pimenta, “Ambient Sensorization for the Furtherance of Sustainability,” in Ambient
Intelligence-Software and Applications, Springer, 2013, pp. 179–186.
[26] E. Ericsson, “Variability in exhaust emission and fuel consumption in urban driving,” URBAN Transp. Syst. Proc. …, no. 1980, pp. 1–16, 2000.
[27] E. Ericsson, “Independent driving pattern factors and their influence on fuel-use and exhaust emission factors,” Transp. Res. Part D Transp.
Environ., vol. 6, no. 5, pp. 325–345, 2001.
Fábio Silva obtained an MSc in degree in Informatics Engineering in 2011 from the University of Minho in Braga, Portugal. Currently, he is working towards his Ph.D. in Informatics at the University of Minho, Portugal. His current research interests include, Computational Sustainability, Energetic Efficient Systems and Multi-Agent Support Systems.
Cesar Analide is a Professor at the Department of Informatics of the University of Minho and a researcher and founder member of ISLab - Intelligent Systems Laboratory, a branch of the research center CCTC - Computer Science and Technology Center. His main interests are in the areas of knowledge representation, intelligent agents and multiagent systems, and sensorization.