R E S E A R C H A R T I C L E
Open Access
Association between low bone mass and
the serum RANKL and OPG in patients with
nephrolithiasis
Asieh Mansour
1, Maryam Aboeerad
1, Mostafa Qorbani
2,3, Amir Pejman Hashemi Taheri
4, Mohamad Pajouhi
1,
Abbas Ali Keshtkar
5, Bagher Larijani
1, Mohammad Reza Mohajeri-Tehrani
1†and Mohammad Reza Ganji
6*†Abstract
Background:Nephrolithiasis is a risk factor for Osteopenia and osteoporosis. Receptor activator of nuclear factor kappaB ligand (RANKL) and osteoprotegerin (OPG) regulate bone remodeling and osteoclastogenesis. This study aimed to evaluate the relation between serum OPG, RANKL concentration, and bone mineral density (BMD) in patients with kidney stone disease.
Methods:Forty-four nephrolithiasis patients with either low bone mass or normal BMD (considered control group) were enrolled in this study. BMD was measured at lumbar spine (L1-L4) and femoral neck by dual-energy X-ray absorptiometry (DEXA). The serum OPG and RANKL were determined using the ELISA method.
Results:The median levels of serum OPG were significantly higher in nephrolithiasis patients with low bone mass compared to the nephrolithiasis patients with normal BMD (3.9 pmol/l versus 3.1 pmol/l;P= 0.03), respectively. Negative correlation was detected between bone densities of femoral neck and OPG in patients with
nephrolithiasis (r=−.0344,P= 0.02).
Conclusion:The present study showed that high serum fasting OPG levels may be indicative of femoral neck BMD in patients with nephrolithiasis.
Keywords:Low bone mass, Osteopenia, Osteoporosis, BMD, OPG, RANKL, Nephrolithiasis
Background
A number of studies have provided evidence for the associ-ation between kidney stone and lower BMD. In men, stron-ger associations have been reported between the history of nephrolitasis and low BMD [1,2]. In addition, population-based studies have shown an increased fracture risk among stone formers [2, 3]. In fact, several in vitro and rodent studies have revealed that proinflammatory cytokines such as interleukin-6 (IL-6), interleukin-1 (IL-1), and tumor ne-crosis factor-alpha (TNF-α) are involved in the pathogen-esis of osteoporosis. These cytokines increase the synthpathogen-esis
of RANKL and macrophage colony-stimulating factor (M-CSF) [4]. In the mid-1990s, it was discovered that OPG/RANKL/RANK system plays a main role in the regu-lation of bone remodeling [5]. OPG is expressed on the os-teoblasts and osteocytes, which binds to RANK and stimulate the activity and differentiation of osteoclasts [6]. Due to the soluble receptor role of OPG for RANKL, it can prevent RANKL from interacting with RANK through binding to RANKL [5,7], suggesting that it plays an antire-sorptive role [8].
The aim of this study was to define the role of RANKL and OPG in the development of nephrolithiasis- related reduced bone mineral density. So we compared nephro-lithiasis patients with low bone mass to nephronephro-lithiasis patients with normal BMD to identify risk factors for the development of low bone mass in such patients.
* Correspondence:mreza@yahoo.com
†Mohammad Reza Mohajeri-Tehrani and Mohammad Reza Ganji contributed
equally to this work. 6
Nephrology Research Center, Shariati Hospital, Tehran University of Medical Sciences, Tehran, Iran
Full list of author information is available at the end of the article
Methods Study subjects
Potential participants attending the specialty clinic at Shar-iati university hospital, located in the city of Tehran-Iran, were invited to participate in this study. Eligible subjects with nephrolithiasis who had given written informed con-sent were entered into the study. All subjects had to be over the age of 18, willing and able to give written consent to the study, and had a diagnosis of nephrolithiasis. Partici-pants were excluded if they had hyperparathyroidism, thy-roid gland dysfunction, renal tubular acidosis, malignancy, longstanding corticosteroid intake. Other reasons for exclu-sion were use of estrogen, progesterone, bisphosphonate, calcitonin, heparins, and anti- inflammatory drugs, calcium, vitamin D and vitamin C supplements and treatment with thiazides diuretics. Information regarding nephrolithiasis in preceding years and medication use was retrieved by inter-viewing patients. The duration of kidney stone was consid-ered as the difference between the current age of the subject and the age at the time of the first diagnosis of kid-ney stone. Ethics Committee approval was gained from Tehran University of Medical Sciences (code: EC- 00308) and all participants provided written informed consent.
Measurement of BMD
BMD measurement of the lumbar spine (L1-L4) and one femur was performed by dual – energy X- ray absorpti-ometry (DEXA) using Lunar DPX-MD device (Lunar Corporation, Madison, Wisconsin, 53,713. USA). Results were expressed as absolute values (g/cm2), Z-score and T-score. The threshold for establishing a diagnosis of Low bone mass was based on the World Health Organization definition.
Blood tests
Samples were drawn from subjects after overnight fast-ing of 10–12 h at the baseline of the study. Serum
fast-ing and plasma EDTA tubes were immediately
centrifuged for 15 min at 2500×g. Serum and plasma specimens were frozen and stored at −80 °C until assay. Serum concentrations of creatinine, BUN (Blood Urea Nitrogen), uricacid, calcium, phosphor levels were determined by a colorimetric method using Pars Azmoon kits (Pars azmoon.co, Tehran, Iran). Serum concentration of PTH was measured by Biomenca. Serum levels of vitamin D were assayed by IDS. A 24-h urine sample was taken from subjects in order to evalu-ate calcium, phosphor, uric acid, citrevalu-ate, creevalu-atenine, and urine volume. Urine levels were measured by Pars Azmoon kits (Pars azmoon.co, Tehran, Iran). Serum OPG and RANKL levels were measured by ELISA kit according to the indication of manufacturer (DRG International Inc. (USA)).
Anthropometric measures
Height (to the nearest 0.5 cm) was measured using wall mounted stadiometer. Weight was taken in minimal clothing and no shoes. BMI was calculated by dividing body weight (in kg)/ height (in m) 2. Ultrasonography examinations were performed by an experienced radiolo-gist in Shariati hospital to diagnosis kidney stone.
Statistical analysis
Apvalue of< 0.05 was considered statistically significant (SPSS Inc. USA). The variables are shown as means ±SD and median (interquartile range). The Kolmogorove Smirnov test of normality was applied. Differences be-tween groups were tested by mann- whitnineys for none -normally distributed variables, unpaired t-test for normally distributed variables. Correlation between variables was assessed by spearman’s rank test. Re-ceiver operator characteristic (ROC) analysis was per-formed to establish the discriminator performance of OPG in predicting low bone mass in patients with nephrolithiasis.
Results
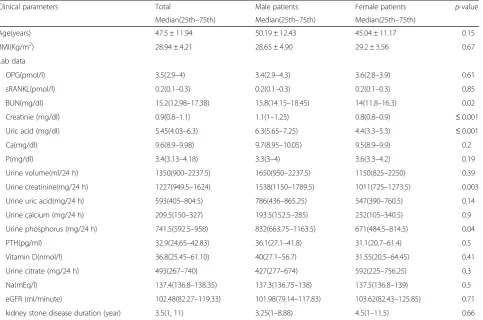
Forty four patients with nephrolithiasis (21 men and 23 women) were enrolled in this study. The majority of par-ticipants were middle age (mean age 47.5 ± 11.95 years) with a mean 28.94 ± 4.21 (kg/m2) BMI. Table1 displays clinical characteristics between male and female. As shown by table, males had significantly higher median (25th,75th) BUN, creatinine, uric acid, urine creatinine and urine phosphorous (15.8 (14.15,18.45) mg/dl,
1.1(1,1.25) mg/dl, 6.3 (5.65,7.25) mg/dl, 1538
(1150,1789.5) mg/24 h, 832 (663.75,1163.5) mg/24 h, re-spectively) than in females (14 (11.8,16.3) mg/dl, 0.8 (0.8,0.9) mg/dl, 4.4 (3.3,5.3) mg/dl, 1011 (725,1273.5) mg/24 h, 671 (484.5,814.5) mg/24 h, respectively) (p< 0.05).
Table 1Comparison of clinical parameters and lab data between male and female in nephrolithiasis patients
Clinical parameters Total Male patients Female patients p-value
Median(25th–75th) Median(25th–75th) Median(25th–75th)
Age(years) 47.5 ± 11.94 50.19 ± 12.43 45.04 ± 11.17 0.15
BMI(Kg/m2) 28.94 ± 4.21 28.65 ± 4.90 29.2 ± 3.56 0.67
Lab data
OPG(pmol/l) 3.5(2.9–4) 3.4(2.9–4.3) 3.6(2.8–3.9) 0.61
sRANKL(pmol/l) 0.2(0.1–0.3) 0.2(0.1–0.3) 0.2(0.1–0.3) 0.85
BUN(mg/dl) 15.2(12.98–17.38) 15.8(14.15–18.45) 14(11.8–16.3) 0.02
Creatinie (mg/dl) 0.9(0.8–1.1) 1.1(1–1.25) 0.8(0.8–0.9) ≤0.001
Uric acid (mg/dl) 5.45(4.03–6.3) 6.3(5.65–7.25) 4.4(3.3–5.3) ≤0.001
Ca(mg/dl) 9.6(8.9–9.98) 9.7(8.95–10.05) 9.5(8.9–9.9) 0.2
P(mg/dl) 3.4(3.13–4.18) 3.3(3–4) 3.6(3.3–4.2) 0.19
Urine volume(ml/24 h) 1350(900–2237.5) 1650(950–2237.5) 1150(825–2250) 0.39
Urine creatinine(mg/24 h) 1227(949.5–1624) 1538(1150–1789.5) 1011(725–1273.5) 0.003
Urine uric acid(mg/24 h) 593(405–804.5) 786(436–865.25) 547(390–760.5) 0.14
Urine calcium (mg/24 h) 209.5(150–327) 193.5(152.5–285) 232(105–340.5) 0.9
Urine phosphorus (mg/24 h) 741.5(592.5–958) 832(663.75–1163.5) 671(484.5–814.5) 0.04
PTH(pg/ml) 32.9(24.65–42.83) 36.1(27.1–41.8) 31.1(20.7–61.4) 0.5
Vitamin D(nmol/l) 36.8(25.45–61.10) 40(27.1–56.7) 31.55(20.5–64.45) 0.41
Urine citrate (mg/24 h) 493(267–740) 427(277–674) 592(225–756.25) 0.3
Na(mEq/l) 137.4(136.8–138.35) 137.3(136.75–138) 137.5(136.8–139) 0.5
eGFR (ml/minute) 102.48(82.27–119.33) 101.98(79.14–117.83) 103.62(82.43–125.85) 0.71
kidney stone disease duration (year) 3.5(1, 11) 3.25(1–8.88) 4.5(1–11.5) 0.66
eGFRestimated glomerular filtration rate based on the Creatinine Cockcroft-Gault Equation
Table 2Comparison of BMD between male and female in nephrolithiasis patients Bone mineral
density
Total Male patients Female patients p-value
Median(25th,75th) Median(25th,75th) Median(25th,75th)
Femur Neck
g/cm2 0.87(0.75,0.99) 0.9(0.77,0.99) 0.87(0.75, 0.99) 0.73
T-score −1.3 (−2,−0.1) −1.7(−2.4,-0.65) −0.8(−1.7,0.03) 0.04
Z- score −.7(−1.5,−0.2) −1.2(−1.7,-0.35) −0.6(−1.08,0) 0.06
Femur Total
g/cm2 0.94(0.84,1.03) 0.92(0.83,1.08) 0.95(0.84,1.02) 0.95
T-score −0.6(−1.6, 0.1) −1.2(−2,0.1) −0.4(−1.53,0.23) 0.2
Z- score −0.4 (−1.4, 0.2) −1.1(−1.7,0.05) −0.3(0.78,0.2) 0.21
Spine
g/cm2 01.06(0.97,1.18) 1.02(0.96,1.12) 1.15(0.96,1.2) 0.25
T-score −1(−1.9, 0) 1.7(−2.05,−0.75) −0.2(−1.8,0.25) 0.03
BMD, and also T- score and Z-score of femur total among two groups.
There was a significant inverse linear relationship be-tween OPG and femur neck BMDs (r=−.0344,P= 0.02). OPG didn’t show any significant relation to lumbar spine (r=−0.295, p= 0.05) (Table 3). Femoral neck BMDs were negatively correlated with the age of pa-tients (r=−0.544, p≤0.001) and kidney stone disease duration (r=−0.41, p= 0.002) and positively correlated with the BMI (r= 0.341, p= 0.02), urine phosphor (r= 0.572, p= 0.001) and eGFR (r= 0.54, p≤0.01). Femoral total BMDs were negatively correlated with age (r=− 0.369,p= 0.009) and positively correlated with BMI (r= 0.498, p = 0.001), urine phosphorous (r= 0.533, p= 0.002) and eGFR (r= 0.44, p= 0.003). Lumbar spine BMDs were negatively correlated with age (r=−0.338, p = 0.02) and positively correlated with urine phosphor (r= 0.437, p= 0.01) (Table 3), whereas no other relation-ship was found between parameters of BMD with BUN, creatinine, uric acid, calcium, phosphor, PTH, sodium, vitamin D, and also urinary biochemical variables such as calcium, uric acid (p> 0.05).
Patients were divided into two groups: Group 1 con-sisted of 23 patients with low bone mass and group 2 in-cluded 21 patients with normal BMD (control group). When comparing to control group, those with the
decreased BMD were significantly found to have higher OPG levels (3.1(2.8,3.7) pmol/l versus 3.9(2.9,4.4) pmol/l; P= 0.03) and lower eGFR (111(100.04,129.6) ml/minute versus 83.96(72.77,112.75) ml/minute; p= 0.002) and higher duration of kidney stone disease (1.25(1,10.75) years versus 5.5(3,11) years p = 0.002) (Table 4). Differ-ences in RANKL levels between this two groups didn’t reach statistical significant (p= 0.19).
There were no significant differences in age and BMI distribution. No significant differences were detected in the levels of sodium, BUN, creatinine, uric acid, calcium, phosphor, PTH, and vitamin D. As well, the differences in urine levels of citrate, phosphor, calcium, uric acid, creatinine, and volume among the two groups were not significant (Table4).
Using a ROC analysis, our data showed that OPG levels were sensitive for the presence of low bone mass at the femoral neck among individuals with nephrolithia-sis. A threshold levels for OPG at 3.38 pmol/l enabled us to detect low bone mass with AUC, sensitivity and speci-ficity of 68% (95%CI: 52–85), 69% (95%CI: 52–82) and 67% (95%CI: 50–80), respectively.
Discussion
This study showed an increased circulatory OPG in nephrolithiasis patients with reduced femoral neck
Table 3Correlation coefficient of BMD (g/cm2) with clinical characteristics in nephrolithiasis patients
Femur neck P-value Femur total P-value Lumbar spine P-value
OPG(pmol/l) −0.344 0.02 −0.228 0.14 −0.295 0.05
sRANKL(pmol/l) 0.220 0.16 0.122 0.44 0.249 0.1
OPG/RANKL −0.2 0.19 −0.16 0.30 −0.26 0.09
Age(years) −0.544 00 −0.369 0.009 −0.338 0.02
BMI (Kg/m2) 0.341 0.02 0.498 0.001 0.079 0.61
BUN(mg/dl) −0.257 0.09 −0.205 0.18 −0.126 0.41
Creatinie(mg/dl) 0.05 0.75 0.028 0.86 −0.188 0.22
Uric acid(mg/dl) −0.09 0.56 −0.159 0.3 −0.231 0.13
Ca(mg/dl) 0.126 0.42 0.072 0.64 −0.011 0.94
Phosphorous (mg/dl) −0.098 0.53 −0.150 0.33 −0.158 0.31
Urine volume(ml/24 h) −0.026 0.89 0.001 0.99 0.104 0.57
Urine creatinine (mg/24 h) 0.275 0.13 0.199 0.28 0.110 0.55
Urine uric acid(mg/24 h) 0.308 0.09 0.243 0.18 0.161 0.38
Urine calcium(mg/24 h) −0.133 0.47 −0.016 0.93 −0.153 0.41
Urine p(mg/24 h) 0.572 0.001 0.533 0.002 0.437 0.01
PTH(pg/ml) −0.288 0.06 0.215 0.16 −0.227 0.14
Vitamin D(nmol/l) −0.231 0.15 −0.242 0.13 −0.205 0.2
Na(mEq/l) −0.218 0.16 −0.133 0.39 −.291 0.05
Urine citrate (mg/24 h) 0.103 0.58 0.105 0.58 0.112 0.55
eGFR (ml/minute) 0.54 ≤0.01 0.44 0.003 0.26 0.84
density. Our data showed that nephrolithiasis patients with reduced BMD have higher serum OPG levels com-pared to those with normal bone density. No significant association was observed between RANKL and bone densities. Among people with kidney stone, duration of nephrolithiasis is significantly and positively related to the presence of low bone mass especially at femoral neck. In addition, in ROC analysis, OPG levels predicted BMD levels at femur neck in these patients.
To our knowledge, this is the first work that tries to gain some understanding on the role of serum OPG and RANKL in association with the measurements of BMD in nephrolithiasis patients. Nephrolithiasis has been demonstrated to accelerate bone loss; therefore, osteo-porosis could be possibly attributed to either the pres-ence of hypercalciuria [9] or decreased dietary calcium intake [10], and elevated serum levels of inflammatory factors such as IL-1, IL-6 and TNF-α[11]. A very recent meta- analysis of 24 case-control studies in patients with nephrolithiasis indicated the lower BMD values at all skeletal sites and in relation to osteoporosis, suggesting a four times increased risk of osteoporosis in those with nephrolithiasis compared to healthy controls [9]. Fur-thermore, our data has demonstrated a worsen BMD in male patients with nephrolithiasis, as evident by lower
T-score at the femur neck and T-score and Z-score at the lumbar spine.
One explanation may be the OPG acts as a decoy sub-strate to RANKL and RANK competitor; thus, inhibiting the formation and activity of osteoclasts [8, 12]. Some studies have reported the increased plasma OPG levels in patients with nephropathy [13] and osteoporosis [14] compared to those controls. For example, idiopathic hy-percalciuria (IH), characterized by the excessive loss of urine calcium, is the most common metabolic abnormal-ity in people in whom kidney stones form [15]. A study by Gomes et al. [16] noted the higher bone expression of both RANKL and OPG in patients with IH than in con-trol subjects. Although the mechanism for the bone ef-fects of OPG is elusive, evidence suggests that OPG may act as a protective factor for osteoporosis [14]. This hy-pothesis implies that the increased circulating OPG levels in nephrolithiasis patients with reduced BMD may be a compensatory mechanism against other factors that promote bone damages [14], perhaps as a part of re-sponse to inflammation in nephrolithiasis.
In addition, we observed that femoral neck BMD was inversely correlated with serum OPG and not the verte-bral spine in patients with kidney stones. Bone minerals can be divided into two types: cortical and trabecular.
Table 4Comparison of clinical characteristics among nephrolithiasis patients with normal and low bone mass
Clinical characteristics Normal Osteoporosis/ Osteopenia P- value
Median(25th,75th) Median(25th,75th)
Age(years) 40(35.5,47) 56(42,64) 0.05
BMI (Kg/m2) 28.95(27.3,30.52) 27.43(24.49,30.39) 0.1
OPG(pmol/l) 3.1(2.8,3.7) 3.9(2.9,4.4) 0.03
sRANKL(pmol/l) 0.2(0.1,0.3) 0.2(0.1,0.2) 0.19
OPG/RANKL 14.5(10.17,29) 20(14,39) 0.08
Na(mEq/l) 137.30(136.65,138) 137.6(136.9139.2) 0.23
BUN(mg/dl) 13.6(12.1,15.9) 16.3(14.1,17.7) 0.25
Creatinie(mg/dl) 0.8(0.8,1.1) 1(0.8,1.3) 0.62
Uric acid (mg/dl) 5.3(4.4,6.1) 5.9(3.9,7) 0.94
Calcium(mg/dl) 9.6(9.1,9.9) 9.4(8.9,10) 0.62
Phosphorous(mg/dl) 3.3(3.25,4.2) 3.5(3.1,4.1) 0.94
Urine volume (ml/24 h) 900(775,1950) 1700(1100,2250) 0.21
Urine creatinine (mg/24 h) 1104(850,1570) 1360(946,1740) 0.59
Urine uric acid (mg/24 h) 702(369,876.5) 572(400,800) 0.52
Urine ca (mg/24 h) 195(99,294) 234(160,352) 0.51
Urine p(mg/24 h) 828(614,1134) 682(590,864) 0.21
PTH(pg/ml) 31.1(19.2,38.6) 37.5(27,61.4) 0.09
Vitamin D(nmol/l) 36.25(20.5,57.83) 36.8(26.15,64.95) 0.54
Urine citrate (mg/24 h) 496.5(259.25,743.75) 356(267,733) 0.67
eGFR(ml/minute) 111(100.04,129.6) 83.96(72.77, 112.75) 0.002
The femoral neck region contains both trabecular and cortical tissue whereas the vertebrae region contains high amounts of trabecular tissue [17–19]. In this study, patients with low bone mass were older, had a higher PTH and had decreased levels of GFR than normal patients.
It is well known that cortical bone turnover is in-creased in presence of high PTH levels [20]. It is also well known that reduced GFR levels are associated with significant cortical bone loss [21,22]. In addition the re-sults of a study investigating changes in the bone density of trabecular and cortical bone revealed variable rates of change during aging. Large decreases in trabecular BMD in both genders were reported before age 50, but studies have found a small decrease in bone density at cortical bone before age 50 in men and women [23]. Thus, taken together, we speculate that decreased GFR, elevated PTH levels and higher age in low BMD groups may con-tribute to the differences in the underlying mechanism relating to OPG levels and BMD of the femoral neck seen in these populations.
There are some limitations to our study. Although this study supported an inverse correlation between circula-tory levels of OPG with BMD measurement, which high-lights the potential link between nephrolithiasis and reduced bone mass, but due to the cross-sectional na-ture of our study cautious the causal assumption be-tween them; whether reduced bone mass brings high levels of OPG in nephrolithiasis or that high levels of OPG in nephrolithiasis brings low bone mass. Future longitudinal studies in patients will help to determine whether the OPG provides additive predictive value for femoral neck BMD decline. In addition, A power ana-lysis for OPG levels based on the differences demon-strated in our study between patients with low bone mass (3.14 ± 0.72) and normal BMD (3.68 ± 0.98), with anαof 0.05, resulted in a power of 58%. Thus, it is pos-sible that our relatively small sample size limited our ability to detect true differences and an additional study with larger sample size, preferably a prospective cohort study should be pursued to confirm our findings and es-tablish any other distinct relationships between the bone remodeling proteins in the OPG/RANKL/RANK axis and bone density in subjects with nephrolithiasis. The other limitation is that non- nephrolithiasis individual were not enrolled as controls.
Conclusion
The present study showed that high serum fasting OPG levels may be indicative of femoral neck BMD in pa-tients with nephrolithiasis. A deeper knowledge of mechanisms involved in the association between OPG serum levels, bone integrity, and kidney stone disease
can provide more robust scientific approaching for fu-ture therapeutic interventions.
Acknowledgements
We would like to thank to all patient that took part in the study.
Funding
This work was supported in part by Endocrinology and Metabolism Research Institute, Tehran University of Medical Sciences under grant agreement number: 1392–01–103-1583.
Availability of data and materials
All data generated and analysed in this study are included in the published article.
Authors’contributions
Research idea and study design: AM, MRG, AAK; data acquisition: AM, MA, APHT; data analysis/interpretation: AM, MRMT; statistical analysis: AM, MQ; supervision or mentorship: BL, MRG, MRMT, MP. All authors read and approved the final manuscript.
Ethics approval and consent to participate
The study was approved by the Tehran University of Medical Sciences Ethics Committee (EC-00308) and all participants provided written informed consent.
Consent for publication
Not applicable.
Competing interests
The authors declare that they have no conflict of interest.
Publisher’s Note
Springer Nature remains neutral with regard to jurisdictional claims in published maps and institutional affiliations.
Author details
1Endocrinology and Metabolism Research Center, Endocrinology and Metabolism Clinical Sciences Institute, Tehran University of Medical Sciences, Tehran, Iran.2Non-Communicable Diseases Research Center, Alborz University of Medical Sciences, Karaj, Iran.3Chronic Diseases Research Center, Endocrinology and Metabolism Population Sciences Institute, Endocrinology and Metabolism Research Institute, Tehran University of Medical Sciences, Tehran, Iran.4Radiology department, Shariati hospital, Tehran University of Medical Sciences, Tehran, Iran.5Department of Health Science Education Development, School of Public Health, Tehran University of Medical Sciences, Tehran, Iran.6Nephrology Research Center, Shariati Hospital, Tehran University of Medical Sciences, Tehran, Iran.
Received: 11 July 2017 Accepted: 25 June 2018
References
1. Sakhaee K, Maalouf NM, Kumar R, Pasch A, Moe OW. Nephrolithiasis-associated bone disease: pathogenesis and treatment options. Kidney Int. 2011;79(4):393–403.
2. Lauderdale DS, Thisted RA, Wen M, Favus MJ. Bone mineral density and fracture among prevalent kidney stone cases in the third National Health and nutrition examination survey. J Bone Miner Res. 2001;16(10):1893–8. 3. Melton LJ, Crowson CS, Khosla S, Wilson DM, O'Fallon WM. Fracture risk among patients with urolithiasis: a population-based cohort study. Kidney Int. 1998;53(2):459–64.
4. Santos A, Lima EM, Oliveira EA. Bone disease and cytokines in idiopathic hypercalciuria: a review. J Pediatr Endocrinol Metab. 2011;24(7–8):405–10. 5. Simonet W, Lacey D, Dunstan C, Kelley M, Chang M-S, Lüthy R, et al.
Osteoprotegerin: a novel secreted protein involved in the regulation of bone density. Cell. 1997;89(2):309–19.
7. Bezerra M, Carvalho J, Prokopowitsch A, Pereira R. RANK, RANKL and osteoprotegerin in arthritic bone loss. Braz J Med Biol Res. 2005;38(2):161–70. 8. Sasso GRS, Florencio-Silva R, Simões RS, Baracat MCP, Soares Júnior JM,
Baracat EC. Elevated serum osteoprotegerin levels in women: friend or foe? Revista da Associação Médica Brasileira. 2015;61(6):524–9.
9. Lucato P, Trevisan C, Stubbs B, Zanforlini B, Solmi M, Luchini C, et al. Nephrolithiasis, bone mineral density, osteoporosis, and fractures: a systematic review and comparative meta-analysis. Osteoporos Int. 2016:1–10.
10. Trinchieri A. Bone mineral content in calcium renal stone formers. Urol Res. 2005;33(4):247–53.
11. Tsao KC, Wu TL, Chang PY, Sun CF, Wu LL, Wu JT. Multiple risk markers for atherogenesis associated with chronic inflammation are detectable in patients with renal stones. J Clin Lab Anal. 2007;21(6):426–31. 12. Venuraju SM, Yerramasu A, Corder R, Lahiri A. Osteoprotegerin as a
predictor of coronary artery disease and cardiovascular mortality and morbidity. J Am Coll Cardiol. 2010;55(19):2049–61.
13. Rasmussen LM, Tarnow L, Hansen TK, Parving H-H, Flyvbjerg A. Plasma osteoprotegerin levels are associated with glycaemic status, systolic blood pressure, kidney function and cardiovascular morbidity in type 1 diabetic patients. Eur J Endocrinol. 2006;154(1):75–81.
14. Grigorie D, Neacşu E, Marinescu M, Popa O. Circulating osteoprotegerin and leptin levels in postmenopausal women with and without osteoporosis. Romanian journal of internal medicine= revue roumaine de. Med Int. 2002; 41(4):409–15.
15. Bushinsky DA. Nephrolithiasis: site of the initial solid phase. J Clin Invest. 2003;111(5):602–5.
16. Gomes SA, dos Reis LM, Noronha IL, Jorgetti V, Heilberg IP. RANKL is a mediator of bone resorption in idiopathic hypercalciuria. Clin J Am Soc Nephrol : CJASN. 2008 Sep;3(5):1446–52. PubMed PMID: 18480302. Pubmed Central PMCID: Pmc2518782. Epub 2008/05/16. Eng.
17. Eastell R, Mosekilde L, Hodgson SF, Riggs BL. Proportion of human vertebral body bone that is cancellous. J Bone Miner Res. 1990;5(12):1237–41. 18. Lundeen G, Knecht S, Vajda E, Bloebaum R, Hofmann A. The contribution of
cortical and cancellous bone to dual-energy X-ray absorptiometry measurements in the female proximal femur. Osteoporos Int. 2001;12(3): 192–8.
19. Martin R, Ishida J. The relative effects of collagen fiber orientation, porosity, density, and mineralization on bone strength. J Biomech. 1989;22(5):419–26. 20. Lewiecki EM, Miller PD. Skeletal effects of primary hyperparathyroidism:
bone mineral density and fracture risk. J Clin Densitom. 2013;16(1):28–32. 21. Nickolas TL, Stein EM, Dworakowski E, Nishiyama KK, Komandah-Kosseh M,
Zhang CA, et al. Rapid cortical bone loss in patients with chronic kidney disease. J Bone Miner Res. 2013;28(8):1811–20.
22. Kim CS, Bae EH, Ma SK, Han SH, Choi KH, Lee J, et al. Association of Serum Osteoprotegerin Levels with bone loss in chronic kidney disease: insights from the KNOW-CKD study. PLoS One. 2016;11(11):e0166792.