R E S E A R C H A R T I C L E
Open Access
Associations of complement factor B and
complement component 2 genotypes with
subtypes of polypoidal choroidal vasculopathy
Koji Tanaka
1, Tomohiro Nakayama
2*, Ryusaburo Mori
1, Naoyuki Sato
2, Akiyuki Kawamura
1and Mitsuko Yuzawa
1Abstract
Background:We previously reported on subtypes of polypoidal choroidal vasculopathy (PCV), and categorized PCV as polypoidal choroidal neovascularization (CNV) and typical PCV. The aim of this study was to clarify whether complement component 2 (C2) and complement factor B (CFB) genotypes are associated with subtypes of polypoidal choroidal vasculopathy, such as polypoidal CNV and typical PCV.
Methods:First, we categorized 677 patients into typical age-related macular degeneration (tAMD; 250 patients), PCV (376) and retinal angiomatous proliferation (RAP; 51). Second, we categorized 282 patients with PCV as having polypoidal CNV (84 patients) or typical PCV (198) based on indocyanine green angiographic findings. In total, 274 subjects without AMD, such as PCV and CNV, served as controls. A SNP (rs547154) in theC2gene and three SNPs (rs541862, rs2072633, rs4151667) in theCFBgene were genotyped, and case–control studies were performed in subjects with these PCV subtypes.
Results:In tAMD, no SNPs were associated with allele distributions. In PCV, rs547154 and rs2072633 were associated with allele distributions. RAP was only associated with rs2072633. After logistic regression analysis with adjustment for
confounding factors, tAMD, PCV and RAP were found to be associated with rs2072633.
As to PCV subtypes, there were significant differences in the distributions of rs547154, rs541862 and rs2072633 in the case–control studies for polypoidal CNV, but not between the typical PCV and control groups. Logistic regression analysis with adjustment for confounding factors showed the distributions of rs547154, rs541862 and rs2072633 to differ
significantly between the controls and polypoidal CNV cases and that these SNPs were protective. The A/A genotype of rs2072633 was significantly more common in the polypoidal CNV than in the typical PCV group (p = 0.03), even with adjustment for polyp number and greatest linear dimension.
Conclusions:PCV might be genetically divisible into polypoidal CNV and typical PCV. The C2 and CFB gene variants were shown to be associated with polypoidal CNV. Typical PCV was not associated with variants in these genes.
Keywords:Subtypes of PCV, C2, CFB, Genetic variants
Background
Age-related macular degeneration (AMD) is a leading cause of blindness in Western countries and its preva-lence is increasing in Japan [1]. AMD is thought to be a heterogeneous multifactorial disease associated with several environmental factors and genetic variants. Hypertension [2] and cigarette smoking [3] are closely
related to the development of AMD. Identification of AMD susceptibility genes might increase our ability to predict the risk of developing this disease. Complement factor H (CFH), age-related maculopathy susceptibility 2 (ARMS2) and high-temperature requirement factor A1 (HTRA1) have been shown to be associated with AMD in both Japanese and Caucasian patients [4-7]. In addition, complement component 2(C2) and comple-ment factor B (CFB) known as activators of alternative complement cascades are reportedly related to AMD in Caucasians [8]. Both were reported to be protective * Correspondence:[email protected]
2
Department of Pathology and Microbiology, Nihon University School of Medicine, Tokyo, Japan
Full list of author information is available at the end of the article
© 2014 Tanaka et al.; licensee BioMed Central Ltd. This is an Open Access article distributed under the terms of the Creative Commons Attribution License (http://creativecommons.org/licenses/by/4.0), which permits unrestricted use, distribution, and reproduction in any medium, provided the original work is properly credited. The Creative Commons Public Domain Dedication waiver (http://creativecommons.org/publicdomain/zero/1.0/) applies to the data made available in this article, unless otherwise stated.
genes against AMD development [9,10]. Genetic studies of PCV have found no association between either C2 or CFB and PCV [11,12]. Nakata et al. reported that, in the Japanese population, C2 and CFB are associated with both PCV and typical AMD (tAMD) [13].
Polypoidal choroidal vasculopathy (PCV), characterized by a branching vascular network with polypoidal lesions detectable by indocyanine green angiography (IA) [14], is included among the forms of exudative AMD in Japan [15]. Our group previously reported on subtypes of PCV, and categorized PCV as polypoidal choroidal neovasculari-zation (CNV) and PCV in the narrow sense (also referred to as typical PCV) [16]. In the first type, both feeder and draining vessels are visible on IA and network vessels are numerous. This type is thought to be the representative form of CNV beneath the retinal pigment epithelium. In the second group, neither feeder nor draining vessels are detectable and the number of network vessels is small. This type is thought to represent an abnormality of the choroidal vasculature based on hyaline arteriosclerosis [17]. We also showed that there are differences in these two types classified according to IA and optic coherence tomography findings [18]. Genetically, we demonstrated an association between the ARMS2 gene and these two types of PCV [19]. There was a significant ARMS2 gene difference in case–control studies of polypoidal CNV, but no difference between the typical PCV and control groups. This observation suggests that PCV might be genetically divisible into polypoidal CNV and typical PCV.
The possibility of dividing PCV into two types has been raised by other investigators. Okubo et al. reported that PCV can be divided into two types; the small-short and large-long types, but the clinical features in their report dif-fered from those described by our group [20]. Miki et al. re-cently advocated dividing PCV into polypoidal lesions with a clear branching vascular network and polypoidal lesions without such a vascular network [21]. After classifying PCV into two types based on IA findings, we conducted ARMS2 and CFH genotyping for our patients. The results were highly consistent with our report showing typical PCV to be unrelated to the ARMS2 gene.
The present study aimed to investigate whether there is an association between the C2 or the CFB gene and any of the subtypes of PCV. To our knowledge, this is the first study to examine associations of the C2 and CFB genes with PCV subtypes.
Methods Participants
Six hundred and seventy-seven patients diagnosed as having AMD at Nihon University Surugadai Hospital in Tokyo were enrolled in this study between 2008 and 2010 (472 men, 205 women; mean age 72.11 years). We then categorized AMD as tAMD, PCV and RAP based
on IA and color photograph. (tAMD; 187 men, 63 women, PCV; 266 men, 110 women, RAP;19 men, 32 women)
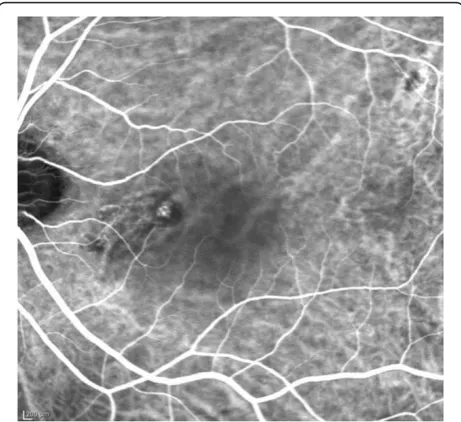
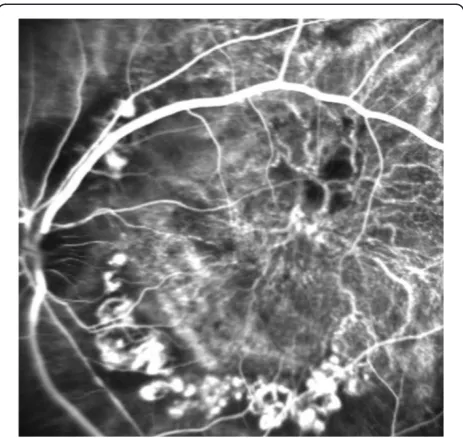
Furthermore, we also classified PCV patients into groups with two different types of PCV, polypoidal CNV and typical PCV. Two hundred and eighty-two (195 men, 87 women; mean age 70.0 ± 8.8 years) out of 376 patients were enrolled after classification based on whether or not both feeder and draining vessels were seen on IA (Figures 1 and 2). Due to unclear IA findings, we could not classify the remaining 94 patients. Eighty-four patients were diag-nosed with polypoidal CNV, 198 with typical PCV. Polyp numbers and greatest linear dimension (GLD) were deter-mined by IA at the first visit.
Information on hypertension, diabetes mellitus and smoking was obtained from medical histories collected for each patient. Smokers were defined as current or former smokers, whereas non-smokers were defined as subjects with no previous or current smoking history.
In total, 274 subjects free of AMD (110 men, 164 women; mean age 72.9 ± 7.4 years) served as controls. There were no remarkable findings on fundus examina-tions of the controls. Informed consent was obtained from each individual as per the protocol approved by the Hu-man Studies Committee of Nihon University. This investi-gation was performed according to the guidelines of the Declaration of Helsinki.
Genotyping
DNA was extracted from peripheral blood leukocytes by the phenol and chloroform extraction method [22,23]. Genotyping was performed using the TaqMan® SNP Genotyping Assay (Applied Biosystems Inc. Foster City,
Figure 1Typical PCV.Neither feeder nor draining vessels were visible in the early phase of indocyanine green angiography. The network is composed of a small number of vessels with a polypoidal lesion.
Tanakaet al. BMC Ophthalmology2014,14:83 Page 2 of 12
CA, USA). TaqMan® SNP Genotyping Assays were per-formed using the Taq amplification method [22,23].
We targeted C2 rs547154(IVS10), and CFB rs541862, rs2072633(IVS17) and rs4151667(H9L), all of which were identified as having positive associations with AMD in prior studies [11,13].
Plates were read on the SDS 7700 instrument with the end-point analysis mode of the SDS version 1.6.3 software package (Applied Biosystems). Geno-types were determined visually based on the dye-component fluorescent emission data depicted in the X-Y scatter-plot of the SDS software. Genotypes were also determined automatically by the signal processing algorithms of the software [22,23].
Statistical analysis
Data are shown as means ± SD. Differences between the PCV subtype and control groups were assessed by
ana-lysis of variance (ANOVA) followed by Fisher’s
pro-tected least significant difference test. Hardy-Weinberg equilibrium was assessed by chi-squared analysis. The overall distribution of alleles was analyzed using 2 × 2 contingency tables. The distribution of the genotypes between patient groups and controls was tested using a 2-sided Fisher’s exact test and multiple logistic regres-sion analysis. After Bonferroni correction, statistical sig-nificance was set at p < 0.0125.
Based on the genotype data of the genetic variations, linkage disequilibrium (LD) analyses and a
haplotype-based case–control study were carried out using the
expectation maximization algorithm with the SNPA-lyze software program ver3.2 (Dynacom, Yokohama, Japan). |D’| values > 0.5 were used to assign SNP loca-tions to one haplotype block. The frequency distribu-tion of occurrence of the haplotypes was calculated by
χ2
analyses.
Results
The clinical features of AMD patients and the control group are shown in Table 1. Distributions of genotypes and alleles are shown in Table 2. Four variants were in Hardy-Weinberg equilibrium in the control group (data not shown, p > 0.05). There were significant differences
in PCV the allele distributions of rs547154 (C2 gene)
and rs2072633 (CFBgene) between the PCV group and
the controls. The RAP allele distribution of rs2072633 differed significantly between the RAP group and the controls. The tAMD group showed no difference from the controls.
The results of logistic regression analysis, with adjust-ment for confounding factors, including age, gender and risk factors, are shown in Table 3. This analysis was performed for the dominant or recessive genotype models showing significant results, as presented in
Table 1 Characteristics of study participants
Case
Control Total AMD P vs. control Typical AMD P vs. control PCV P vs. control RAP P vs. control
Subjects, n 677 250 376 51 274
Male/female 472/205 <0.0001* 187/63 <0.0001* 266/110 <0.0001* 19/32 0.757 110/164
Age 72.1(±8.7) 0.157 73.6(±7.5) 0.289 70.0(±8.9) <0.0001* 80.9(±6.8) <0.0001* 72.9(±7.4)
HT 39% 0.308 41% 0.658 38% 0.226 41% 0.878 43%
DM 11% <0.0001* 14% 0.079 9% 0.081 6% 0.016* 20%
Smoker 35% <0.0001* 37% <0.0001* 36% <0.0001* 16% 84% 18%
p-values reflect comparisons between each of the case groups and the control group, calculated using Fisher’s exact test. *p < 0.05.
Figure 2Polypoidal CNV.Both feeder and draining vessels were observed in the early phase of indocyanine green angiography. Large numbers of network vessels were seen to be fluorescing in an umbrella-like configuration. Several of the polypoidal lesions were dilatations of marginal tortuous vessels.
Tanakaet al. BMC Ophthalmology2014,14:83 Page 3 of 12
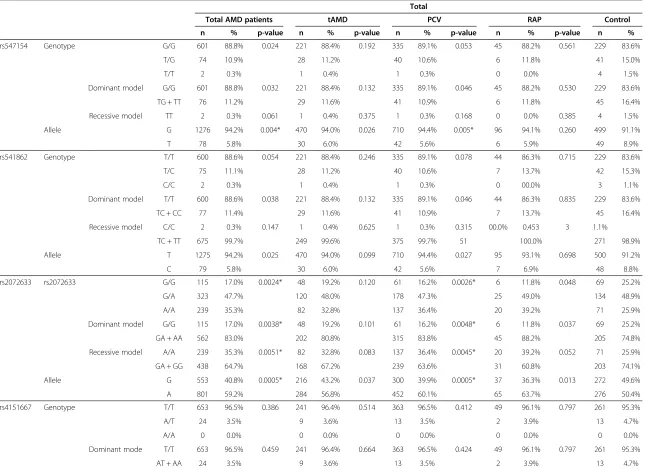
Table 2 Genotype and allele distributions in AMD patients and control group
Total
Total AMD patients tAMD PCV RAP Control
n % p-value n % p-value n % p-value n % p-value n %
rs547154 Genotype G/G 601 88.8% 0.024 221 88.4% 0.192 335 89.1% 0.053 45 88.2% 0.561 229 83.6%
T/G 74 10.9% 28 11.2% 40 10.6% 6 11.8% 41 15.0%
T/T 2 0.3% 1 0.4% 1 0.3% 0 0.0% 4 1.5%
Dominant model G/G 601 88.8% 0.032 221 88.4% 0.132 335 89.1% 0.046 45 88.2% 0.530 229 83.6%
TG + TT 76 11.2% 29 11.6% 41 10.9% 6 11.8% 45 16.4%
Recessive model TT 2 0.3% 0.061 1 0.4% 0.375 1 0.3% 0.168 0 0.0% 0.385 4 1.5%
Allele G 1276 94.2% 0.004* 470 94.0% 0.026 710 94.4% 0.005* 96 94.1% 0.260 499 91.1%
T 78 5.8% 30 6.0% 42 5.6% 6 5.9% 49 8.9%
rs541862 Genotype T/T 600 88.6% 0.054 221 88.4% 0.246 335 89.1% 0.078 44 86.3% 0.715 229 83.6%
T/C 75 11.1% 28 11.2% 40 10.6% 7 13.7% 42 15.3%
C/C 2 0.3% 1 0.4% 1 0.3% 0 00.0% 3 1.1%
Dominant model T/T 600 88.6% 0.038 221 88.4% 0.132 335 89.1% 0.046 44 86.3% 0.835 229 83.6%
TC + CC 77 11.4% 29 11.6% 41 10.9% 7 13.7% 45 16.4%
Recessive model C/C 2 0.3% 0.147 1 0.4% 0.625 1 0.3% 0.315 00.0% 0.453 3 1.1%
TC + TT 675 99.7% 249 99.6% 375 99.7% 51 100.0% 271 98.9%
Allele T 1275 94.2% 0.025 470 94.0% 0.099 710 94.4% 0.027 95 93.1% 0.698 500 91.2%
C 79 5.8% 30 6.0% 42 5.6% 7 6.9% 48 8.8%
rs2072633 rs2072633 G/G 115 17.0% 0.0024* 48 19.2% 0.120 61 16.2% 0.0026* 6 11.8% 0.048 69 25.2%
G/A 323 47.7% 120 48.0% 178 47.3% 25 49.0% 134 48.9%
A/A 239 35.3% 82 32.8% 137 36.4% 20 39.2% 71 25.9%
Dominant model G/G 115 17.0% 0.0038* 48 19.2% 0.101 61 16.2% 0.0048* 6 11.8% 0.037 69 25.2%
GA + AA 562 83.0% 202 80.8% 315 83.8% 45 88.2% 205 74.8%
Recessive model A/A 239 35.3% 0.0051* 82 32.8% 0.083 137 36.4% 0.0045* 20 39.2% 0.052 71 25.9%
GA + GG 438 64.7% 168 67.2% 239 63.6% 31 60.8% 203 74.1%
Allele G 553 40.8% 0.0005* 216 43.2% 0.037 300 39.9% 0.0005* 37 36.3% 0.013 272 49.6%
A 801 59.2% 284 56.8% 452 60.1% 65 63.7% 276 50.4%
rs4151667 Genotype T/T 653 96.5% 0.386 241 96.4% 0.514 363 96.5% 0.412 49 96.1% 0.797 261 95.3%
A/T 24 3.5% 9 3.6% 13 3.5% 2 3.9% 13 4.7%
A/A 0 0.0% 0 0.0% 0 0.0% 0 0.0% 0 0.0%
Dominant mode T/T 653 96.5% 0.459 241 96.4% 0.664 363 96.5% 0.424 49 96.1% 0.797 261 95.3%
AT + AA 24 3.5% 9 3.6% 13 3.5% 2 3.9% 13 4.7%
Tanaka
et
al.
BMC
Ophthalm
ology
2014,
14
:83
Page
4
of
12
http://ww
w.biomedce
ntral.com/1
Table 2 Genotype and allele distributions in AMD patients and control group(Continued)
Recessive model A/A 0 0.0% - 0 0.0% - 0 0.0% - 0 0.0% - 0 0.0%
AT + TT 677 100.0% 250 100.0% 376 100.0% 51 100.0% 274 100.0%
Allele T 1330 98.2% 0.461 491 98.2% 0.667 739 98.3% 0.429 100 98.0% 0.779 535 97.6%
A 24 1.8% 9 1.8% 13 1.7% 2 2.0% 13 2.4%
AMD; age related macular degeneration tAMD; typical age related macular degeneration PCV; polypoidal choroidal vasculopathy RAP; retinal angiomatous proliferation.
P- values are for the comparison between cases and controls.
p- values for genotypes were calculated by Fisher’s exact test. (after Bonferroni correction *p < 0.0125).
Tanaka
et
al.
BMC
Ophthalm
ology
2014,
14
:83
Page
5
of
12
http://ww
w.biomedce
ntral.com/1
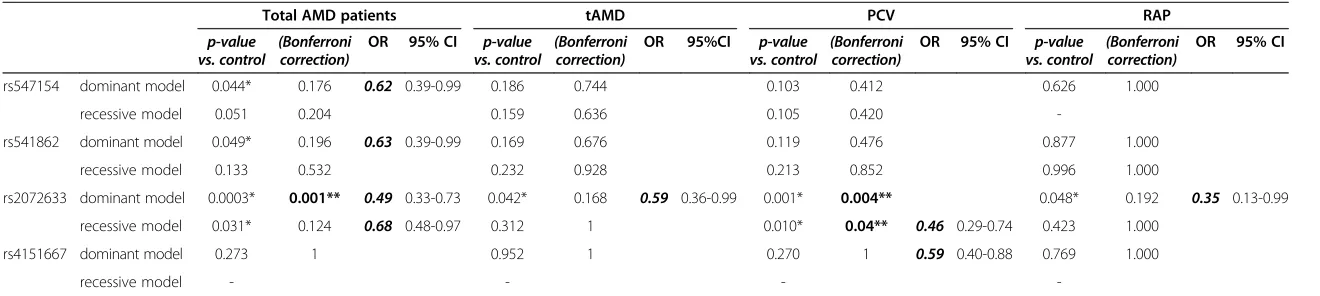
Table 3 Logistic regression analysis with adjustment for confounding factors
Total AMD patients tAMD PCV RAP
p-value
vs. control (Bonferronicorrection) OR 95% CI vs. controlp-value (Bonferronicorrection) OR 95%CI vs. controlp-value (Bonferronicorrection) OR 95% CI vs. controlp-value (Bonferronicorrection) OR 95% CI
rs547154 dominant model 0.044* 0.176 0.62 0.39-0.99 0.186 0.744 0.103 0.412 0.626 1.000
recessive model 0.051 0.204 0.159 0.636 0.105 0.420
-rs541862 dominant model 0.049* 0.196 0.63 0.39-0.99 0.169 0.676 0.119 0.476 0.877 1.000
recessive model 0.133 0.532 0.232 0.928 0.213 0.852 0.996 1.000
rs2072633 dominant model 0.0003* 0.001** 0.49 0.33-0.73 0.042* 0.168 0.59 0.36-0.99 0.001* 0.004** 0.048* 0.192 0.35 0.13-0.99
recessive model 0.031* 0.124 0.68 0.48-0.97 0.312 1 0.010* 0.04** 0.46 0.29-0.74 0.423 1.000
rs4151667 dominant model 0.273 1 0.952 1 0.270 1 0.59 0.40-0.88 0.769 1.000
recessive model - - -
-Logistic regression analysis was performed for each genotype with adjustment for confounding factors (age, gender, hypertension, diabetes mellitus and smoking). PCV; polypoidal choroidal vasculopathy.
OR; odds ratios CI; confidence intervals.
p-values are for the comparisons between cases and controls.
p-values for genotypes were calculated using Fisher’s exact test. *p < 0.05B. Bonferroni correction was performed for each of the genotypes. **p < 0.05. Blanks indicate that there were no siginificant differences.
Tanaka
et
al.
BMC
Ophthalm
ology
2014,
14
:83
Page
6
of
12
http://ww
w.biomedce
ntral.com/1
Table 2. Susceptibility genotypes were those with high fre-quencies in patient groups in case–control studies. The rs2072633 distribution of the controls differed significantly from those of the tAMD, PCV and RAP groups. After Bonferroni correction, only PCV showed significant differ-ence in this SNP.
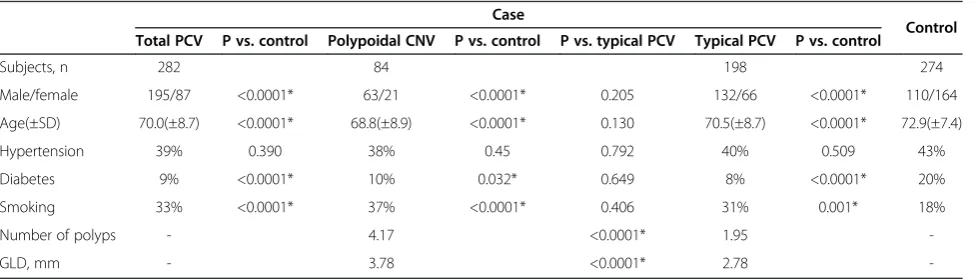
The clinical features of PCV patients and the control group are shown in Table 4. There were significant dif-ferences in polyp numbers and GLD, both of which were greater in polypoidal CNV group.
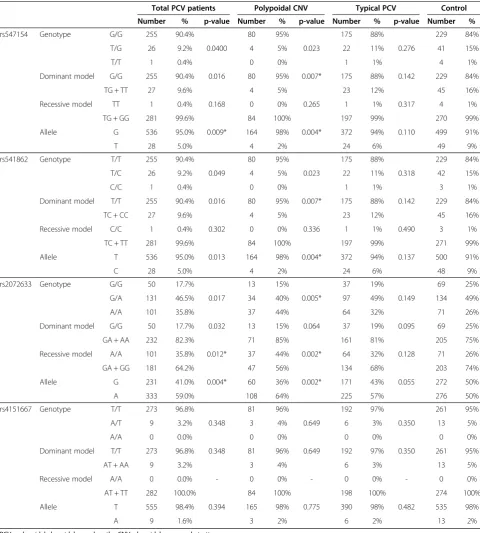
Distributions of genotypes and alleles of the four var-iants are shown in Table 5. Four varvar-iants were in Hardy-Weinberg equilibrium in the control group (data not shown, p > 0.05). There were significant dif-ferences in all genotype models and allele distributions
of rs547154 (C2 gene), rs541862 and rs2072633 (CFB
gene), but not rs4151667, between the polypoidal CNV group and the controls. However, there were no signifi-cant differences in any genotype model or allele distri-bution for any of the SNPs between the typical PCV and control groups.
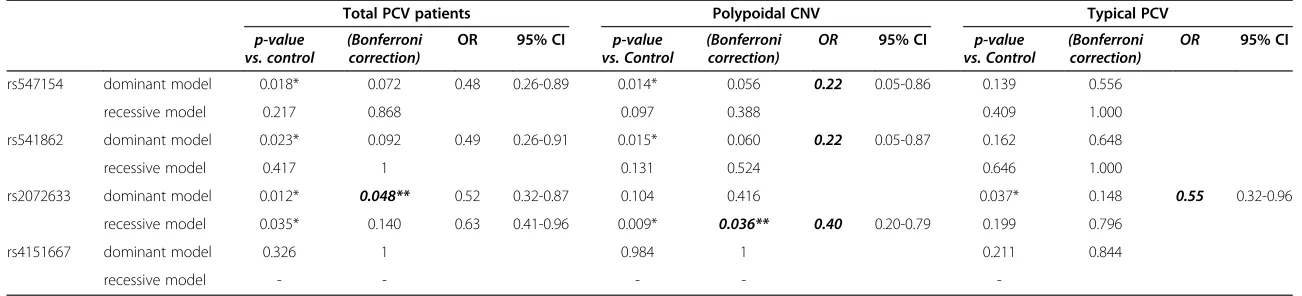
The results of logistic regression analysis, with ad-justment for confounding factors, including age, gen-der and risk factors, are shown in Tables 6 and 7. This analysis was performed for the dominant or recessive genotype models showing significant results, as pre-sented in Table 5. Susceptibility genotypes were those with high frequencies in patient groups in case–control studies. The distributions of rs541862, rs547154 and rs2072633 differed significantly between the controls and the polypoidal CNV group. After Bonferroni cor-rection, the distribution of rs2072633 remained signifi-cant only for polypoidal CNV, i.e. not for typical PCV. Logistic regression analysis was also performed to compare the polypoidal CNV and typical PCV groups. The only significant difference, after adjusting for con-founding factors such as polyp numbers and GLD, was
in rs2072633. After Bonferroni correction, no signifi-cant difference remained.
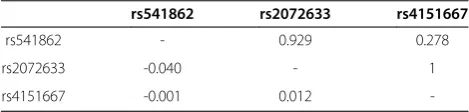
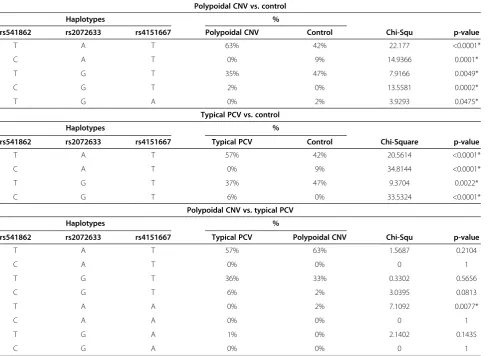
LD was assessed for three SNPs in CFB, and the dis-tribution of estimated haplotype frequencies is shown in Tables 8 and 9. The T-A-T(rs541862-rs2072633-rs4151667) and C-G-T haplotypes both showed strong associations in the polypoidal CNV, typical PCV and control groups. Furthermore, the T-A-A haplotype differed significantly between polypoidal CNV and typical PCV.
Discussion
ARMS2 genes, especially the rs10490924 of CFH and rs1061170, are both known as PCV susceptibility genes [24,25]. On the other hand, our group previ-ously reported that typical PCV did not correlate sig-nificantly with rs10490924 [19]. This result raised the possibility of two distinct genetic types of PCV. In the present study, the C2 gene and the CFB gene were also found to be associated with polypoidal CNV, in terms of both genotypes and allele distributions. No associations with typical PCV were detected. These results indicate the C2 and CFB genes to also be asso-ciated with PCV subtypes. Our group recently re-ported typical PCV to have the features of abnormal choroidal vessels and that polypoidal CNV also has features of neovascularization. The differences be-tween tAMD and polypoidal CNV were that the latter had polypoidal lesion detectable by IA, while tAMD had no polypoidal lesion. Furthermore, polypoidal CNV is characterized by a larger GLD and more polyps than typical PCV [18]. As polypoidal CNV has neovascularization features, the ARMS2 gene might be highly associated with neovascularization. Though there are reports describing rs4151667 as being asso-ciated with AMD, the minor allele homozygous fre-quency was very low in all of these reports [9,10]. In this
Table 4 Characteristics of PCV participants
Case
Control Total PCV P vs. control Polypoidal CNV P vs. control P vs. typical PCV Typical PCV P vs. control
Subjects, n 282 84 198 274
Male/female 195/87 <0.0001* 63/21 <0.0001* 0.205 132/66 <0.0001* 110/164
Age(±SD) 70.0(±8.7) <0.0001* 68.8(±8.9) <0.0001* 0.130 70.5(±8.7) <0.0001* 72.9(±7.4)
Hypertension 39% 0.390 38% 0.45 0.792 40% 0.509 43%
Diabetes 9% <0.0001* 10% 0.032* 0.649 8% <0.0001* 20%
Smoking 33% <0.0001* 37% <0.0001* 0.406 31% 0.001* 18%
Number of polyps - 4.17 <0.0001* 1.95
-GLD, mm - 3.78 <0.0001* 2.78
-p-values reflect comparisons between each of the case groups and the control group, calculated using Fisher’s exact test *p < 0.05. PCV; polypoidal choroidal vasculopathy CNV; choroidal neovascularization GLD; greatest linear dimension SD; standard deviation.
Tanakaet al. BMC Ophthalmology2014,14:83 Page 7 of 12
study, the minor allele homozygous frequency of rs4151667 was zero, such that there was no difference between cases and controls.
Nakata et al. reported the C2 (rs547154) and CFB (rs541862) genes to be significantly associated with both
tAMD and PCV in the Japanese population [13]. Never-theless, rs2072633 (CFB gene) and rs4151672 (CFB gene) showed no correlations with either tAMD or PCV. In the present study, we showed rs2072633 to be signifi-cantly associated with PCV. This result indicates the
Table 5 Genotype and allele distributions in PCV patients and control group
Total PCV patients Polypoidal CNV Typical PCV Control
Number % p-value Number % p-value Number % p-value Number %
rs547154 Genotype G/G 255 90.4% 80 95% 175 88% 229 84%
T/G 26 9.2% 0.0400 4 5% 0.023 22 11% 0.276 41 15%
T/T 1 0.4% 0 0% 1 1% 4 1%
Dominant model G/G 255 90.4% 0.016 80 95% 0.007* 175 88% 0.142 229 84%
TG + TT 27 9.6% 4 5% 23 12% 45 16%
Recessive model TT 1 0.4% 0.168 0 0% 0.265 1 1% 0.317 4 1%
TG + GG 281 99.6% 84 100% 197 99% 270 99%
Allele G 536 95.0% 0.009* 164 98% 0.004* 372 94% 0.110 499 91%
T 28 5.0% 4 2% 24 6% 49 9%
rs541862 Genotype T/T 255 90.4% 80 95% 175 88% 229 84%
T/C 26 9.2% 0.049 4 5% 0.023 22 11% 0.318 42 15%
C/C 1 0.4% 0 0% 1 1% 3 1%
Dominant model T/T 255 90.4% 0.016 80 95% 0.007* 175 88% 0.142 229 84%
TC + CC 27 9.6% 4 5% 23 12% 45 16%
Recessive model C/C 1 0.4% 0.302 0 0% 0.336 1 1% 0.490 3 1%
TC + TT 281 99.6% 84 100% 197 99% 271 99%
Allele T 536 95.0% 0.013 164 98% 0.004* 372 94% 0.137 500 91%
C 28 5.0% 4 2% 24 6% 48 9%
rs2072633 Genotype G/G 50 17.7% 13 15% 37 19% 69 25%
G/A 131 46.5% 0.017 34 40% 0.005* 97 49% 0.149 134 49%
A/A 101 35.8% 37 44% 64 32% 71 26%
Dominant model G/G 50 17.7% 0.032 13 15% 0.064 37 19% 0.095 69 25%
GA + AA 232 82.3% 71 85% 161 81% 205 75%
Recessive model A/A 101 35.8% 0.012* 37 44% 0.002* 64 32% 0.128 71 26%
GA + GG 181 64.2% 47 56% 134 68% 203 74%
Allele G 231 41.0% 0.004* 60 36% 0.002* 171 43% 0.055 272 50%
A 333 59.0% 108 64% 225 57% 276 50%
rs4151667 Genotype T/T 273 96.8% 81 96% 192 97% 261 95%
A/T 9 3.2% 0.348 3 4% 0.649 6 3% 0.350 13 5%
A/A 0 0.0% 0 0% 0 0% 0 0%
Dominant model T/T 273 96.8% 0.348 81 96% 0.649 192 97% 0.350 261 95%
AT + AA 9 3.2% 3 4% 6 3% 13 5%
Recessive model A/A 0 0.0% - 0 0% - 0 0% - 0 0%
AT + TT 282 100.0% 84 100% 198 100% 274 100%
Allele T 555 98.4% 0.394 165 98% 0.775 390 98% 0.482 535 98%
A 9 1.6% 3 2% 6 2% 13 2%
PCV; polypoidal choroidal vasculopathy CNV; choroidal neovascularization.
p- values are for the comparison between cases and controls.
p- values for genotypes were calculated by Fisher’s exact test. (after Bonferroni correction *p < 0.0125).
Tanakaet al. BMC Ophthalmology2014,14:83 Page 8 of 12
Table 6 Logistic regression analysis between cases and controls
Total PCV patients Polypoidal CNV Typical PCV
p-value
vs. control (Bonferronicorrection) OR 95% CI vs. Controlp-value (Bonferronicorrection) OR 95% CI vs. Controlp-value (Bonferronicorrection) OR 95% CI
rs547154 dominant model 0.018* 0.072 0.48 0.26-0.89 0.014* 0.056 0.22 0.05-0.86 0.139 0.556
recessive model 0.217 0.868 0.097 0.388 0.409 1.000
rs541862 dominant model 0.023* 0.092 0.49 0.26-0.91 0.015* 0.060 0.22 0.05-0.87 0.162 0.648
recessive model 0.417 1 0.131 0.524 0.646 1.000
rs2072633 dominant model 0.012* 0.048** 0.52 0.32-0.87 0.104 0.416 0.037* 0.148 0.55 0.32-0.96
recessive model 0.035* 0.140 0.63 0.41-0.96 0.009* 0.036** 0.40 0.20-0.79 0.199 0.796
rs4151667 dominant model 0.326 1 0.984 1 0.211 0.844
recessive model - - - -
-Logistic regression analysis was performed for each genotype with adjustment for confounding factors (age, gender, hypertension, diabetes mellitus and smoking). PCV; polypoidal choroidal vasculopathy.
OR; odds ratios CI; confidence intervals.
p-values are for comparisons between cases and controls.
p-values for genotypes were calculated using Fisher’s exact test. *p < 0.05.
Bonferroni correction was performed for each of the genotypes. **p < 0.05.
Blanks indicate that there were no siginificant differences.
Tanaka
et
al.
BMC
Ophthalm
ology
2014,
14
:83
Page
9
of
12
http://ww
w.biomedce
ntral.com/1
CFB genes to be associated with PCV. Before Bonferroni correction, tAMD was also associated with rs547154 and rs2072633. We previously reported that polypoidal CNV resembles tAMD, while typical PCV clearly differs from CNV. Though not significant after Bonferroni correc-tion, given the prior reports dividing PCV into two types, we can reasonably speculate that the C2 and CFB genes might be related to tAMD and polypoidal CNV but not to typical PCV. The present C2 and CFB gene results also are not inconsistent with this possibility. Since typical PCV was not associated with any of the SNPs tested, we can also speculate that typical PCV might differ genetically from AMD.
C2 and CFB functioned as activators of the comple-ment cascade. CFB is localized to the choroidal
vascula-ture and Bruch’s membrane [26]. Smailhodzic et al.
reported AMD patients to show increased alternative pathway activation and elevated CFB levels [27]. Scholl et al. also showed plasma CFB to be significantly ele-vated in AMD patients [28]. For these reasons, AMD might be related to CFB.
Recently, Liu et al. reported the C2-CFB-RDBP-SKIV2L region of SNPs to be associated only with tAMD, not with PCV. They concluded that the mecha-nisms underlying the development of tAMD and PCV
might be different [29]. Nakashizuka et al. reported histopathological characteristics of PCV [17]. In their re-port, areas of PCV showed little fibrosis or granulation as compared to those with CNV. This might indicate that typical PCV involves less inflammation than CNV. Since polypoidal CNV has AMD features, C2 and CFB might be related only to polypoidal CNV.
The results presented in Table 8 show that three of the SNPs in CFB were in LD block. Haplotypes T-A-T and T-G-T differed significantly between the PCV and control groups. Furthermore, T-A-T would confer a risk for PCV, while T-G-T would be pro-tective against PCV development. We could reason-ably draw the same conclusion for haplotypes C-A-T and C-G-T. These results indicate that rs2072633 might be one of the key SNPs favoring PCV development.
There has been controversy regarding the division of PCV into two subtypes. Tsujikawa et al. reported that if there is risk associated with being homozygous for the ARMS2 gene, it would be the larger GLD in PCV [30]. Their report described two types of PCV, with larger GLD and smaller GLD. The aforementioned report by Miki and colleagues presented results very similar to ours, indicating the ARMS2 gene to have no association with typical PCV [21]. These two reports also support the assumption that the ARMS2 gene is unrelated to PCV [17,18]. While IA findings of polypoidal CNV ap-peared to be consistent with CNV, the histopathological and IA features of typical PCV showed choroidal vascu-lature abnormalities. These observations suggested poly-poidal CNV to be genetically and histopathologically close to tAMD, a representative form of CNV. Further-more, typical PCV showed no association with CNV.
Table 7 Logistic regression analysis between polypoidal CNV and typical PCV
Polypoidal CNV
p-value vs. typical PCV (Bonferroni correction) OR 95%CI
rs547154 dominant model 0.073 0.292
recessive model 0.392 1
rs541862 dominant model 0.073 0.292
recessive model 0.392 1
rs2072633 dominant model 0.720 1
recessive model 0.038* 0.152 2.09 1.04-4.22
rs4151667 dominant model 0.915 1
recessive model -
-Logistic regression analysis was performed for each genotype with adjustment for confounding factors (age, gender, hypertension, diabetes mellitus and smoking).
OR; odds ratios CI; confidence intervals GLD; greatest linear dimension.
p-values are for the comparisons between polypoidal CNV and typical PCV.
p-values for genotypes were calculated using Fisher’s exact test. *p < 0.05.
Bonferroni correction were performed for each genotypes. p < 0.05.
Blanks indicate that there were no siginificant differences.
Table 8 Linkage disequilibrium map through 3 SNPs in CFB gene
rs541862 rs2072633 rs4151667
rs541862 - 0.929 0.278
rs2072633 -0.040 - 1
rs4151667 -0.001 0.012
-The upper right shows the D’-value, the lower left the D-value.
Tanakaet al. BMC Ophthalmology2014,14:83 Page 10 of 12
The small sample size with only one genotype is the major limitation of this study. Further study is clearly needed.
Conclusion
The present study is the first to examine the associations between variants in the C2 and CFB genes and PCV sub-types. We found the C2 and CFB genes to possibly be genetic markers for polypoidal CNV. Furthermore, these variants showed no associations with typical PCV. These results suggest polypoidal CNV to have a genetic back-ground different from that of typical PCV. Further stud-ies are needed to examine the effects of various treatments on PCV subtypes.
Abbreviations
PCV:Polypoidal choroidal vasculopathy; CNV: Choroidal neovascularization; C2: Complement component 2; CFB: Complement factor B; AMD: related macular degeneration; CFH: Complement factor H; ARMS2: Age-related maculopathy susceptibility 2; HTRA1: High-temperature requirement factor A1; tAMD: Typical AMD; IA: Indocyanine green angiography; GLD: Greatest linear dimension.
Competing interests
The authors have no competing interests to declare.
Authors’contributions
KT, TN and MY participated in the design of this study. KT and NS participated in the laboratory work. RM and AK were responsible for participants’enrollment. KT performed the statistical analysis and wrote the draft manuscript. All authors read and approved the final manuscript.
Acknowledgments
We would like to thank all patients who participated in this study. This work was funded in part by the Research Committee on Chorioretinal
Degenerations and Optic Atrophy, and by The Ministry of Health and Welfare of Japan (Mitsuko Yuzawa).
Author details
1Department of Ophthalmology, Nihon University School of Medicine, 1-8-13
Kandasurugadai, Chiyoda-ku, Tokyo 101-8309, Japan.2Department of Pathology and Microbiology, Nihon University School of Medicine, Tokyo, Japan.
Received: 10 March 2014 Accepted: 9 June 2014 Published: 25 June 2014
Table 9 Haplotype association analysis in cases and controls
Polypoidal CNV vs. control
Haplotypes %
rs541862 rs2072633 rs4151667 Polypoidal CNV Control Chi-Squ p-value
T A T 63% 42% 22.177 <0.0001*
C A T 0% 9% 14.9366 0.0001*
T G T 35% 47% 7.9166 0.0049*
C G T 2% 0% 13.5581 0.0002*
T G A 0% 2% 3.9293 0.0475*
Typical PCV vs. control
Haplotypes %
rs541862 rs2072633 rs4151667 Typical PCV Control Chi-Square p-value
T A T 57% 42% 20.5614 <0.0001*
C A T 0% 9% 34.8144 <0.0001*
T G T 37% 47% 9.3704 0.0022*
C G T 6% 0% 33.5324 <0.0001*
Polypoidal CNV vs. typical PCV
Haplotypes %
rs541862 rs2072633 rs4151667 Typical PCV Polypoidal CNV Chi-Squ p-value
T A T 57% 63% 1.5687 0.2104
C A T 0% 0% 0 1
T G T 36% 33% 0.3302 0.5656
C G T 6% 2% 3.0395 0.0813
T A A 0% 2% 7.1092 0.0077*
C A A 0% 0% 0 1
T G A 1% 0% 2.1402 0.1435
C G A 0% 0% 0 1
*p-value > 0.05 calculated by chi-square analysis.
Tanakaet al. BMC Ophthalmology2014,14:83 Page 11 of 12
References
1. Yasuda M, Kiyohara Y, Hata Y, Arakawa S, Yonemoto K, Doi Y, Iida M, Ishibashi T:Nine-year incidence and risk factors for age-related macular degeneration in a defined Japanese population the Hisayama study. Ophthalmology2009,116:2135–2140. PubMed.
2. Sperduto RD, Hiller R:Systemic hypertension and age-related maculopathy in the Framingham Study.Arch Ophthalmol1986,104:216–219. PubMed. 3. Klein R, Klein BE, Linton KL, DeMets DL:The beaver dam eye study: the
relation of age-related maculopathy to smoking.Am J Epidemiol1993, 137:190–200. PubMed.
4. Klein RJ, Zeiss C, Chew EY, Tsai JY, Sackler RS, Haynes C, Henning AK, SanGiovanni JP, Mane SM, Mayne ST, Bracken MB, Ferris FL, Ott J, Barnstable C, Hoh J:Complement factor H polymorphism in age-related macular degeneration.Science2005,308:385–389. PubMed.
5. Rivera A, Fisher SA, Fritsche LG, Keilhauer CN, Lichtner P, Meitinger T, Weber BH: Hypothetical ARMS2 is a second major susceptibility gene for age-related macular degeneration, contributing independently of complement factor H to disease risk.Hum Mol Genet2005,14:3227–3236. PubMed.
6. Dewan A, Liu M, Hartman S, Zhang SS, Liu DT, Zhao C, Tam PO, Chan WM, Lam DS, Snyder M, Barnstable C, Pang CP, Hoh J:HTRA1 promoter polymorphism in wet age-related macular degeneration.Science2006, 314:989–992. PubMed.
7. Yoshida T, DeWan A, Zhang H, Sakamoto R, Okamoto H, Minami M, Obazawa M, Mizota A, Tanaka M, Saito Y, Takagi I, Hoh J, Iwata T:HTRA1 promoter polymorphism predisposes Japanese to age-related macular degeneration.Mol Vis2007,13:545–548. PubMed.
8. Gold B, Merriam JE, Zernant J, Hancox LS, Taiber AJ, Gehrs K, Cramer K, Neel J, Bergeron J, Barile GR, Smith RT, AMD Genetics Clinical Study Group, Hageman GS, Dean M, Allikmets R:Variation in factor B (BF) and complement component 2 (C2) genes is associated with age-related macular degeneration.Nat Genet2006,38:458–462. PubMed.
9. Lima LH, Schubert C, Ferrara DC, Merriam JE, Imamura Y, Freund KB, Spaide RF, Yannuzzi LA, Allikmets R:Three major loci involved in age-related macular degeneration are also associated with polypoidal choroidal vasculopathy. Ophthalmology2010,117:1567–1570. PubMed.
10. Sun C, Zhao M, Li X:CFB/C2 gene polymorphisms and risk of age-related macular degeneration: a systematic review and meta-analysis.Curr Eye Res2012,37:259–271. PubMed.
11. Lee KY, Vithana EN, Mathur R, Yong VH, Yeo IY, Thalamuthu A, Lee MW, Koh AH, Lim MC, How AC, Wong DW, Aung T:Association analysis of CFH, C2, BF, and HTRA1 gene polymorphisms in Chinese patients with polypoidal choroidal vasculopathy.Invest Ophthalmol Vis Sci2008,49:2613–2619. PubMed. 12. Kondo N, Honda S, Kuno S, Negi A:Role of RDBP and SKIV2L variants in the
major histocompatibility complex class III region in polypoidal choroidal vasculopathy etiology.Ophthalmology2009,116:1502–1509. PubMed. 13. Nakata I, Yamashiro K, Yamada R, Gotoh N, Nakanishi H, Hayashi H,
Akagi-Kurashige Y, Tsujikawa A, Otani A, Saito M, Iida T, Oishi A, Matsuo K, Tajima K, Matsuda F, Yoshimura N:Significance of C2/CFB variants in age-related macular degeneration and polypoidal choroidal vasculopathy in a Japanese population.Invest Ophthalmol Vis Sci2012,53:794–798. PubMed.
14. Spaide RF, Yannuzzi LA, Slakter JS, Sorenson J, Orlach DA:Indocyanine green videoangiography of idiopathic polypoidal choroidal vasculopathy.Retina1995,15:100–110. PubMed.
15. Takahashi K, Ishibashi T, Ogura Y, Yuzawa M:Classification and diagnostic criteria of age-related macular degeneration; working group for estab-lishing diagnostic criteria for age-related macular degeneration. Nippon Ganka Gakkai Zasshi2008,112:1076–1084. in Japanese, with English abstract) [PubMed].
16. Yuzawa M, Mori R, Kawamura A:The origins of polypoidal choroidal vasculopathy.Br J Ophthalmol2005,89:602–607. PubMed.
17. Nakashizuka H, Mitsumata M, Okisaka S, Shimada H, Kawamura A, Mori R, Yuzawa M:Clinicopathologic findings in polypoidal choroidal vasculopathy.Invest Ophthalmol Vis Sci2008,49:4729–4737. PubMed. 18. Kawamura A, Yuzawa M, Mori R, Haruyama M, Tanaka K:Indocyanine green
angiographic and optical coherence tomographic findings support classification of polypoidal choroidal vasculopathy into two types. Acta Ophthalmol2013,91:e474–e481. PubMed.
19. Tanaka K, Nakayama T, Mori R, Sato N, Kawamura A, Mizutani Y, Yuzawa M: Associations of complement factor H(CFH) and age-related maculopathy susceptibility 2(ARMS2) genotypes with subtypes of polypoidal choroidal vasculopathy.Invest Ophthalmol Vis Sci2011,52:7441–7444. PubMed.
20. Okubo A, Hirakawa M, Ito M, Sameshima M, Sakamoto T:Clinical features of early and late stage polypoidal choroidal vasculopathy characterized by lesion size and disease duration.Graefes Arch Clin Exp Ophthalmol
2008,246:491–499. PubMed.
21. Miki A, Honda S, Kondo N, Negi A:The association of age-related maculo-pathy susceptibility 2(ARMS2) and complement factor H(CFH) variants with two angiographic subtypes of polypoidal choroidal vasculopathy. Ophthalmic Genet2013,34:146–150. PubMed.
22. Mizutani Y, Nakayama T, Asai S:Study on the association between angioid streaks and ABCC6 as the causal gene of pseudoxanthoma elasticum. Int J Biomed Sci2006,2:9–14.
23. Sato N, Nakayama T, Mizutani Y, Yuzawa M:Novel mutations of ABCC6 gene in Japanese patients with angioid streaks.Biochem Biophys Res Commun2009,380:548–553. PubMed.
24. Gotoh N, Nakanishi H, Hayashi H, Yamada R, Otani A, Tsujikawa A, Yamashiro K, Tamura H, Saito M, Saito K, Iida T, Matsuda F, Yoshimura N: ARMS2 (LOC387715) variants in Japanese patients with exudative age-related macular degeneration and polypoidal choroidal vasculopathy. Am J Ophthalmol2009,147:1037–1041. PubMed.
25. Hayashi H, Yamashiro K, Gotoh N, Nakanishi H, Nakata I, Tsujikawa A, Otani A, Saito M, Iida T, Matsuo K, Tajima K, Yamada R, Yoshimura N:CFH and ARMS2 variations in age-related macular degeneration, polypoidal choroidal vasculopathy, and retinal angiomatous proliferation.Invest Ophthalmol Vis Sci2010,51:5914–5919. PubMed.
26. Loyet KM, Deforge LE, Katschke KJ Jr, Diehl L, Graham RR, Pao L, Sturgeon L, Lewin-Koh SC, Hollyfield JG, van Lookeren Campagne M:Activation of the alternative complement pathway in vitreous is controlled by genetics in age-related macular degeneration.Invest Ophthalmol Vis Sci2012, 53:6628–6637. PubMed.
27. Smailhodzic D, Klaver CC, Klevering BJ, Boon CJ, Groenewoud JM, Kirchhof B, Daha MR, den Hollander AI, Hoyng CB:Risk alleles in CFH and ARMS2 are independently associated with systemic complement activation in age related macular degeneration.Ophthalmology2012,119:339–346. PubMed.
28. Scholl HP, Charbel Issa P, Walier M, Janzer S, Pollok-Kopp B, Börncke F, Fritsche LG, Chong NV, Fimmers R, Wienker T, Holz FG, Weber BH, Oppermann M: Systemic complement activation in age-related macular degeneration. PLos One2008,3:2593. PubMed.
29. Liu K, Chen LJ, Tam PO, Shi Y, Lai TY, Liu DT, Chiang SW, Yang M, Yang Z, Pang CP:Associations of the C2-CFB-RDBP-SKIV2L locus with age-related macular degeneration and polypoidal choroidal vasculopathy. Ophthalmology2013,120:837–884. PubMed.
30. Tsujikawa A, Ojima Y, Yamashiro K, Nakata I, Ooto S, Tamura H, Nakanishi H, Hayashi H, Otani A, Yoshimura N:Association of lesion size and visual prognosis to polypoidal choroidal vasculopathy.Am J Ophthalmol2011, 151:961–972. PubMed.
doi:10.1186/1471-2415-14-83
Cite this article as:Tanakaet al.:Associations of complement factor B
and complement component 2 genotypes with subtypes of polypoidal
choroidal vasculopathy.BMC Ophthalmology201414:83.
Submit your next manuscript to BioMed Central and take full advantage of:
• Convenient online submission
• Thorough peer review
• No space constraints or color figure charges
• Immediate publication on acceptance
• Inclusion in PubMed, CAS, Scopus and Google Scholar
• Research which is freely available for redistribution
Submit your manuscript at www.biomedcentral.com/submit
Tanakaet al. BMC Ophthalmology2014,14:83 Page 12 of 12