DEMOGRAPHIC RESEARCH
VOLUME 30, ARTICLE 33, PAGES 925-962
PUBLISHED 26 MARCH 2014
http://www.demographic-research.org/Volumes/Vol30/33/ DOI: 10.4054/DemRes.2014.30.33
Research Article
The mid-twentieth century Baby Boom and the
changing educational gradient in Belgian cohort
fertility
Jan Van Bavel
This publication is part of the Special Collection on “Socioeconomic status and fertility before, during and after the demographic transition”, organized by Guest Editors Martin Dribe, Michel Oris, and Lucia Pozzi.
© 2014 Jan Van Bavel.
This open-access work is published under the terms of the Creative Commons Attribution NonCommercial License 2.0 Germany, which permits use, reproduction & distribution in any medium for non-commercial purposes, provided the original author(s) and source are given credit.
1 Introduction 926
2 The expansion of female education and reproductive behaviour 928
3 The context of the Belgian Baby Boom 930
4 Data and methods 931
4.1 The 1981 Census as a retrospective data source: potential sources of bias
932
4.2 General versus education-specific biases 936
4.3 Methods 937
5 Results 939
5.1 Completed fertility 939
5.2 Marriage, extra-marital childbearing, and childlessness 942
5.3 Age at first birth 946
5.4 Quantum distribution 948
6 Conclusion and discussion 952
7 Acknowledgements 955
The mid-twentieth century Baby Boom and the changing
educational gradient in Belgian cohort fertility
Jan Van Bavel1
Abstract
BACKGROUND
The historical transition towards low fertility in many Western countries was interrupted during the period around the 1950s and ‘60s, called the Baby Boom. This upturn in fertility was completely unanticipated. One of the reasons for expecting continued fertility decline rather than fertility recovery was the expansion of female participation in higher education.
OBJECTIVE
This research investigates how the recovery of fertility and declining ages at first birth observed during the Baby Boom era can be reconciled with the expansion of female participation in education. How did the pre-existing negative educational gradient in fertility evolve in the cohorts that produced the Baby Boom?
METHODS
Using Belgian 1981 Census data, I estimate retrospective measures of cohort fertility. Potential sources of bias in the retrospective data are discussed. Trends in timing and quantum components are charted by women’s levels of educational attainment for cohorts born between 1901 and 1940. A counterfactual simulation is used to delineate the role played by the changing educational gradient in completed fertility.
RESULTS
The recovery of fertility was pervasive in Belgium, but there was a clear convergence between educational groups in terms of the quantum of fertility. Both low and high parity births increased: childlessness declined particularly among the highly educated while the share of women with three or more births went up in all educational groups, but most sharply among the highly educated. The educational gradient in completed fertility was strongly reduced. Without this shift, the recovery of completed fertility would have been about 25% less than its actual magnitude. The educational gradient for
1 Centre for Sociological Research, University of Leuven (KU Leuven), Belgium.
age at first birth remained stable: ages at first childbirth declined across all levels of educational attainment.
CONCLUSIONS
Convergence in the quantum of fertility across educational groups suggests a major weakening of the role incompatibility between obtaining a degree in higher education on the one hand and subsequently getting married and having children on the other hand. Declining ages at first marriage and childbirth indicate that this period was generally conducive to family formation. The reduction in the educational gradient was a crucial ingredient of the emergence of today’s fertility patterns.
1. Introduction
In many Western countries, the transition from medium-high to low fertility that occurred from late nineteenth to the late twentieth century was interrupted during the period around the 1950s and ‘60s known as the Baby Boom. Increased childbearing during that era remains enormously consequential through its impact on current population aging. Yet, we know surprisingly little about the causes of the Baby Boom. At the time when it occurred, no one was expecting it. Today, most textbooks routinely ascribe the revival of fertility to the air of optimism and economic growth in the wake of the low fertility trough of the Great Depression. Yet, the recovery of fertility was already underway before and during the Second World War in most countries. Significantly, only a small part of the Boom can be explained by the timing mechanisms of postponement (during the Depression era) and recuperation (in times of post-war optimism). It also clearly involved a recovery of cohort fertility (Van Bavel and Reher 2013).
The end of the Baby Boom was just as unexpected as its start. Indeed, by the 1960s, pro-cyclical fertility was considered one of the most firmly based empirical findings in the social sciences. Around 1960, mainstream demography was predicting that further fertility increases would accompany continuing economic growth (Butz and Ward 1979: 318). That did not happen, however, and the post-hoc explanations given for subsequent fertility decline were very similar to the ones given for low and declining fertility before the Second World War (Van Bavel 2010).
emphasizes the importance of relative cohort size for fertility outcomes. Other explanations have emphasized the role of female labour, especially during the war (Doepke et al. 2007; or, more generally, Macunovich 1996); the links between fertility, income, and subjective well-being (Thornton 1978); the role of parents, especially fathers (Rutherdale 1999); or technological progress in the household sector (Greenwood et al. 2005). Most of the attention has gone to economic factors with less emphasis on the importance of ideational and cultural change (with notable exceptions, including Lesthaeghe and Surkyn 1988).
There are some indications for European countries that social differences became smaller during the Baby Boom era (Glass 1968: 118-120; Festy 1979: 167-168), while evidence from the USA indicates that the recovery of fertility was pervasive across educational as well as racial groups (Rindfuss and Sweet 1977). Also, it became evident that married women's gainful employment played an important role in explaining the social gradient in fertility, at least in a number of countries, with working wives having lower fertility (Glass 1968: 120). But most studies about the Baby Boom use time series of country-level indicators of fertility, leaving the social heterogeneity of reproductive change within countries unaddressed.
This paper addresses this important gap in the literature by investigating fertility differentials by women’s level of educational attainment. To date, we lack insight into the relationship between women’s education and fertility trends during the Baby Boom era. This was an era when female participation in higher education started to expand in many countries (Schofer and Meyer 2005), including Belgium, the focus of this analysis (Vanherck and Verbruggen 1991). Given what we know today about the negative relation between women’s educational attainment and fertility (Lappegård and Rønsen 2005; Balbo et al. 2013), the expected result of rising female enrolment in higher education would have been the postponement of first births and fertility decline – and experts at the time were indeed expecting continued fertility decline (Van Bavel 2010). Yet, many countries, including Belgium, experienced declining ages at first birth and a Baby Boom instead (Van Bavel and Reher 2013). How can we reconcile women’s increasing participation in higher education with increasing fertility and declining ages at first birth? How did the educational gradient in fertility evolve in the cohorts that produced the Baby Boom?
range of countries. Compared with other Western countries, Belgium experienced a Baby Boom that was neither particularly strong, nor particularly weak (Van Bavel and Reher 2013). The 1981 Belgian census microdata became available for research only quite recently (Willaert and Deboosere 2008). The data are very rich in terms of coverage of family formation behaviour, recording not just quantum but also timing dimensions.
2. The expansion of female education and reproductive behaviour
Over the course of the 20th century, participation in secondary and post-secondary education expanded tremendously worldwide, but particularly in the West (Boli et al. 1985; Aldcroft 1998; Schofer and Meyer 2005; Lutz et al. 2007). Male participation in higher education expanded and women’s participation even more so. Until the 20th century, university education remained almost exclusively a male privilege. In the US, there were about as many women as men with “any college” in the cohorts born in the late nineteenth and early twentieth century because many women enrolled in two-year teacher’s colleges, but they lagged behind in terms of bachelor’s degrees (Goldin, Katz, and Kuziemko 2006). In Europe, female university attendance was rare. The University of Oxford and the University of Leuven, two of the oldest European universities, granted women the permission to enrol only in 1920 (Howarth 1994; De Neef 1985).
Around 1950, participation in higher education worldwide was still very low for both sexes but, still, enrolment rates for men were more than double those for women (around 2.5% and 1.0% for men and women, respectively; Schofer and Meyer 2005). From the 1960s onwards, participation in tertiary education rapidly expanded. Initially, this expansion disproportionately involved men, leading to a widening of the gender gap in higher education. However, from the 1970s onwards, the gap began to shrink (Schofer and Meyer 2005; Goldin et al. 2006).
Eventually the expansion of education among women led to increasing rates of female labour force participation (Pott-Buter 1993; Brewster and Rindfuss 2000; Blossfeld and Drobnič 2001; Goldin 2004; Beller 2009). In the middle of the twentieth century, female labour market participation was particularly low, with participation rates ranging between 20% and 30% for women as compared to at least 60% for men in Western European countries around 1950 (Pott-Buter 1993: 21−24). Labour market participation was even lower among married women, particularly in the middle and upper classes (Pott-Buter 1993: 197−209).
the same time. On the marriage market, college educated women were far more likely to marry a college-educated man, but in the labour market, married woman were not expected to remain employed. Thus economic returns to education accrued more frequently to single women. This pattern holds for the US (Goldin et al. 2006) as well as for European countries (Pott-Buter 1993), including Belgium (Lambrechts 1979). Still, an important driver of the expansion of women’s education was the increased relative demand for female office workers in the early 20th century. These were considered relatively “nice” jobs that were acceptable for women from “respectable” families, in contrast to factory work. Part-time work became more available and institutional regulations that barred married women from employment, where they existed, were gradually abolished. These developments stimulated the continued labour force participation of women after marriage (for Belgium, see Lambrechts 1979; for the US, see Goldin 2006).
Based on both the empirical and theoretical literature about education and fertility, one should have expected further fertility decline in the middle of the twentieth century – and “women’s emancipation” was indeed one of the reasons for experts to forecast further fertility decline (Van Bavel 2010). Empirically, Skirbekk (2008) concludes from a meta-analysis of published studies that the association between female education and fertility has always been negative as far as the historical record goes, i.e. from early in the 20th century onwards. Theoretically, the conventional explanation is that the negative price effects of children (i.e. the opportunity costs of childbearing) outweigh the positive income effects of education on fertility for women (but not for men) (Kravdal 1994; Gustafsson 2001; Joshi 2002; Kravdal and Rindfuss 2008) – although more recent evidence about contemporary dual-career, high income couples in Sweden indicates that this does not always need to be the case (Dribe and Stanfors 2010; Tesching 2012).
the US (Goldin 2004). This would signal that the group of women with a high level of education became less selective in terms of family behaviour. A final possibility would be that rising fertility was pervasive among all educational groups, maintaining the educational gradient but with elevated fertility in all groups.
3. The context of the Belgian Baby Boom
From a comparative perspective, Belgium experienced a moderate Baby Boom: its crude birth rate grew from a pre-war minimum of 15.0 births per thousand in 1937 to a post-war maximum of 17.6 per thousand in 1959. In terms of the extent of recovery of the underlying period total fertility, the country ranked in the middle of the group of Western countries, with a 40% growth of the period TFR, from a pre-war low of 1.94 in 1935 to a post-war high of 2.71 in 1964 (Van Bavel and Reher 2013). Cohort total fertility boomed as well, from 2.0 children per woman in the cohorts born during the first decades of the 20th century to 2.3 children per women in the cohorts born in the early 1930s (Sardon 1991).
Belgium participated in both the First and the Second World War and was occupied by German forces both times. While Belgium and the neighbouring Netherlands were more or less equal in terms of GDP per capita and in terms of growth rates before the First World War, and while in 1913 the income per capita was distinctly higher in Belgium than in France or Germany, Belgian growth rates slowed down afterwards. The country was hit hard by the Great Depression, although with some delay compared to other countries, bottoming out only in 1935. Afterwards, the recovery was quite hesitant. Since the backbone of the Belgian economy was the export of semi-finished products from the metal, glass, and textiles industry along with coalmining, the country suffered hard from the collapse of international trade. Employment in industry declined nearly 7% between 1930 and 1937, the equivalent of almost 78,000 jobs lost. The number of new jobs created during this period in trade, just under 9,500, could not compensate for this. There was hardly any improvement before the war (Vanthemsche 1988: 328−329).
Female labour force participation fell to historically low levels before 1950. A large part of the explanation is that employment opportunities in agriculture continued to decline – a trend that had started already in the nineteenth century – while women were disproportionately concentrated in this sector. Other sectors where women were particularly active, like hotel and personal services, were hit hard by the economic crisis (Lambrechts 1979: 51−55; Pott-Buter 1993: 19−22; Vanhaute 1998: 59−61). Moreover, the 1930s witnessed political initiatives that put strong limits to female employment in industry, targeting married women in particular. The motives for these actions were moral and religious: it was argued that the natural duty of married women was to stay at home and take care of the children. These political initiatives culminated in a number of laws and regulations approved in 1933 and 1934 that inhibited female employment in industry as well as in public service. However, limitations on female employment quickly met with strong opposition by employers, who argued that the restrictions for hiring low-cost (i.e., female) workers further undermined the competitiveness of the Belgian economy. As a result, most restrictions were lifted even before the War (Lambrechts 1979: 115−123).
Post-war economic growth involved an expansion of the service sector, which stimulated female labour force participation. In 1970, 30% of the workforce was female, up from 24% in 1947. Female participation rates increased from 19% in 1947 to 22% in 1970, but in the 20-25 year old age group the rates went up from 40% to 61%, and in the 30−35 year old age group from 26% to 39% between 1947 and 1970 (Lambrechts 1979: 56−58). These trends were almost entirely centered in the commercial and service sectors (Lambrechts 1979; Pott-Buter 1993: 19−22; Vanhaute 1998: 59−61).
One of the sectors of employment that started to feminize was education. By 1965, more than half of the teachers in primary education were women (Depaepe et al., 2004: 977). Female participation in higher education accelerated as well. The number of female students enrolled in Belgian universities tripled between 1950 and 1965, while the number of male students doubled. In 1950, 16% of university students in Belgium were women. By 1970, this was 30%, up from 20% in 1960 (Vanherck and Verbruggen 1991). This is reflected in the level of educational attainment recorded in the cohorts of women whose fertility will be analysed in this paper.
4. Data and methods
The effects of the First World War (with smaller birth cohorts due to a lower birth rate as well as increased mortality) and the Spanish Flu (with many casualties in 1919) are clearly visible. The proportion of women who received more than just primary education clearly rises with cohort. Of the women born before 1910, only 5% completed at least higher secondary education, with 2% completing tertiary (i.e. college or university level) education. These percentages rose steadily towards 10% with at least a completed secondary education in the cohorts born around 1920 and over 23% in the late 1930s cohorts. In the latter cohorts, about 10% graduated from college or university.
Figure 1: Number of women recorded in the Belgian 1981 Census by level of education
Source: own calculations based on Census 1981 (Willaert and Deboosere 2008)
4.1 The 1981 Census as a retrospective data source: potential sources of bias
underestimated as a result of the combined effects of mortality, migration, and non-response. Therefore, the validation of the census estimates against vital registration data focuses solely on rates (Neels 2006: 275). How are estimates of cumulated fertility based on the census affected by these processes? I first present a general discussion, and then consider the potential implications for education-specific rates.
Figure 2 gives two different series of estimates for total fertility: the solid line gives the number of children ever born by birth cohort, as calculated from the 1981 census, starting with the cohort born in 1901 (reaching age 80 in census year 1981) and ending with the cohort born in 1950 (reaching age 31 in 1981). The series indicated by squares gives cohort total fertility rates (CTFR) calculated from vital registration (as published in Sardon 1991; the rates for cohorts 1901-1905 are missing in this series).
Figure 2: Estimates of total cohort fertility based on retrospective census 1981 information on number of children ever born versus cohort total fertility rate based on vital registration
peak of 2.3 live births per woman in the 1930 birth cohort in both series, and declining in the cohorts after that. Another conspicuous similarity in both series is that there was a secondary, smaller peak reached in the 1917−1918 birth cohorts, and then some decline again, just before the climb toward the major peak for the 1930 cohort started. These similarities give confidence in the validity of the census data. Note that the decline of fertility after the 1917−1918 cohorts’ peak happened among the cohorts that were reaching the reproductive ages when the Second World War broke out (e.g. 1919+21 = 1940). Thus one could speculate that the War interrupted a trend of rising fertility that started (in terms of period fertility) well before the war among the earlier cohorts (cf. Van Bavel and Reher 2013).
However, there are clear differences between both cohort series as well. First, in the more recent cohorts, the census estimate is consistently below the CTFR estimate based on vital registration data: from the 1930 to the 1944 cohorts, but the gap is always less than 0.05 children. After that, the gap becomes bigger every year, from 0.07 births in the 1945 cohort to 0.30 births in the 1950 cohort. The obvious explanation for this gap is that fertility is not yet completed in 1981 for the more recent cohorts. We will therefore exclude all cohorts born after 1940 from our analyses. Note that cohort 1940 reaches age 41 during the census year and we consider fertility approximately completed at that age.
In the oldest cohorts, the census estimates are systematically below the vital registration CTFR as well: in cohorts born until 1917, the differences lie within the 0.05–0.08 range. After 1920 (and until 1940), in contrast, the difference is always less than 0.03. I assume that the differences are negligible for the 1920−1940 cohorts, but not the differences in the earlier cohorts. In principle, the gap may be due to three mechanisms: migration, underreporting, and selective survival.
First, rates of outmigration may be positively correlated with family size. However, it is more likely that mobility is negatively rather than positively correlated with actual family size, and therefore migration cannot account for the lower fertility in the census data in older cohorts.2 A second possibility is that older people underreport more often the number of children ever born. This pattern could involve both non-response in the 1981 census and underreporting of the actual number of births. Memory gaps due to old age may result in women failing to answer the census question about their number of births, or they may cause some women to forget to count some of the live births they had. Figure 3 confirms that nonresponse on the item of number of live
2 There may be one exception, although I expect that it plays a marginal role at most: women born around
births is indeed positively correlated with age. For women born before 1910 (older than 70 years in 1981), item non-response is over 2.5%, reaching more than 4% in cohort 1901. From cohort 1919 onwards, non-response is always below 2% and decreasing. Women who did not respond to the question about number of births were left out of the calculations for completed fertility, but if they in reality had more births than the responding women, we will underestimate the true level of fertility. Given low overall non-response rate and given the fact there is no reason to expect a strong correlation between non-response and completed fertility, I assume that this bias will be only very minor, at most.
Figure 3: Item non-response rate in census 1981 on item of the number of children ever born, women by birth cohort
Source: own calculations based on Census 1981 (Willaert and Deboosere 2008)
deaths per 1000 live births in 1965 (Veys 1983). It is quite plausible that some older women omitted some of their live born children who died at a very young age. This may explain a substantial portion of the gap between the census estimate and the vital registration estimate for the pre-1920 cohorts in Figure 2.
Next to omission, another part of the explanation for the gap between the census and the vital registration estimates could be the correlation between fertility and longevity: women with a (very) high number of births have a lower life expectancy in the post-reproductive life stage (age >50) than women with fewer births. This is a stylized fact that research findings have not unequivocally supported. In particular, empirical research in historical populations that practice only archaic forms of fertility control has not generally confirmed higher mortality among high parity women (Westendorp and Kirkwood 1998; Dribe 2004; Le Bourg 2007; Gagnon et al. 2009). In more recent populations practicing more modern contraception, like the Belgian population studied here, the results have been clearer, although longevity in the strict sense of the word can often not yet be studied for recent cohorts since they are too recent to be living long enough. But the evidence about fertility and relative mortality risks suggests that there is a U-shaped correlation between the two in modern populations: childless women have higher mortality risk than parous ones, women with a few children have lower mortality, while women with a large number of children (more than 5) experience higher mortality (Le Bourg 2007), although the differences depend on context (Grundy 2009; Doblhammer 2000). Generally, the reported effects of parity on mortality are quite small when compared to the effects of factors like education or the socio-economic status of the family (Doblhammer 2000). The order of magnitude of the relative mortality risk of high parity women compared with the group with lowest mortality is 1.10 (Le Bourg 2007).
4.2 General versus education-specific biases
Mortality, migration, and underreporting may not only affect the level of our fertility estimates, but also the differences between levels of education. Mortality, migration, and under-reporting/non-response are known to be associated with the level of educational attainment. As long as this correlation affects the numerator and the denominator of the estimated fertility rates to the same extent, it will not bias our estimates of the differences between levels of education. But if education-specific migration, mortality, and non-response are correlated with education-specific fertility rates, it will bias our estimates of fertility differences. For example, if high parity women with a low level of education are more likely to under-report live births than high parity women with a high level of education, we will underestimate the fertility level of the former group compared to the latter group, since this under-reporting affects the nominator but not the denominator of the fertility rates. Second example: if the parity gradient in survival of high rates differs by level of education (e.g. less-educated women suffer a higher large-family penalty than highly-educated women), the estimate of the fertility differential will again be biased.
In sum, if differences between education-specific fertility indicators are larger than factor 1.04 in the older cohorts and larger than factor 1.01 in the younger cohorts, we are confident that the difference is not entirely due to selective survival related to both education and fertility. If the differences are smaller, we should keep in mind that selective survival could explain them. For that reason, differences that are smaller than factor 1.04 in the cohorts born before 1920 and smaller than factor 1.01 in the more recent cohorts are considered negligible.
4.3 Methods
While the Baby Boom is fundamentally a period phenomenon, I analyse it in terms of the behaviour of the cohorts who produced it. Following Ryder (1980), the cohort approach is preferred because fertility indicators aggregated by cohort come closer to the underlying reproductive behaviour than fertility indicators aggregated by time period; “the analysis of the determinants of reproductive behaviour requires the cohort mode of temporal aggregation of data.”
sanctioned, legitimate childbearing. As a result, some positive effect on the quantum of fertility is to be expected.
However the purpose here is not to analyse such effects of timing on quantum. Rather, for reasons explained above, the aim is (a) to learn how the educational gradient evolved in timing and quantum dimensions of fertility in order to (b) make sense of the fact that fertility increased while female participation in education was on the rise. For objective (a) I use simple, conventional measures to chart changes in mean ages at birth and marriage on the one hand and total fertility rates as well as parity distributions on the other. For purpose (b), I will apply a simple counterfactual simulation.
The counterfactual simulation works as follows. The completed fertility 𝐹𝑐 of cohort c is a weighted sum of the education-specific completed fertility 𝐹𝑒𝑐, weighted by the proportions 𝑝𝑒𝑐 of the different levels of educational attainment e in the female population:
𝐹𝑐 = � 𝑝
𝑒𝑐∙ 𝐹𝑒𝑐 𝑒
(1)
In order to analyse the role played by the growing educational attainment of the female population, I will plot counterfactual series of completed fertility, applying the observed proportions 𝑝𝑒𝑐 while fixing the education-specific fertility-values. Concretely, the education-specific fertility rates are fixed to the values observed in the oldest cohorts born in the years 1901 to 1905 (included).3 This series will be called the “fixed fertility rates” scenario. This is an extremely stringent scenario, implying that nothing changes except the population distribution by educational attainment. A second counterfactual scenario is called “fixed educational gradient”. It allows fertility rates to change in addition to the levels of educational attainment, but the educational gradient is fixed to the one observed in the old 1901-05 cohort. The educational gradient is defined as in equation (2):
𝑔𝑒𝑐 =𝐹𝑒 𝑐
𝐹𝑐 (2)
The “fixed educational gradient” scenario first calculates this gradient in the 1901-05 born cohort and then generates counterfactual series of completed fertility as follows:
3 I chose to fix parameters in this and subsequent counterfactual scenarios to the average observed in the
𝐹𝑐∗= � 𝑝
𝑒𝑐∙ 𝑔𝑒1901−05𝐹𝑐 𝑒
(3)
Finally, the third scenario is called “fixed education” and implies that the education-specific sets of completed fertility change as observed but that the distribution by educational attainment in the female population remained as it was in the 1901−05 cohort – this means that the proportions 𝑝𝑒𝑐 in equation (1) are fixed to the ones observed for the oldest cohorts 1901−05.
Throughout I distinguish between three levels of educational attainment: (1) women with a “low” level of education who finished lower secondary education at most; (2) women with “medium” education who finished a degree in higher secondary education; (3) highly-educated women who obtained some post-secondary degree. In preliminary analyses, I experimented with more refined distinctions, but three levels appeared to be sufficient to capture the major heterogeneity patterns discerned in the fertility trends.
5. Results
Given that female participation in education was on the rise in Belgium in the 1950s and ‘60s, the negative correlation between women’s education and fertility, and the diffusion of fertility control since the nineteenth century (Lesthaeghe 1977), fertility decline was in the air in the middle of the twentieth century – or at least a stabilisation of rates at very low levels. But unexpectedly, fertility started to recover. Below we see that part of the explanation is that the era witnessed, at least in Belgium, a major weakening of the apparent incompatibility between female education and fertility. Section 5.1 describes the shifting educational gradient in cohort completed fertility and the results of the counterfactual simulation. Next, I focus on underlying components of completed fertility: first, the proportions marrying, extramarital childbearing, and childlessness; second, the timing of first marriage and childbirth; and, finally, the frequency distributions by final parity.
5.1 Completed fertility
differences between the levels of educational attainment are much larger than the differences over time, but they diminish in the more recent generations. In the cohorts born during the first decade of the twentieth century, women with a high level of education had about one birth, on average, women with medium education had approximately 1.5 births, and the low educated had approximately two; so the low educated had a full extra birth more than the highly educated. Gradually, these figures converged, with both medium- and highly-educated women averaging just below two children in the cohorts born in the 1930s, compared with around 2.3 children for their low educated age peers.
What is most spectacular about these figures is the strong increase of total fertility among highly-educated women during this period.4 Apparently, highly-educated women (i.e. women who obtained a post-secondary, tertiary degree) were becoming a less exceptional, less selective group in terms of childbearing behaviour.
How would completed fertility have evolved if female participation in education expanded as it did while the education-specific fertility rates were fixed at the values observed for the 1901−05 cohorts? The “fixed fertility” scenario in Figure 5 shows that overall total cohort fertility would have declined monotonically from 1.92 children per woman in the oldest cohorts to 1.79 in the youngest (a seven percent decline). On the other hand, total fertility would have increased more than it actually did if female participation in education would not have expanded but rather remained as it was in the oldest cohorts (while education-specific fertility rates would have changed as they in fact did). This “fixed education” scenario implies that there was indeed a negative impact of the expansion of female participation in education on fertility, all else equal, but this negative impact was limited because the expansion of female participation was not yet massive and low-educated women were still dominating the picture.
4 An interpretation in terms of bias due to selective survival or omission of births seems implausible, since
Figure 4: Total number of live births by cohort and level of education, 1901−1940
Source: own calculations based on Census 1981 (Willaert and Deboosere 2008)
Figure 5: Counterfactual scenarios for completed fertility by cohort, 1901−1940
Source: own calculations based on Census 1981 (Willaert and Deboosere 2008). For definition of scenarios, see Methods section 4.3.
5.2 Marriage, extra-marital childbearing, and childlessness
For all cohorts of the first half of the twentieth century, more than nine out of ten children were born to a married couple. Figure 6 shows trends in the estimated proportion of births out of wedlock.5 This was nearly 10% for low-educated women in the earliest cohorts, and only around 3% for the two other groups. Among the low educated, the proportion of out-of-wedlock births dropped, first, towards around 6% in the cohorts born in the 1910s, then increased a bit, before further declining towards just above 4% in the 1930s cohorts. Since extramarital fertility was concentrated among the
5 Since we do not know the month of birth and since there was no explicit question about out-of-wedlock
births, these proportions were estimated as the share of first births occurring in a year preceding the year of marriage, if any marriage occurred at all. Births occurring to never-married mothers were obviously counted as out-of-wedlock. 1 .8 1 .9 2 .0 2 .1 2 .2 2 .3 2 .4 Cohort T o ta l F e rt ilit y
1900 1905 1910 1915 1920 1925 1930 1935 1940 Actual fertility
low educated, the overall trend followed the same pattern. It is therefore clear that out-of-wedlock childbearing did not play any role in producing the Baby Boom; quite the contrary.
Figure 6: Proportion of first extramarital births by cohort and level of education
Source: own calculations based on Census 1981 (Willaert and Deboosere 2008)
Most women had their children within marriage. From the international literature, we know that the proportions never marrying went down during the Baby Boom era (Van Bavel and Reher 2013). Figure 7 shows the educational gradient in the cohort trend in Belgium. It gives the proportion of women who did not marry before age 41. (Age 41 was used as a common censoring age because the youngest cohort was censored at that age at the time of the 1981 census). The proportions not marrying declined in all educational groups but there is very clear convergence because marriage became much more common among more highly-educated women.
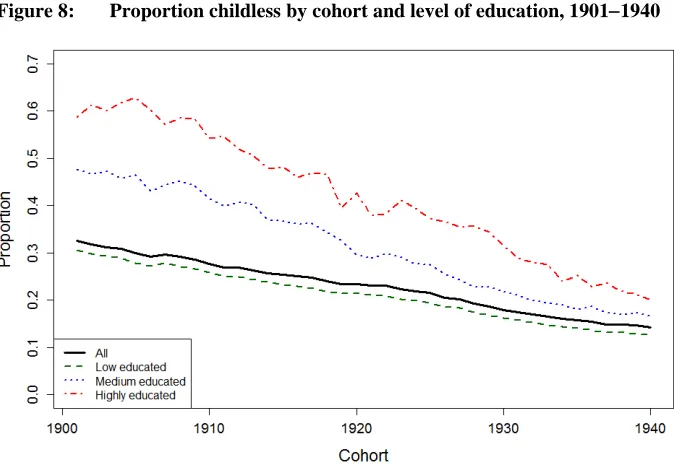
time, strongly declining childlessness was a major factor behind increasing total fertility. It halved across all educational groups, from around 30% in the oldest cohorts to around 15% in the youngest ones. Again, a convergence happened over time between the different levels of education and, again, the strongest trend is for women with a post-secondary degree: in the earliest cohorts, around 60% remained childless (double that of the low educated), whereas this was only around 20% (only about five percentage points more than the low educated) in the latest cohorts.6
Figure 7: Proportion of women who did not marry before age 41 by cohort and level of education
Source: own calculations based on Census 1981 (Willaert and Deboosere 2008)
6 With respect to selective survival, it can be pointed out that, if childlessness was indeed associated with
Figure 8: Proportion childless by cohort and level of education, 1901−1940
Source: own calculations based on Census 1981 (Willaert and Deboosere 2008)
Figure 9: Kaplan-Meier survival curves for transition to first birth, by level of educational attainment, 1901−1940 cohorts combined
Source: own calculations based on Census 1981 (Willaert and Deboosere 2008)
5.3 Age at first birth
Figure 10: Average age at first birth by level of education and birth cohort, for those having at least one birth, 1901−1940 birth cohorts
Source: own calculations based on Census 1981 (Willaert and Deboosere 2008)
As before, the differences between the educational groups in mean age at first childbirth are larger than the change over time. In contrast to what was found for total fertility and childlessness, there was no convergence between the groups over time. Thus the convergence in total cohort fertility cannot be explained by the effect of timing on quantum.
Figure 12 plots cohort trends in mean ages at first marriage. They mirror very closely what was observed for age at first birth, with differences between educational groups remaining more or less constant (the most highly educated marry about three years later, on average, than those with the lowest level of education) and with age at marriage declining in the more recent cohorts. Across all educational groups, the average age at marriage declined from 24 to 22. However, most of the decline happened for the cohorts born after 1920. From a period perspective, these are the cohorts marrying mostly from the later 1940s onwards, after the Second World War.
5.4 Quantum distribution
Figure 12: Mean age at marriage for women marrying before age 41, by cohort and level of education
Source: own calculations based on Census 1981 (Willaert and Deboosere 2008)
Figure 13: Relative parity distributions for women by level of educational attainment and cohort: proportions reaching exactly parity one, two to six or more
Source: own calculations based on Census 1981 (Willaert and Deboosere 2008)
one should be able to fulfil one’s parental obligations. Beyond the second child, the progression is primarily a matter of individual preference” (Ryder 1980: 33). Implicit in Ryder’s position is the notion that causal factors implicated in parity progression will vary by parity. For explaining variation in low-parity progression (the solid line in Figure 14), “one should look within the realm of normative pressure in relation to the socio-economic context” (p. 34). In contrast, for explaining variation in parity progression past the second child (the dashed line in Figure 14), one may look “within the realm of discretionary reproduction”, although the latter will also be the repository of unwanted or unplanned pregnancies (ibid.).
Figure 14: Components of parity progression in completed fertility: average parity progression ratios for low parities (0−1, 1−2; solid line) and higher parities (2−3, 3−4, ...; dashed line), cohorts 1901−1940*
Source: own calculations based on Census 1981 (Willaert and Deboosere 2008), following Ryder (1980: 28-35) * Points indicate the raw data, lines are first-degree LOESS lines with span=0.66 (Cleveland and Devlin 1988)
the highly educated. Progression to higher-order births declined slowly until the 1930 cohort and then more rapidly for more recent cohorts. The decline was more dramatic among women with high educational attainment.
Parity progression ratios can be misleading if one neglects the fact that they reflect conditional distributions; they give the probability of moving to the next parity, given
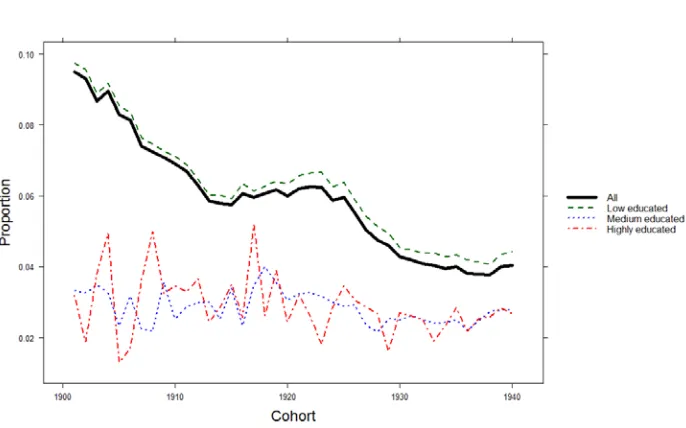
that the previous parity was attained. The declining higher-parity progression ratios across all cohorts in Figure 14 could give the impression that fewer women were having three or more births. However, the opposite actually happened because a growing proportion of women were having at least two births. This implied that a growing proportion of women were at risk of having three or more births. Indeed, the proportions of women having three or four live births were strongly on the rise in all educational groups: from 10 to 18% (three births) and from 6 to 10% (four births), respectively (Figure 13). But we also observe a hint of a downward twist towards the very end of the curve for three births, notably among the low and medium educated, and the increasing trend in the curve for four births halted and reversed among the cohorts born in the 1930s. The curves for five and more births are relatively stable at a low level for the cohorts born during the first 25 years of the century, but then they trend down as well.
6. Conclusion and discussion
From the perspective of the changing educational gradient in fertility, the Baby Boom era was not just a temporary interruption of the secular trend towards the low total fertility observed today but rather a crucial stage in the transition towards the current reproductive landscape, where female investments in higher education are no longer considered incompatible with family formation. In the countries most advanced in terms of human development, the educational penalty on fertility has been cut down dramatically (Balbo et al. 2013). At high levels of human development, further increases of female education might lead to increasing rather than declining fertility (Myrskylä et al. 2009, 2011). In the cohorts coming of age today, women tend to be more highly educated than men, but this does not necessarily mean that fertility is bound to decline (Van Bavel 2012). These current conditions would have been impossible without the changing educational gradient in fertility witnessed in the Baby Boom era documented in this research.
about half of the highly-educated women never married and never had any children. In the later cohorts, this declined towards levels that were no longer far removed from levels observed for medium and low-educated women. A similar reduction of the educational gradient was observed towards the higher end of the parity distribution. Two children became the modal number of births, and the rise of the two-child family was particularly pronounced among the highly educated. Also the proportions having more than two births went up more among the highly educated than among the lower educated.
Thus the weakening educational gradient in fertility played an important part in the story of the Baby Boom. Very much in line with theories arguing that the opportunity costs of childbearing are typically higher for more highly-educated women (Kravdal and Rindfuss 2008), there has generally been a negative association between female education and fertility as far as the historical records go (Skirbekk 2008), a pattern that also holds for Belgium. Across the Belgian cohorts analysed here, participation in higher education greatly expanded. As a result, the level of cohort fertility would have declined if fertility rates by level of education would have stabilized at the values observed in the oldest cohorts. In fact, cohort fertility went up as a consequence of two developments: on the one hand, there was a recovery of fertility rates across the board, on the other hand, the educational gradient in fertility rates got weaker. Without the reduction of the educational gradient in the quantum of fertility, the recovery of the overall level of completed fertility would have been about one quarter less than it actually was.
While there was a remarkable convergence in terms of fertility quantum, there was considerable stability in the educational gradient of the timing of the first child. The average age at marriage as well as first birth declined in all educational groups to approximately the same extent. Earlier family formation was accompanied by a strong reduction in the proportion of extramarital births among women with low educational attainment (extramarital childbearing was already low among the medium and highly educated). Whether declining ages at marriage and declining extramarital childbearing were causally related cannot be concluded from these analyses. Future work on age-specific rates of marital and non-marital childbearing may shed more light on that question.
fertility transition. At least part of the explanation is that a growing proportion of women were at risk to have three or more births due to the higher rates of progression to parities one and two. However, conditioned on having had at least two births, parity progression ratios after the second child were not increasing. On the contrary: there was a weak downward trend in the parity progression ratios even in the cohorts born before the 1930s. In the more recent cohorts, the decline in parity progression after the second birth was sharp, while progression to lower-order births continued to go up.
Ryder (1980: 31−35) argued that the transition to first and second births can be determined to a large extent by normative pressures for family formation and parenthood (given adequate economic means). In contrast, higher order births can be characterized as “discretionary”; more a matter of choice. Still, he also recognized that higher order births may be “the repository of indiscreet reproduction as well” (p.34), referring to unplanned, accidental pregnancies. It is certainly possible that a substantial part of the increase of the proportions having three or more births during the Baby Boom was the result of such “indiscreet reproduction” rather than a matter of preference and choice. For the US, it has been demonstrated that the rise in the proportion of third and fourth births during the Baby Boom can be explained by rising numbers of unintended births (Ryder 1978; see also discussions in Bean and Swicegood 1979; Bean 1983). For Belgium, this interpretation is consistent with the finding that the proportion of women with three or more births started to decline in the 1930s cohorts. Assuming that these cohorts would have had their third, fourth and fifth children mostly after 1965, this suggests that there is a connection with the diffusion of more efficient, modern hormonal contraception (Van Bavel and Reher 2013). The pill became available in Belgium from the mid-1960s and was rapidly adopted by growing proportions of women (Cliquet 1969; Lodewijckx and Cliquet 1988). Indications for Belgium are that through this period, it was used first and foremost during the last, “open” birth interval, i.e. after the birth of the last child (Cliquet and Schoenmaekers 1975: 100−105).
The central finding of this research is that the educational gradient in the quantum of fertility strongly declined while the gradient in age at first childbirth remained the same. Even if the recovery of total fertility across all levels of education was the crucial trend behind the Baby Boom, the convergence between low and highly-educated women played an important part too. This conclusion closely mirrors the one drawn in a recent study about the Baby Boom in Sweden, where a very similar convergence in childlessness and two- as well as three-child families was observed. During the Baby Boom era, fertility differentials across educational strata reached the lowest levels recorded in 20th century Sweden (Sandström 2014).
gradient would be that the distribution of the predisposition to marry and have children remained the same during the democratisation of participation in higher education. This democratization meant that a higher proportion of the women with a predisposition for family formation were drawn up into the ranks of the educated. The college-educated pioneers of the older cohorts were probably strongly career-oriented, an attitude that did not fit with the breadwinner-homemaker gender division of labour that dominated family life at the time. This division of labour was particularly dominant in the higher social classes, where these highly-educated women predominantly were located; female labour force participation has always been higher in the lower social classes. Accordingly, women with a preference for family formation would select themselves out of the group of college graduates. This changed during the Baby Boom era: increasingly, women who wanted to start a family obtained a degree in higher education first.
This interpretation is not only consistent with the figures about childlessness and proportions not marrying, but also with the fact that the educational gradient in the timing of the first birth hardly changed. Irrespective of the predisposition for family formation, obtaining a degree in tertiary education takes its time, which is why college educated women had their first child on average three years later than low-educated women in the earlier as well as in the later cohorts.
7. Acknowledgements
References
Aldcroft, D.H. (1998). Education and development: the experience of rich and poor nations. History of Education 27(3): 235−254. doi:10.1080/0046760980270304. Balbo, N., Billari, F.C., and Mills, M. (2013). Fertility in Advanced Societies: A
Review of Research. European Journal of Population 29(1): 1−38. doi:10.1007/s10680-012-9277-y.
Bean, F.D. (1983). The Baby Boom and Its Explanations. Sociological Quarterly 24(3): 353−365. doi:10.1111/j.1533-8525.1983.tb00706.x.
Bean, F.D. and Swicegood, G. (1979). Intergenerational Occupational Mobility and Fertility: A Reassessment. American Sociological Review 44(4): 608−619. doi:10.2307/2094590.
Beller, E. (2009). Bringing Intergenerational Social Mobility Research into the Twenty-first Century: Why Mothers Matter. American Sociological Review 74(4): 507−528. doi:10.1177/000312240907400401.
Bernardo y Garcia, L.A. and Buck, M. (2001). Belgian society in exile: an attempt at a synthesis. In: Conway, M. and Gotovich, J. (eds.). Europe in exile : European exile communities in Britain, 1940−1945. Oxford: Berghahn Books: 53−67. Blossfeld, H.-P. and Drobnic, S. (eds.) (2001). Careers of couples in contemporary
societies: from male breadwinner to dual-earner families. Oxford: Oxford
University Press.
Boli, J., Ramirez, F.O., and Meyer, J.W. (1985). Explaining the Origins and Expansion of Mass Education. Comparative Education Review 29(2): 145−170. doi:10.1086/446504.
Brewster, K.L. and Rindfuss, R.R. (2000). Fertility and Women's Employment in Industrialized Nations. Annual Review of Sociology 26(1): 271−296. doi:10.1146/
annurev.soc.26.1.271.
Butz, W.P. and Ward, M.P. (1979). The Emergence of Countercyclical U.S. Fertility.
The American Economic Review 69(3): 318−328. doi:10.2307/1807367.
Cleveland, W.S. and Devlin, S.J. (1988). Locally Weighted Regression: An Approach to Regression Analysis by Local Fitting. Journal of the American Statistical Association 83(403): 596−610. doi:10.1080/01621459.1988.10478639.
Cliquet, R.L. (1969). Kennis, gebruik en effectiviteit van anticonceptie in België.
Bevolking en Gezin 19: 1−75.
Cliquet, R.L. and Schoenmaeckers, R. (1975). Van toevallig naar gepland ouderschap. Kapellen: De Sikkel/De Nederlandsche Boekhandel.
de Neef, G. (1985). De eerste vrouwelijke studenten aan de universiteit te Leuven. Leuven: Acco.
Depaepe, M., Lauwers, H., and Simon, F. (2004). De feminisering van het leerkrachtencorps in België in de negentiende en de twintigste eeuw. Revue belge de philologie et d'histoire 82(4): 969−994 (10.3406/rbph.2004.4873). Doblhammer, G. (2000). Reproductive history and mortality later in life: A comparative
study of England and Wales and Austria. Population Studies 54(2): 169−176. doi:10.1080/713779087.
Doepke, M., Hazan, M., Maoz, Y.D., and Research, National Bureau of Economic (2007). The Baby Boom and World War II: A Macroeconomic Analysis. Bonn: IZA, Institut for the Study of Labor (Discussion Paper Series No. 3253).
Dribe, M. (2004). Long-term effects of childbearing on mortality: Evidence from pre-industrial Sweden. Population Studies 58(3): 297−310. doi:10.1080/003247204 2000272357.
Dribe, M. and Stanfors, M. (2010). Family life in power couples.: Continued childbearing and union stability among the educational elite in Sweden, 1991– 2005. Demographic Research 23(30): 847−878. doi:10.4054/DemRes.2010. 23.30.
Easterlin, R.A. (1961). The American Baby Boom in Historical Perspective. The American Economic Review 51(5): 869−911. doi:10.2307/1813841.
Easterlin, R.A. (1987). Birth and Fortune: The Impact of Numbers on Personal Welfare. Chicago: University of Chicago Press.
Festy, P. (1979). La fécondité des pays occidentaux de 1870 à 1970. Paris: Presses universitaires de France.
Gagnon, A., Smith, K.R., Tremblay, M., Vézina, H., Paré, P.-P., and Desjardins, B. (2009). Is there a trade-off between fertility and longevity? A comparative study of women from three large historical databases accounting for mortality selection. American Journal of Human Biology 21(4): 533−540. doi:10.1002/ajhb.20893.
Glass, D.V. (1968). Fertility Trends in Europe since the Second World War. Population Studies 22(1): 103−146. doi:10.2307/2173355.
Goldin, C. (2004). The Long Road to the Fast Track: Career and Family. Annals of the American Academy of Political and Social Science 596(1): 20−35. doi:10.1177/ 0002716204267959.
Goldin, C. (2006). The Quiet Revolution That Transformed Women's Employment, Education, and Family. American Economic Review 96(2): 1−21. doi:10.1257/000282806777212350.
Goldin, C., Katz, L.F., and Kuziemko, I. (2006). The Homecoming of American College Women: The Reversal of the College Gender Gap. Journal of Economic Perspectives 20(4): 133−156. doi:10.1257/jep.20.4.133.
Greenwood, J., Seshadri, A., and Vandenbroucke, G. (2005). The Baby Boom and Baby Bust. American Economic Review 95(1): 183−207. doi:10.1257/000282 8053828680.
Grundy, E. (2009). Women's fertility and mortality in late mid life: A comparison of three contemporary populations. American Journal of Human Biology 21(4): 541−547. doi:10.1002/ajhb.20953.
Gustafsson, S. (2001). Optimal age at motherhood. Theoretical and empirical considerations on postponement of maternity in Europe. Journal of Population Economics 14(2): 225−247. doi:10.1007/s001480000051.
Howarth, J. (1994). Women. In: Harrison, B.H. (ed.). The History of the University of Oxford. Volume VIII: The Twentieth Century.. Oxford: Oxford University Press: 345−376.
Kravdal, Ø. (1994). The Importance of Economic Activity, Economic Potential and Economic Resources for the Timing of First Births in Norway. Population Studies 48(2): 249−267. doi:10.1080/0032472031000147786.
Kravdal, Ø. and Rindfuss, R.R. (2008). Changing Relationships between Education and Fertility: A Study of Women and Men Born 1940 to 1964. American Sociological Review 73(5): 854−873. doi:10.1177/000312240807300508.
Lambrechts, E. (1979). Vrouwenarbeid in België: het tewerkstellingsbeleid inzake vrouwelijke arbeidskrachten, 1930−1972. Brussel: Centrum voor Bevolkings- en Gezinsstudiën.
Lappegård, T. and Rønsen, M. (2005). The Multifaceted Impact of Education on Entry into Motherhood. European Journal of Population 21(1): 31−49. doi:10.1007/ s10680-004-6756-9.
Le Bourg, É. (2007). Does reproduction decrease longevity in human beings? Ageing Research Reviews 6(2): 141−149. doi:10.1016/j.arr.2007.04.002.
Lesthaeghe, R.J. (1977). The Decline of Belgian Fertility, 1800−1970. Princeton : Princeton University Press.
Lesthaeghe, R.J. and Surkyn, J. (1988). Cultural Dynamics and Economic Theories of Fertility Change. Population and Development Review 14(1): 1−45. doi:10.2307/ 1972499.
Lodewijckx, E. and Cliquet, R.L. (1989). De anticonceptietransitie. In: Lodewijckx, E. (ed.). Gezinsplanning in Vlaanderen: resultaten van de vierde C.B.G.S.-survey
over gezinsontwikkeling (NEGO IV, 1982-1983). Brussel: Centrum voor
Bevolkings- en Gezinsstudiën: 48−59.
Lutz, W., Goujon, A., KC, S., and Sanderson, W. (2007). Reconstruction of population by age, sex and level of educational attainment of 120 countries for 1970-2000.
Vienna Yearbook of Population Research 2007 : 193−235. doi:10.1553/
populationyearbook2007s193
Macunovich, D.J. (1996). Relative Income and Price of Time: Exploring Their Effects on US Fertility and Female Labor Force Participation. Population and Development Review 22(Supplement): 223−257. doi:10.2307/2808013.
Maddison, A. (2003). The World Economy. Paris: OECD Publishing. doi:10.1787/ 9789264104143-en.
Myrskyla, M., Kohler, H.-P., and Billari, F.C. (2011). High development and fertility: fertility at older reproductive ages and gender equality explain the positive link. Rostock : Max Planck Institute for Demographic Research (MPIDR Working Paper WP 2011-017).
Neels, K. (2006). Reproductive Strategies in Belgian Fertility, 1960−1990. Brussel/Den Haag: Centrum voor Bevolkings- en Gezinsstudie.
Pott-Buter, H. (1993). Facts and Fairy Tales about Female Labour, Family and
Fertility: A Seven-Country Comparison, 1850−1990. Amsterdam: Amsterdam
University Press.
Rindfuss, R.R. and Sweet, J.A. (1977). Postwar fertility trends and differentials in the United States. New York: Academic Press.
Rutherdale, R. (1999). Fatherhood, Masculinity, and the Good Life During Canada's Baby Boom, 1945−1965. Journal of Family History 24(3): 351−373. doi:10.1177/036319909902400307.
Ryder, N.B. (1978). A model of fertility by planning status. Demography 15(4): 433−458. doi:10.2307/2061198.
Ryder, N.B. (1980). Components of temporal variations in American fertility. In: Hiorns, R.W. (ed.). Demographic patterns in developed societies. London: Taylor and Francis: 15−54.
Sandström, G. (2014). The mid-twentieth century baby boom in Sweden – changes in the educational gradient of fertility for women born 1915–1950. The History of the Family 19(1): 120−140. doi:10.1080/1081602x.2013.871317.
Sardon, J.-P. (1991). Generation Replacement in Europe Since 1900. Population: An English Selection 3: 15−32. doi:10.2307/2949130.
Schofer, E. and Meyer, J.W. (2005). The Worldwide Expansion of Higher Education in the Twentieth Century. American Sociological Review 70(6): 898−920. doi:10.1177/000312240507000602.
Skirbekk, V. (2008). Fertility trends by social status. Demographic Research 18(5): 145−180. doi:10.4054/DemRes.2008.18.5.
Thornton, A. (1978). The Relationship between Fertility and Income, Relative Income and Subjective Well-Being. In: Simon, J.L. (ed.). Research in Population Economics. Greenwich: JAI Press: 261–290.
Van Bavel, J. (2009). Subreplacement fertility in the West before the baby boom: Past and current perspectives. Population Studies 64(1): 1−18. doi:10.1080/ 00324720903362806.
Van Bavel, J. (2012). The reversal of gender inequality in education, union formation and fertility in Europe. Vienna Yearbook of Population Research 2012: 127−154. doi:10.1553/populationyearbook2012s127.
Van Bavel, J. and Reher, D.S. (2013). The Baby Boom and Its Causes: What We Know and What We Need to Know. Population and Development Review 39(2): 257-288. doi:10.1111/j.1728-4457.2013.00591.x.
Vanhaute, E. (1998). Het kostwinnersmodel als historische fictie: arbeid en inkomen van gezinnen in langetermijnperspectief. In: van Dongen, W., Vanhaute, E., and Pauwels, K. (eds.). Het kostwinnersmodel voorbij?: naar en nieuw basismodel voor de arbeidsverdeling binnen de gezinnen. Leuven: Garant: 55−70.
Vanherck, R. and Verbruggen, P. (1991). Vrouwen aan universiteiten. Verklaring van de achterstelling van het vrouwelijk personeel aan de Vlaamse universiteiten. Antwerpen: UIA Vrouwenstudies.
Vanthemsche, G. (1988). De fysionomie van de werkloosheid in België tijdens de jaren 1930 (deel 1). Belgisch Tijdschrift Voor Nieuwste Geschiedenis XIX(3−4): 269−344.
Veys, D. (1983). Cohort Survival in Belgium in the Past 150 Years: Data and Life Table Results, Shortly Commented. Leuven: K.U. Leuven, Sociological Research Institute.
Westendorp, R.G.J. and Kirkwood, T.B.L. (1998). Human longevity at the cost of reproductive success. Nature 396(6713): 743−746. doi:10.1038/25519.