RESEARCH PAPER
Prediction of Methanol Loss by Hydrocarbon Gas Phase in
Hydrate Inhibition Unit using Back Propagation Neural
Networks
Behzad Vaferi*
Young Researchers and Elite Club, Shiraz Branch, Islamic Azad University, Shiraz, Iran
Received: 22 June 2019, Revised: 25 August 2019, Accepted: 4 September 2019 © University of Tehran 2019
Abstract
Gas hydrate often occurs in natural gas pipelines and process equipment at high pressure and low temperature. Methanol as a hydrate inhibitor injects to the potential hydrate systems and then recovers from the gas phase and re-injects to the system. Since methanol loss imposes an extra cost on the gas processing plants, designing a process for its reduction is necessary. In this study, an accurate back propagation neural network (BPNN) is designed for the prediction of methanol loss by the gas phase as a function of temperature, pressure, and methanol composition in the aqueous phase. Different configurations of BPNN were trained, tested, and a configuration providing the smallest absolute average relative deviation (AARD%) was chosen as an optimum structure. Finally, comparisons made among the accuracy of the developed BPNN model, process simulators, and probabilistic neural network (PNN). Results confirm that the designed BPNN model is more accurate than the other considered predictive tools. The BPNN provided an AARD=5.75% for prediction of experimental data, while HYSYS, Aspen-Plus, and PNN presented an AARD% of 9.71, 12.57, and 13.27, respectively.
Keywords:
Artificial Neural Networks, Commonly Used Process Simulators,
Hydrocarbon Gas Phase, Hydrate Inhibition Unit, Methanol Loss
Introduction
Gas hydrates or clathrate hydrates refer to those solid porous materials that form when the empty cavities of the water structures occupy by the natural gas components such as methane [1]. It is about a hundred years that gas hydrate is distinguished as a serious operation problem in the natural gas and natural gas liquid processing plants [2]. These “ice-like” porous materials yield
to some undesirable operating conditions such as blockage of the pipelines, increasing the pressure drops, and imposing extra economic costs in the gas processing plants. It is widely accepted that methanol can play a crucial role as a hydrate inhibitor agent in the gas processing plants and associated transportation pipelines [3]. Using methanol as a hydrate inhibitor agent has a history as long as the history of the invention of gas hydrates [4]. It is worthy to be noted that removal of water, heating the system, and reduction of pressure are some of the other proposed techniques for solving the problems of gas hydrates [5-7].
By utilizing the Knudsen cell techniques, Iraci et al. [8] experimentally measured the methanol solubility in various aqueous solutions of Sulphuric acid at wide ranges of temperature. It was reported that increasing the temperature and pH reduces the amount of methanol solubility in aqueous solutions [8]. Bahadori and Vuthaluru [9] developed an Arrhenius-type function and Vandermonde matrix as practical paradigms for prediction of vapor pressures and vaporization loss of methanol in different methanol solutions. These variables were related to the methanol
* Corresponding author
concentration in aqueous solutions and temperature. Bahadori and Vuthaluru [10] derived an Arrhenius-type correlation for estimation of methanol solubility in the liquid phase of paraffinic hydrocarbons. The developed model relates this solubility to the temperature and methanol concentration in the water phase. Ghiasi et al. [11] designed three different artificial intelligent (AI) models including radial basis, multi-layer perceptron, as well as support vector machine for estimation of the methanol solubility in the liquid phase of saturated hydrocarbons. Temperature and methanol concentration in the aqueous phase are those independent variables that were used for designing the AI approaches [11]. Yousefinejad et al. [12] investigated the effects of polarization, topology, electronegativity, molecular weight, and volume fraction on the methanol and ethanol miscibility in different organic solvents using the quantitative structure-activity relationship models.
Although using methanol as a gas hydrate inhibitor additive has been found a simpler and more cost-effective strategy than the other hydrate-inhibition processes [5-7], it may encounter some considerable economic expenses related to its loss by both gas phase and light hydrocarbon liquid phase [9,11]. Therefore, the development of an accurate and practical technique for the estimation of methanol loss by the hydrocarbon gas phase is required for designing an appropriate scenario for its reduction [13]. Since the methanol is a polar substance with the ability to form the hydrogen bonds, its vapor-liquid equilibrium (VLE) and liquid-liquid equilibrium (LLE) behaviors that are needed for calculation of methanol loss could only be accurately modeled by the complex equation of states that need high computational times and efforts [14]. Therefore, the focus of this research is concentrated on developing a simple and accurate BPNN paradigm for the prediction of methanol loss by the gas phase. A lot of experimental VLE and LLE information over wide ranges of temperature, pressure, and inhibitor compositions are collected from the gas processors association research reports of 117 and 149 (GPA RR 117, 149). These reports provide distribution of methanol in the aqueous phase, hydrocarbon liquid phase, as well as gas phase in nine different potentially hydrate systems [15,16].
Indeed, in this study, two different types of artificial neural networks (i.e. BPNN and PNN) are developed using the aforementioned experimental VLE and LLE data for estimation of methanol loss by the hydrocarbon gas phase. Comparisons are also made among accuracies of the developed BPNN, PNN, and two commonly used process simulators namely Aspen-HYSYS and Aspen-plus. Finally, the best model is found and its performance for prediction of methanol loss by hydrocarbon gas phase is evaluated.
Motivation And Novelty of Our Study
Methanol loss by hydrocarbon gas phase in hydrate inhibition units that imposes additional costs on the gas processing plants is necessary to be reduced as much as possible. This loss is directly related to both VLE and LLE behaviors of methanol in the potential hydrate systems. Prior to design a scenario for reducing or maybe minimizing the methanol loss, it is necessary to develop a simple technique that could estimate methanol loss with acceptable accuracy. The polarity of methanol and its ability to form the hydrogen bonds produce some major complexities for accurate modeling of its VLE and LLE behavior by the equation of states. Our simple, straightforward, and accurate BPNN model uses some easily measured variable for accurate estimation of the methanol loss by hydrocarbon gas phase over wide ranges of conditions. Moreover, this BPNN model can be simply coupled with other approaches/software for minimizing as well as controlling the amount of methanol loss in the hydrate inhibition units.
Artificial Neural Networks
[17,18]. These nonlinear learning mathematical methods are originally derived by simulation of the working process of the biological neuron system of human beings [19,20]. Hoseinpour et al. [21] employed different types of AI-based approaches (i.e. gene expression programming, adaptive neuro-fuzzy inference systems, and radial basis function neural networks) for estimation of the solubility of carbon dioxide in aqueous solutions of tetra-n-butylammonium bromide. Liu et al. [22] designed an ANN approach for prediction of both engine performance and exhaust emissions when an engine fueled with a zero to 60 volume percent n-butanol in gasoline. The blend concentration, equivalence ratio, compression ratio, and engine load constitutes the independent parameters for the ANN model [22].
It is widely accepted that the ANN model is capable to extract the relation among independent and dependent variables of the most complex multi-variable phenomena with any level of nonlinearity [23]. ANNs have already demonstrated their excellent performances for function approximation, data processing, as well as for pattern recognition [17,18,22].
All of the ANN models constitute a relatively large number of interconnected key elements well-known as artificial neurons [24].Artificial neural networks can simply create by putting given numbers of neurons in different layers. The first layer of the neuron receives information from an external source and after implementation of some mathematical manipulations sends their output(s) to the subsequent layer(s). Eq.1 explains the mathematical manipulation that performs on the entry data (xr). Indeed, this equation calculates the output of the neurons.
) (
1
j r N
r jr
j f w x b
n =
+= (1)
where wjr is the weight related to the connection between jth neuron and rth entry signal. Bj and nj explain the bias and output of jth neuron, respectively. As can be simply seen from Eq. 1, the entry signal to a neuron are manipulated through their multiplication by weights and summation by biases coefficients (i.e. ∑𝑁𝑟=1𝑤𝑗𝑟𝑥𝑟+ 𝑏𝑗). This summation often called the net input, and often
shown by netj as follows:
j r N
r jr
j w x b
net =
+=1
(2)
The value of net input passes through a function namely activation or transfer function (f) to provide the output of the neuron. In the present study, the function defined by Eq. 3 is applied as a transfer function in the hidden and output layers of the BPNN models.
netj j
e net
f −
+ =
1 1 )
( (3)
where f (net j) shows the neuron’s output. It will play a role as the input for the other neurons or presents the output of BPNN. The correlation indicated by Eq. 3 is usually called logarithm sigmoid transfer functions. This transfer functions compress its inputs into [0 1] domain [25].
Data Acquisition And Analyses
considered hydrate systems, their experimental and operating conditions are summarized in
Table 1.
After collecting the required datasets, the next step is the selection of input variables i.e. independent variables of the predictive models. Temperature (T), pressure (P), and weight percent of methanol in the heavy liquid phase (aqueous phase) have been considered as independent variables of our proposed models. Indeed, all of our predictive models have been developed based on the assumption that the dependent variable (methanol loss) can be described as follows:
Methanol loss = g (P, T, weight percent of methanol in the aqueous phase) (4)
Amount of methanol loss (ML) in the hydrocarbon gas phase in term of a kilogram of methanol in one million standard cubic meters of gas per weight percent of methanol in aqueous phase calculates as follow:
gas of meters cubic standard Million
(%wt) phase aqueous of
content Methanol
(kg) phase gas in methanol of
Mass loss
Methanol
= (5)
The numbers of neurons in the input and output layers of BPNN are equal with the number of independent and dependent variables, respectively. Therefore, all BPNN models have three and one nodes in their input and output layers, respectively. The schematic of the developed feed-forward BPNN is illustrated in Fig. 1.
Results And Discussions
In this section, the procedure for selecting the best structures of the BPNN approach is explained. The scenarios of calculation of methanol loss by using the process simulators are also presented. Finally, comparisons are made among the performances of different intelligent models and two considered simulators for estimation of methanol loss, and the best one is introduced. In the last subsection, an effect of pressure and temperature on the methanol loss is investigated form both modeling and experimental point of views.
Table 1. Complete information about methanol loss in gas phase calculated from experimental data for hydrating mixture systems reported in GPA RR 117 and 149
System Constituents of the
feed stream
Independent variables Dependent
variable Methanol in
aqueous phase (%wt)
Temperature ranges (°C)
Pressure ranges (kPa)
Methanol loss (a)
1 Methane, n-Heptane, Methanol, Water
34.18 – 68.9 -10 – 50 6900 – 7072 6.53 – 170.94
2 Methane,
Methylcyclohexane, Methanol, Water
34.35 – 68.52 -10 – 50 7017 – 7940 6.83 – 153.55
3 Methane, Toluene, Methanol, Water
33.22 – 65.11 -10 – 50 8003 – 9609 6.82 – 162.01
4 Methane, Propane, Methanol, Water
0.25 – 0.50 -3.89 – 37.8 3446.4 – 20871.6 15.25 – 94.46
5 Methane, Carbon dioxide, Methanol, Water
0.25 – 0.49 -3.89 – 37.78 3446.4 – 20726.8 16.11 – 108.18
6 Methane, hydrogen sulfide, Methanol, Water
0.24 – 0.52 -3.88 – 37.78 6892.8 – 20678.6 8.78 – 104.44
7 Methane, Propane, n-Heptane, Methanol, Water
0.25 – 0.50 -3.89 – 37.78 6892.9 – 20706.1 14.62 – 107.99
8 Methane, Propane, Methylcyclohexane, Methanol, Water
0.25 – 0.50 -3.89 – 37.78 6892.9 – 20706.1 12.58 – 105.13
9 Methane, Propane, Toluene, Methanol, Water
0.25 – 0.49 -3.89 – 37.78 6892.9 – 20706.1 11.58 – 107.29
a Kilogram of methanol in one millions standard cubic meters of gas/weight percent of methanol in heavy phase
(aqueous phase)
Selection of The Best ANN Model
Backpropagation Neural Networks
The small number of hidden neurons may cause the BPNN unable to converge to the desired accuracy, while a large number of neurons may lead to the over-fit on training data and cannot generalize the results for testing datasets. In the present study, the optimum number of hidden neurons has been determined by minimizing AARD% between experimental values of methanol loss and their associated calculated values by the BPNN. The AARD% can be calculated by the following equation:
−
= N
i i
cal i i
ML ML ML
N
AARD exp.
. .
exp 100
% (6)
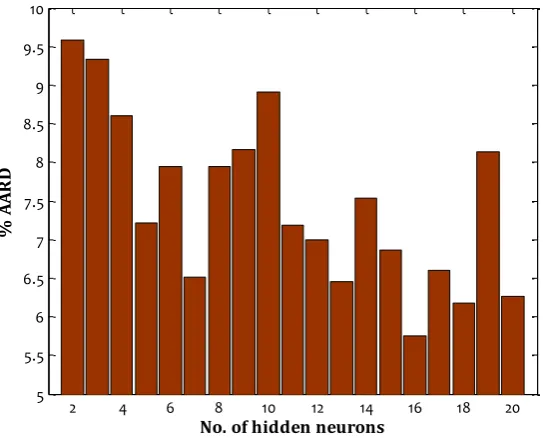
where ML shows methanol loss by gas phase, the exp and cal subscripts represent experimental and calculated values, respectively. Table 2 summarizes the results of trial and error analyses over different configurations of BPNN, differing with respect to the number of hidden neurons. AARD% of testing, training, and overall datasets for various BPNN architectures have been presented in this table. It is obvious that the minimum overall AARD% of 5.75 is obtained by a BPNN model with 16 hidden neurons.
For better comparison and demonstration of this statement, the variation of the overall AARD% respect to the number of hidden neurons is graphically depicted in Fig. 2. As this figure indicates, increasing the numbers of hidden neurons will not always lead to an improvement in the accuracy of the BPNN model.
Fig. 2. Variation of %AARD of different BPNN models with different number of hidden neurons
According to Table 2 and Fig. 2, the BPNN model with only one hidden layer with 16 hidden neurons provides the minimum values for AARD% and hence it selected as an optimum topology. It should be mentioned that all of the BPNN has been trained by the Levenberg-Marquardt algorithm [17].
To yield a better approximation result for the BPNN model, its biases and weights have to be optimized with respect to some performance measures during the training stage. At first, the independent variables are fed to the hidden layer of the BPNN and crossed through the output layer. Thereafter, it is possible to calculate the difference between the network predictions and the actual values and update the network’s parameters (i.e. weights and biases) by minimizing this difference. Variation of the observed difference between the network predictions and the actual values in terms of mean square error for the optimum BPNN model during the training stage is presented in Fig. 3.
2 4 6 8 10 12 14 16 18 20
5 5.5 6 6.5 7 7.5 8 8.5 9 9.5 10
No. of hidden neurons
%
A
A
R
Table 2. Sensitivity analyses for finding the best structure of BPNN model
No. of hidden neurons a %AARD
Testing dataset
%AARD
Training dataset
%AARD
Total dataset
2 10.25 9.37 9.58
3 7.96 9.78 9.34
4 9.07 8.45 8.60
5 8.40 6.83 7.21
6 7.55 8.06 7.94
7 8.67 5.85 6.52
8 5.58 8.69 7.95
9 9.45 7.76 8.16
10 21.04 5.10 8.91
11 15.51 4.57 7.19
12 13.78 4.86 6.99
13 8.69 5.75 6.45
14 12.58 5.94 7.53
15 14.26 4.54 6.86
16 11.60 3.91 5.75
17 14.22 4.20 6.60
18 18.73 2.23 6.18
19 24.29 3.07 8.14
20 13.07 4.13 6.27
the Best architecture among 20 different executions of networks
Fig. 3. Schematic of error variation during the training stage of the optimum BPNN model
Probabilistic Neural Networks
The probabilistic neural networks (PNNs) which are the well-known classifier tools have widely used in pattern recognition problems. PNNs which are categorized as the feedforward ANNs, derived from the Bayesian network and Kernel Fisher discriminant analysis for making a decision with a Parzen window and a non-parametric function [27]. The probability of misclassification tried to be minimized [28]. Mathematical operations of the probabilistic neural networks for conducting the classification are performed in four different layers namely, input layer, pattern layer, summation layer, and output layer. It is widely accepted that the PNN is faster than BPNN. However, PNN requires a representative training set and a large memory. Also, the processing of new cases takes more time.
0 100 200 300 400 500 600 10-4
10-3 10-2 10-1
Epoch
M
ea
n
S
qu
ar
ed
E
rr
or
Although the PNN is a powerful tool for pattern recognition, it seems a good idea to estimate the methanol loss using this intelligent technique, too. This type of network has an adjusting parameter namely spread. It has a great influence on the performance of the PNN model, and it is necessary to select its value properly [29]. Therefore, for finding the best structure of the PNN, the focus is concentrated on the determination of the best value of the spread. Table 3 reports an accuracy of different PNN models, differing respect to the spread value for estimation of methanol loss by hydrocarbon gas phase. It is obvious that the PNN model the smallest value of spread shows the best performance. On the other hand, although this model has predicted the training dataset with acceptable accuracy (AARD = 4.24%), it provides relatively large errors for the prediction of the testing datasets (AARD = 95.56%).
Table 3. Sensitivity analyses on spread parameter of PNN models for finding the best one
Value of spread %AARD
Testing dataset
%AARD Training dataset
%AARD Total dataset
0.1 4.24 96.56 13.27
0.2 4.49 8454.07 831.08
0.3 4.44 672.81 69.82
0.4 3.92 6777.43 666.54
0.5 3.87 78573.27 7690.01
0.6 4.33 669.31 69.38
0.7 4.55 2378.81 236.81
0.8 4.94 101.88 14.42
0.9 4.46 6860.84 675.20
1 4.44 400.45 43.18
Prediction of Methanol Loss by Gas Phase using The Process Simulators
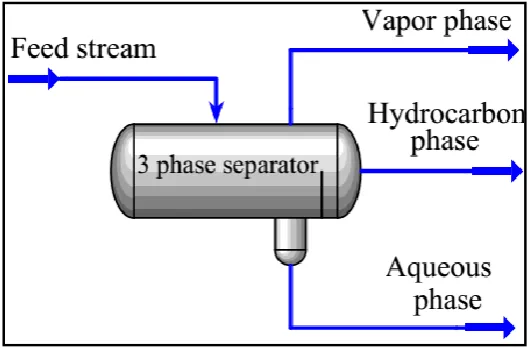
As can be seen in Fig. 4, for prediction of the amount of methanol loss by Aspen-HYSYS and Aspen-plus, a three-phase separator is used. The information of the feed stream is known and fed to these process simulators. By using vapor-liquid as well as liquid-liquid equilibriums, they can simply separate the feed stream to three different products namely vapor phase, light liquid, and heavy liquid phases. Using the composition of methanol in vapor as well as the heavy liquid phase, and volume flow rate of gas, it is possible to calculate the methanol loss using Eq. 5.
Fig. 4. Schematic of three-phase separator used in process simulators
Finding The Best Predictive Tool for Calculation of Methanol Loss
AARD% of the developed BPNN model is 5.75, while the best AARD% 9.71 and 12.57 are provided by Aspen-HYSYS and Aspen-Plus, respectively. Since the PNN is originally a classifier, not a function approximate approach, it presents the worst results for the prediction of methanol loss by the gas phase.
Table 4: %AARD of the best developed BPNN, PNN, and commonly used process simulators for estimation of methanol loss in the gas phase of hydrocarbons
System No. of data points BPNN Aspen-HYSYS Aspen-Plus PNN
1 6 2.20 8.77 11.20 0.1
2 6 4.94 13.85 12.01 18.52
3 6 3.67 9.51 15.62 0.26
4 13 5.22 7.44 16.67 56.05
5 13 8.04 11.83 14.58 6.07
6 12 10.16 10.06 13.26 4.08
7 12 5.35 11.55 12.67 5.63
8 12 5.61 9.44 14.68 6.06
9 12 6.60 13.10 18.88 9.23
Overall %AARD 5.75 9.71 12.57 13.27
It can be simply observed that the designed BPNN model presents the minimum error for the prediction of the considered parameter. Therefore, it could be selected as the best predictive tool for the estimation of the methanol loss by the hydrocarbon gas phase among the considered models. It is observed that for prediction of the methanol loss the following conclusion can be made: BPNN > Aspen-HYSYS > Aspen-Plus > PNN
Prediction of Methanol Loss By Hydrocarbon Gas Phase using The BPNN
Correlation between the results of the BPNN model and the actual experimental methanol loss data for training subsets is illustrated in Fig. 5. The perfect fit (prediction of the BPNN model equal with real experimental data) is shown by a solid line. The close proximity of the obtained results by the BPNN model to the perfect fit in Fig. 5 reveals an excellent performance of the proposed model in the prediction of the experimental data of methanol loss.
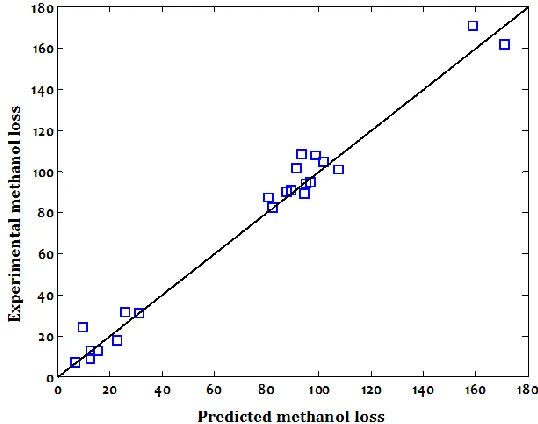
Also, the performance of the optimum BPNN approach was evaluated using the testing dataset which they were not used in the training stage. Correlation between the predicted and experimental data for methanol loss for the testing data is illustrated in Fig. 6. It can be simply seen that the developed BPNN model accurately estimated the experimental data and its predictions are in close agreement with them.
Parametric Study
In this section, an effect of pressure, as well as temperature on the methanol loss by gas phase, is determined both experimentally and theoretically. Fig. 7 explains that the amount of methanol loss increases by increasing temperature and pressure.
Moreover, the predicted values for methanol loss by two most accurate models i.e. BPNN and Aspen-HYSYS are also presented in this figure. It is obvious that the BPNN model not only persuades the trend of experimental data, but it also correctly predicted all individual data-points.
Fig. 6.The plot of experimental data of methanol loss versus predicted values by the optimum BPNN for the testing dataset
Conclusions
The purpose of this work was to develop a practical/simple model based on artificial neural network for prediction of methanol loss by the hydrocarbon gas phase using experimental datasets of GPA RR 117 and 149. Optimum configurations of the BPNN model have been determined by conducting a trial and error procedure on the number of hidden neurons, while the best structure of PNN is selected by focusing on its spread parameter. The predictive capabilities of these intelligent approaches were then compared with two commonly used process simulators. The amount of methanol loss by the gas phase is calculated as a function of some easily and available variables i.e. pressure, temperature, and weight percent of methanol in the aqueous phase. An overall AARD% of 5.75 and 13.27 were observed between experimental and calculated data by the BPNN and PNN, respectively. The best AARD% of 9.71 and 12.57 for prediction of methanol loss by gas phase were provided by Aspen-HYSYS and Aspen-Plus, respectively. Sensitivity analyses confirm that the results of the BPNN model have better agreement with the experimental data than the other considered simulators/approaches. Our results show that the proposed BPNN model is both a practical and reliable predictive tool for modeling the methanol loss by hydrocarbon gas phase over wide ranges of operating conditions. This BPNN model can be simply coupled with other approaches/software for minimizing as well as controlling the methanol loss in the hydrate inhibition units.
References
[1] Ghaedi H, Javanmardi J, Rasoolzadeh A, Mohammadi AH. Experimental Study and Thermodynamic Modeling of Methane Hydrate Dissociation Conditions in the Simultaneous Presence of BMIM-BF4 and Ethanol in Aqueous Solution. Journal of Chemical & Engineering Data. 2018 Apr 16;63(5):1724-32.
[2] Hammerschmidt EG. Formation of gas hydrates in natural gas transmission lines. Industrial & Engineering Chemistry. 1934 Aug 1;26(8):851-5.
[3] Kvamme B, Selvåg J, Saeidi N, Kuznetsova T. Methanol as a hydrate inhibitor and hydrate activator. Physical Chemistry Chemical Physics. 2018;20(34):21968-87.
[4] Hammerschmidt EG. Gas hydrate formations, A further study on their prevention and elimination from natural gas pipe lines. Gas. 1939 May;15(5):30-4.
[5] Covington, Kimberly C., John T. Collie III, and Steven D. Behrens. "Selection of hydrate suppression methods for gas streams." 78th GPA Annual Convention, Nashville, TN. 1999.
[6] Esteban A, Hernandez V, Lunsford K. Exploit the benefits of methanol. InProceedings of the 79th
Gas Processors Association Annual Convention (GPA’00) 2000 Mar.
[7] Eslamimanesh A, Mohammadi AH, Richon D, Naidoo P, Ramjugernath D. Application of gas hydrate formation in separation processes: A review of experimental studies. The Journal of Chemical Thermodynamics. 2012 Mar 1;46:62-71.
[8] Iraci LT, Essin AM, Golden DM. Solubility of methanol in low-temperature aqueous sulfuric acid and implications for atmospheric particle composition. The Journal of Physical Chemistry A. 2002 Apr 25;106(16):4054-60.
[9] Bahadori A, Vuthaluru HB. Prediction of methanol loss in vapor phase during gas hydrate inhibition using Arrhenius-type functions. Journal of loss Prevention in the Process Industries. 2010 May 1;23(3):379-84.
[10]Bahadori A, Vuthaluru HB. Predictive tool for the estimation of methanol loss in condensate phase during gas hydrate inhibition. Energy & Fuels. 2010 Apr 14;24(5):2999-3002.
[11]Ghiasi MM, Arabloo M, Bahadori A, Zendehboudi S. Prediction of methanol loss in liquid hydrocarbon phase during natural gas hydrate inhibition using rigorous models. Journal of Loss Prevention in the Process Industries. 2015 Jan 1;33:1-9.
[13]Teixeira AM, de Oliveira Arinelli L, de Medeiros JL, Ofélia de Queiroz FA. Recovery of thermodynamic hydrate inhibitors methanol, ethanol and MEG with supersonic separators in offshore natural gas processing. Journal of Natural Gas Science and Engineering. 2018 Apr 1;52:166-86.
[14]Freire MG, Santos LM, Marrucho IM, Coutinho JA. Evaluation of COSMO-RS for the prediction of LLE and VLE of alcohols+ ionic liquids. Fluid Phase Equilibria. 2007 Jul 15;255(2):167-78. [15]Ng HJ, Chen CJ. Vapour-liquid and Vapour-liquid-liquid Equilibria for H2S, CO2, Selected Light
Hydrocarbons and a Gas Condensate in Aqueous Methanol Or Ethylene Glycol Solutions: GPA Project 905. Gas Processors Association; 1995.
[16]Ng HJ, Robinson DB. The solubility of methanol or glycol in water-hydrocarbon systems. Gas Processors Association Research Reports. 1988 Mar;117.
[17]Vaferi B, Eslamloueyan R, Ayatollahi S. Automatic recognition of oil reservoir models from well testing data by using multi-layer perceptron networks. Journal of Petroleum Science and Engineering. 2011 Jun 1;77(3-4):254-62.
[18]Vaferi B, Samimi F, Pakgohar E, Mowla D. Artificial neural network approach for prediction of thermal behavior of nanofluids flowing through circular tubes. Powder Technology. 2014 Nov 1;267:1-0.
[19]Amini Y, Fattahi M, Khorasheh F, Sahebdelfar S. Neural network modeling the effect of oxygenate additives on the performance of Pt–Sn/γ-Al 2 O 3 catalyst in propane dehydrogenation. Applied Petrochemical Research. 2013 Jul 1;3(1-2):47-54.
[20]Davoudi E, Vaferi B. Applying artificial neural networks for systematic estimation of degree of fouling in heat exchangers. Chemical Engineering Research and Design. 2018 Feb 1;130:138-53. [21]Hoseinpour SA, Barati‐Harooni A, Nadali P, Mohebbi A, Najafi‐Marghmaleki A, Tatar A, Bahadori
A. Accurate model based on artificial intelligence for prediction of carbon dioxide solubility in aqueous tetra‐n‐butylammonium bromide solutions. Journal of Chemometrics. 2018 Feb;32(2):e2956.
[22]Liu Z, Zuo Q, Wu G, Li Y. An artificial neural network developed for predicting of performance and emissions of a spark ignition engine fueled with butanol–gasoline blends. Advances in Mechanical Engineering. 2018 Jan;10(1):1687814017748438.
[23]Oparaji U, Sheu RJ, Bankhead M, Austin J, Patelli E. Robust artificial neural network for reliability and sensitivity analyses of complex non-linear systems. Neural Networks. 2017 Dec 1;96:80-90. [24]Gholami E, Vaferi B, Ariana MA. Prediction of viscosity of several alumina-based nanofluids using
various artificial intelligence paradigms-Comparison with experimental data and empirical correlations. Powder Technology. 2018 Jan 1;323:495-506.
[25]Vaferi B, Eslamloueyan R, Ghaffarian N. Hydrocarbon reservoir model detection from pressure transient data using coupled artificial neural network—Wavelet transform approach. Applied Soft Computing. 2016 Oct 1;47:63-75.
[26]Dua V. A mixed-integer programming approach for optimal configuration of artificial neural networks. Chemical Engineering Research and Design. 2010 Jan 1;88(1):55-60.
[27]Specht DF. Probabilistic neural networks. Neural networks. 1990 Jan 1;3(1):109-18.
[28]Zeinali Y, Story BA. Competitive probabilistic neural network. Integrated Computer-Aided Engineering. 2017 Jan 1;24(2):105-18.
[29]Yi JH, Wang J, Wang GG. Improved probabilistic neural networks with self-adaptive strategies for transformer fault diagnosis problem. Advances in Mechanical Engineering. 2016 Jan 6;8(1):1687814015624832.