51 | P a g e
Alumni Loyalty in Higher Education (Case of Three Private University Alumni of BA
Business Administration Programs)
Goderdzi Buchashvili *
Nino Jikia
Irma Mesiridze
Abstract
In the 21st century, the increasing need for enhancing the quality of education in higher educational institutions has caught a high interest of researchers in studying the influence of quality of educational services on students’ satisfaction and graduates’ loyalty. Taking into account the purpose of the study, the questionnaire used in it contains predictive and descriptive questions. The research describes different factors, such as service quality, facilities, administrative staff helpfulness, university location, and academic staff professionalism impact on the level of alumni loyalty. The information has been obtained at three private universities in Georgia. Research results were gathered for comparative analysis. The research variable, in this case factors affecting the level of loyalty, should be paid attention to, in order to gain a high level of alumni loyalty.
Keywords: Student satisfaction; alumni loyalty; reputation of the university
Introduction
Education is not a typical sort of business, but while managing and administering the educational system, mostly business strategies and approaches are used. This study concentrates on the term ‘loyalty’ through the lens of education. Customer loyalty plays a vital role in any kind of business organization’s daily life. Customer loyalty is a determinant of success or failure of any kind of organization. This study is about alumni / student loyalty and different factors affecting the level of alumni / students’ loyalty. In modern world, educational institutions mostly concentrate on alumni loyalty, and they try their best in their effort to achieve a high level of alumni loyalty, as they see how loyal alumni aid university in a lot of ways, starting with financial aid and finishing with word of mouth communication.
This study also investigates how factors such as satisfaction, service quality, trust and commitment influence alumni loyalty. There is an ongoing process between these four factors and alumni loyalty. High level of satisfaction is a determinant of high level of alumni loyalty. The students who are satisfied with service quality normally have a high level of satisfaction. Satisfied students trust their educational institutions and show a great commitment towards them. Accordingly, all four factors play a vital role in determining alumni loyalty level. To find out how these factors affect alumni loyalty level, a survey was carried out among three private university students.
* Assoc. Prof. Dr. International Black Sea University, Georgia
Email: gbuchashvili@ibsu.edu.ge
Agrarian University, Georgia
Email: n.jikia@agruni.edu.ge
Assoc. Prof. Dr. International Black Sea University, Georgia
52 | P a g e
Literature Review
Loyalty is a comparatively new term in higher education, but it is well-known and significantly important in business organizations. Different studies have shown and proved that loyalty is essentially important for doing any kind of business (Gremler & Brown, 1996). According to them, a loyal customer is someone who:
Regularly uses the service provider;
Really likes the organization and thinks very highly of it;
Does not ever consider using another service provider for this service.
Although education is not a typical sort of business, in an educational context, loyalty plays a vital role as well. It is believed that there is no future for any kind of business if it does not have loyal customers, as loyal customers are determinant of the future success and existence of any kind of organization. According to Henning-Thurau, Langer, & Hansen (2001), if any kind of organization wants to gain a long-term success, it is important to turn directly towards an issue such as customers’ loyalty. Moreover, students’ and alumni’s loyalty is a priority for many higher education institutions and it is quite reasonable because higher education institutions as any kind of other business organizations have their customers. The direct customers are students and alumni. Higher education institutions, to some point, are business organizations, as they are using the same strategies and management that can be used in businesses. In higher education, student /alumni loyalty plays a vital role.
There is no agreed stance about the term ‘loyalty’. Different scholars offer different definitions. According to Oliver (1997) cited in Helgesen and Nesset (2007), customer loyalty is “a deeply held commitment to re-buy or support a preferred product or service consistently in the future, despite situational influences and marketing efforts having the potential to cause switching behavior” (p.42). While Lam et al (2004) cited in Helgesen and Nesset (2007) see it as “a buyer’s overall attachment or deep commitment to a product, service, brand, or organization” (p.42). This proves that loyal customers have a significant impact on organizations’ success or failure. Moreover, the priority for any kind of organization must be having more loyal customers rather than non-loyal ones.
According to Henning-Thurau, Langer, and Hansen (2001), in higher education institutions, loyalty must be based on strong relationships with students, because these students determine the financial success of a university. Loyalty is also considered to be a ‘strategic competitive advantage’ because of two reasons: firstly, attracting new students is much more expensive than retaining the existing ones; secondly, if students’ loyalty is higher, after graduation they help universities not only by word of mouth communication but also they are ready to contribute to universities’ development financially and, even more, they are eager to employee graduates of the university (Rojas-Mendez, Vasquez-Parraga, Kara, & Cerda-Urrutia, 2009). Loyal students and alumni are the guarantee of financial success of a university and not only; loyal students / alumni promote universities through the word of mouth communication.
After graduating, a loyal student may continue to support his or her academic institution (Henning-Thurau, Langer, & Hansen, 2001):
financially (e.g., through donations or financial support of research projects);
through word-of-mouth promotion to other prospective, current, or formerstudents;
53 | P a g e Clearly, the advantages that loyal students bring to their university are not limited to the time that the students spend at the university; in fact, after graduation, loyal students bring more advantages to their university. According to Ishakova, Hoffmann & Hilbert (2015), satisfied alumni may later become a great support for universities in such areas as lobbying, volunteering, information, donation, investment and networking.
According to Rojas-Mendez, Vasquez-Parraga, Kara, & Cerda-Urrutia(2009), “student loyalty is directly explained by commitment, which in turn is directly explained by trust, which in turn is explained by satisfaction, which in turn is explained by service quality in the long-term relationship between higher education institutions and their students. All antecedents of loyalty, except commitment, may have some effect on loyalty; but their influence is indirect, not direct” (p. 27). It is quite reasonable to draw a line between loyalty and the following factors such as satisfaction, service quality and commitment.
Many factors have been identified by the scholars that make alumni loyal to the university they graduate from; the most crucial features are: high quality of teaching and learning, educational software programs, web-page and advanced communication systems, social, cultural and sport activities on the campus, high professionalism and status of the staff, effective alumni office work, openness and integrity, and supportive administrative staff of the university (Gardner, 2000).
According to McCloy and Liu (2010), to improve alumni satisfaction level universities should put their effort in improving teaching and learning processes and the outcome of the program, and they should also help their students gain necessary skills for obtaining high quality jobs. After graduation, alumni are more loyal towards the universities they graduated from, if they have good positions on the labor market. Preparing students for the labor market must be also number one priority for universities, if they want to have loyal alumni. Loyalty is not only expressed during the period spent at university, but it continues soon after graduation and beyond. It is reasonable why all business organizations pay a great attention to such an issue as customer loyalty, and educational institutions must not be exceptions; certainly, they are not typical business organizations, but they have many factors that unite them with other, more typical, businesses.
Satisfied students can attract more and more new students through the word of mouth, as they inform their friends on their Alma Mater. The positive description of a university service and quality is vitally important (Farahmandian, Minavand, & Afshardost, 2013). Russell (2005) claims that one of the most important priorities for higher education institutions must be providing students with perceived service quality. For this, higher education institutions must pay a great attention to what students want to learn instead of teaching them what teachers consider to be important (Oldfield & Baron, 2000). According to Shekarchizadeh, Rasli, & Hon-Tat (2011), to show how important students’ satisfaction is, it is necessary to find out what the outcomes of dissatisfied students are.
Research Methodology and Design
In this study, the survey contains 26 questions that students had to answer. The first two questions were about the graduation year; the next 24 questions were rating questions, where students had to rate different factors they encountered at university. The rating scale was 1 to 5; (5 is excellent and 1 is poor)) and the final two questions were yes/no questions. The questions were designed so that they help to gather the data related to the title.
54 | P a g e The research is deductive in its origin. This means that it aimed to test a theoretical issue based on the analysis in literature review. Hypotheses was put forward and the research questions were formulated in order to prove the accuracy of the hypotheses. Finally, the research was conducted to test the hypotheses drawn from the literature review.
Hypotheses
The study aims to evaluate the loyalty level of alumni of these universities and to find out how different factors affect alumni loyalty level at the University A, University C, and University B. It also aims to offer recommendations based on students’ and alumni’s responses. Based on the literature review, the following hypotheses can be formulated:
Hypothesis 1: Alumni satisfaction has a positive impact on alumni loyalty.
Hypothesis 2: Service quality determines the level of satisfaction and satisfaction itself determines the level of alumni
loyalty.
Hypothesis 3: A high level of commitment results in a high level of loyalty.
Research Objectives
The specific objectives of the study include the following:
1. To find out the degree of alumni loyalty in private universities;
2. To prove that factors such as satisfaction, service quality, trust and commitment affect alumni loyalty, based on the case of the University A, University C and University B.
Study Population and Research Instruments
The population of the research was alumni from the University A, University B and University C. The number of the respondents was 120: 40 from each university. All participants were really helpful and took part in the research with great enthusiasm, as all participants were called personally and were requested to take part in the research.
The questions were formulated based on the literature review. An online questionnaire was the instrument used to collect the data from the respondents. The questionnaire was prepared and the data were collected through the use of Google Forms. Questionnaires were filled out by participants and returned to Google Drive Response Sheet. In total, 24 questions were asked. The questionnaire consisted of five sections; section one consisted of 3 questions: graduation year, citizenship, and GPA (Graduation Cumulative Grade Point Average). Section two consisted of sixteen questions about service quality, location, academic staff professionalism, etc. Section three consisted of two questions about the degree to which student expectations were met and whether they would encourage their friends and relatives to study at the same university.
Limitations of the Research
55 | P a g e
Data Analysis, Findings and Summary
Demographic data
All alumni were from the faculty of business administration, their graduation year varied from 2011 to 2016. All alumni who took part in the research from University B and University C were contacted personally on the phone and they with great enthusiasm participated in this survey.
Figure1. Availability of Tuition Fee Discounts
Figure 1 shows that the satisfaction rate connected to tuition fee discounts varies greatly. 17.5% of the University A alumni, 40%
of University B alumni, 20% of University C alumni responded that it is excellent. 17.5 % of the University A alumni, 26.7 % of University B alumni and 30.3 % of University C alumni responded that it is good. 22.5% of the University A alumni, 6.7 % of University B alumni and 40% of University C alumni responded that it is average. 12.5% of University A alumni, 13.3% of University B alumni, 3.0% of University C alumni responded that it is less sufficient 30 % of University A alumni, 13.3% of University B alumni and 6.7 % of University C alumni responded that it is the least sufficient.
018% 018%
023%
013%
030%
040%
027%
007%
013% 013%
020%
030%
040%
003%
007%
E X C E L L E N T G O O D A V E R A G E L O W V E R Y L O W
A B C
035%
018%
035%
010%
003%
040%
033%
020%
007%
000%
040%
030%
007%
010% 013%
V E R Y A C C E P T A B L E A C C E P T A B L E S O M E H O W
A C C E P T A B L E
U N A C C E P T A B L E V E R Y
U N A C C E P T A B L E
56 | P a g e
Figure 2. Tuition Fee Payment Policy
Figure 2 shows that on average alumni are satisfied with Tuition Fee Payment Policy. 35% of the University A alumni, 40 % of
University B alumni, 40% of University C alumni responded that it is very acceptable. 17.5 % of the University A alumni, 33.3 % of University B alumni and 29.7 % of University C alumni responded that it is acceptable. 35% of University A alumni, 20% of University B alumni and 6.7% of University C alumni responded that it is somehow acceptable. 10% of the University A alumni, 6.7% of University B alumni, 10.3% of University C alumni responded that it is unacceptable 2.5 % of University A alumni, 0% of University B alumni and 13.3 % of University C alumni responded that it is very unacceptable.
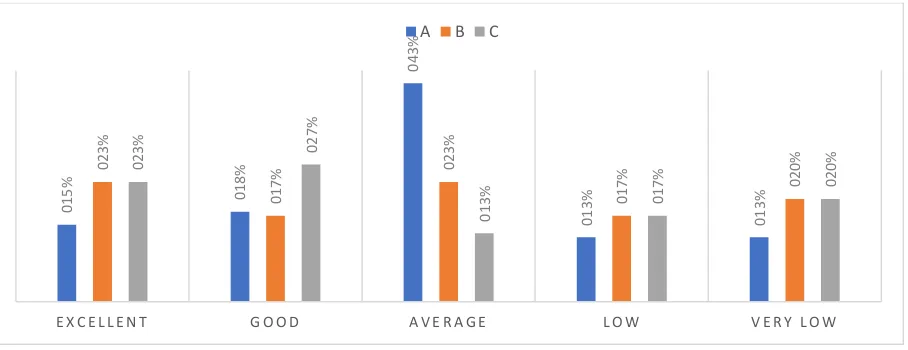
Figure 3. Scholarship
Figure 3 also shows the satisfaction rate in connection with scholarship is not very high. 2.5% of the University A alumni, 10% of
University B alumni, 10% of University C alumni responded that it is excellent. 7.5 % of the University A alumni, 16.7 % of University B alumni and 12.7 % of University C alumni responded that it is good. 23 % of University A alumni, 16.7 % of University B alumni and 20.6% of University C alumni responded that it is average. 10% of the University A alumni, 20% of University B alumni, 20% of University C alumni responded that it is low 57 % of University A alumni, 36.6% of University B alumni and 36.7 % of University C alumni responded that it is very low.
003%
008%
023%
010%
057%
010%
017% 017% 020%
037%
010% 013%
021% 020%
037%
E X C E L L E N T G O O D A V E R A G E L O W V E R Y L O W
A B C
015% 018% 018%
023%
028%
043%
017%
023%
013%
003%
044%
015%
024%
013%
003%
E X C E L L E N T G O O D A C C E P T A B L E P O O R L E A S T S U I T A B L E
57 | P a g e
Figure 4. Geographic Location of Universities
Figure 4 shows the importance of location of universities. The answers vary very much as well, but on average, this table shows
that the respondents are more or less satisfied with geographic locations of their universities. 15% of the University A alumni, 43.3% of University B alumni, 44% of University C alumni responded that it is excellent. 17.5 % of University A alumni, 16.7 % of University B alumni and 15 % of University C alumni responded that it is good. 17.5% of University A alumni, 23.3 % of University B alumni and 24.4% of University C alumni responded that it is acceptable 22.5% of the University A alumni, 13.4 % of University B alumni, 13.3% of University C alumni responded that it is poor 27.5 % of The University A alumni, 3.3% of University B alumni and 3.3 % of University C alumni responded that it is least suitable.
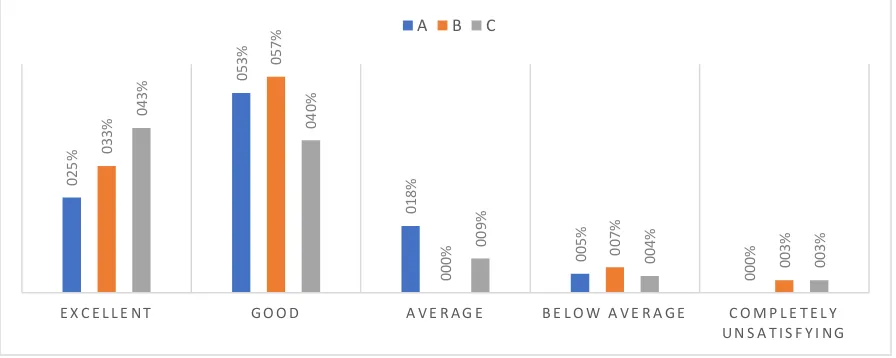
Figure 5. Learning Facilities
Figure 5 shows that most students are satisfied with learning facilities at their universities. At the University A, 25% responded
that learning facilities are excellent, 52.5 % responded they are good, 17.5% responded they are average, 5% responded it is below average and 0% responded they are completely unsatisfying. However, at University B, 33.3% responded that evaluated as excellent, 56.7% responded that they are good, 0% responded that they are average, 6.7% responded that they are below average and 3.3% responded that they are completely unsatisfying. At University C, 43.3% responded that learning facilities are excellent, 40% responded that they are good, 9% that they are average, 4.4% that they are below average and 3.3% responded evaluated as completely unsatisfying.
025%
053%
018%
005%
000%
033%
057%
000%
007%
003%
043%
040%
009%
004% 003%
E X C E L L E N T G O O D A V E R A G E B E L O W A V E R A G E C O M P L E T E L Y
U N S A T I S F Y I N G
58 | P a g e
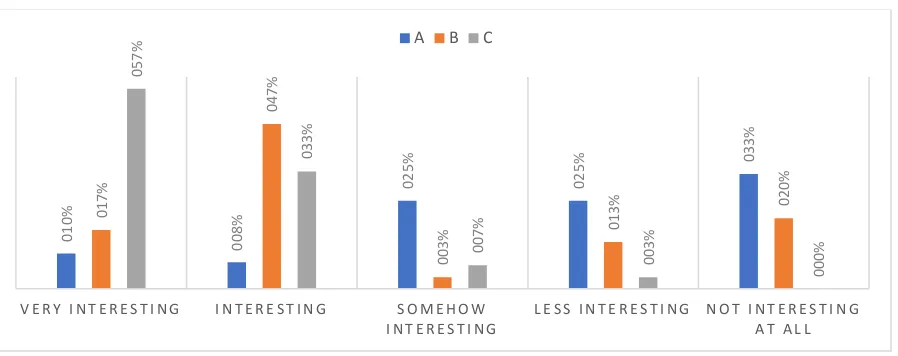
Figure 6.Activities of the Students’ Self-Governance
Figure 6 shows how the answers concerning students’ self-governance vary. At the University A, respondents are less satisfied
with the activities of the students’ self-governance, 10% responded that they are very interesting,7.5% responded that they are interesting, 25% responded they are somehow interesting, 25% responded it is less interesting while 32.5% responded they are not interesting at all. However, at University B, 16.7 % responded that activities are very interesting, 46.7% responded that they are interesting, 3.3% responded that they are somehow interesting, 13.3% responded that they are less interesting and 20% responded that they are not interesting at all. At University C, 56.7% responded that self-governance activities are very interesting, 33.3% responded that they are interesting, 6.7% that they are somehow interesting, 3.3% that they are less interesting and 0% responded that they are not interesting at all.
Figure 7. Social and Cultural Activities
Figure 7 shows that on average the research participants are satisfied with social and cultural activities held at their universities.
10% of the University A alumni, 33.3% of University B alumni and 33.3% of University C alumni responded that the activities are excellent. 20 % of the University A alumni, 40 % of University B alumni and 40 % of University C alumni responded that they are good. 37.5% of the University A alumni, 20 % of University B alumni and 23.3% of University C alumni responded that they are average. 20% of the University A alumni, 3.4% of University B alumni, 0% of University C alumni responded that they are less
010%
008%
025% 025%
033%
017%
047%
003%
013%
020%
057%
033%
007%
003%
000%
V E R Y I N T E R E S T I N G I N T E R E S T I N G S O M E H O W
I N T E R E S T I N G
L E S S I N T E R E S T I N G N O T I N T E R E S T I N G
A T A L L
A B C
010%
020%
038%
020%
013%
033%
040%
020%
003% 003%
033%
040%
023%
000% 003%
E X C E L L E N T G O O D A V E R A G E L E S S I N T E R E S T I N G N O T I N T E R E S T I N G
A T A L L
59 | P a g e interesting. 12.5 % of the University A alumni, 3.3% of University B alumni and 3.4 % of University C alumni responded that they are not interested at all.
Figure 8. University Web Page
Figure 8 shows how alumni rate their university web page. In this case, the respondents of all three private universities on average
are satisfied with the university web pages. 22.5% of the University A alumni, 33.3% of University B alumni, 23.3% of University C alumni responded that it is excellent. 22.5 % of the University A alumni, 33.3 % of University B alumni and 40 % of University C alumni responded that it is good. 40% of University A alumni, 16.7 % of University B alumni and 33.3% of University C alumni responded that it is average.12.5% of University A alumni, 13.3% of University B alumni, 0% of University C alumni responded that it is poor 2.5 % of University A alumni, 3.4% of University B alumni and 3.4 % of University C alumni responded that it is very poor.
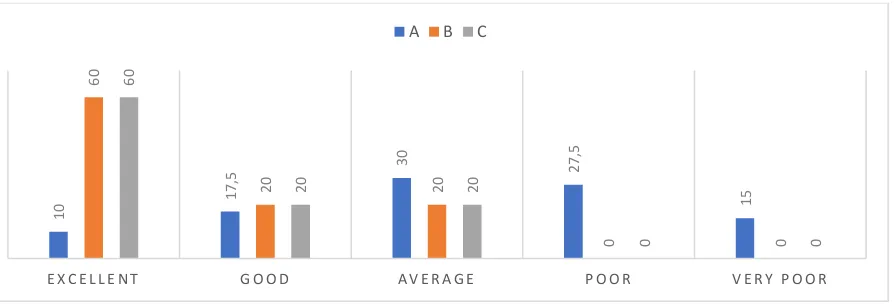
Figure 9. Career Planning Office Work
Figure 9 shows the satisfaction level with career planning office work. The answers vary. At University A, 10% responded that it is
excellent while at University B and University C, 60% responded it is excellent. At the University A, 17.5 % responded that it is good and at Agricultural and University C 20 % responded that it is good. As we can notice, at University B and University C, alumni are more satisfied with career planning office work than at the University A.
22,
5
22,
5
40
12,
5
2,
5
33,
3
33,
3
16,
7
13,
3
3,
4
23,
3
40
33,
3
0 3,
4
E X C E L L E N T G O O D A V E R A G E P O O R V E R Y P O O R
A B C
10
17,
5 30 27,
5
15
60
20 20
0 0
60
20 20
0 0
E X C E L L E N T G O O D A V E R A G E P O O R V E R Y P O O R
60 | P a g e
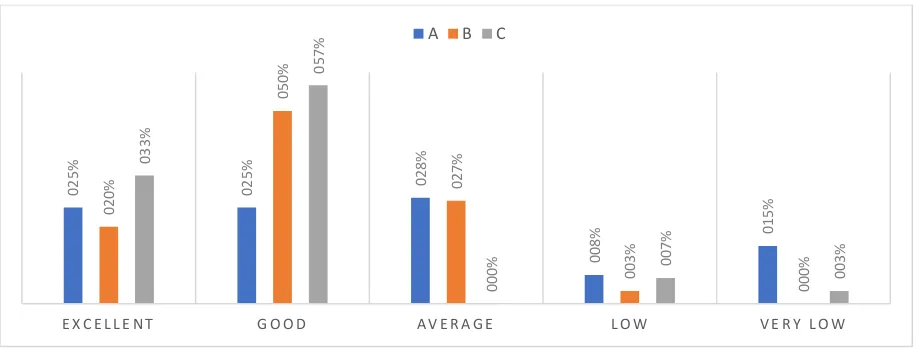
Figure 10. Links with Industry and the field
Figure 10 shows the satisfaction level connected with links with industry and the field. In this case, the answers vary as well. 15%
of the University A alumni responded that they are very strong 20% of University B and 33.3 % of University C alumni responded the same. 25% of the University A alumni, 50% of University B alumni and 56.7% of University C alumni responded they are strong 22.5% of the University A alumni, 26.7 % of University B alumni and 0% of University C alumni responded that they are average. 25% of the University A alumni, 3.3% of University B alumni, 6.7% of University C alumni responded that they are weak. 12.5 % of the University A alumni, 0% of University B alumni and 3.3 % of University C alumni responded that they are very weak. Links with Industry and Sphere is one of the most essential factors influencing alumni satisfaction and loyalty level. Universities should prioritize this factor as a determinant of alumni loyalty and suggest to improve actions for universities to have links with industry and sphere.
Figure 11.Students’ Exchange Programs
Figure 11 shows alumni satisfaction level with students exchange programs. 25% of the University A alumni, 20% of University B
alumni, and 33.3% of University C alumni responded that it is excellent. 25 % of the University A alumni, 50 % of University B alumni and 56.7 % of University C alumni responded that it is good. 27.5% of the University A alumni, 26.7 % of University B alumni and 0% of University C alumni responded that it is average. 7.5% of the University A alumni, 3.3% of University B alumni,
015%
025%
023% 025%
013%
020%
050%
026%
003%
000%
033%
057%
000%
007%
003%
E X C E L L E N T G O O D A V E R A G E W E A K V E R Y W E A K
A B C
025% 025% 028%
008%
015%
020%
050%
027%
003%
000%
033%
057%
000%
007%
003%
E X C E L L E N T G O O D A V E R A G E L O W V E R Y L O W
61 | P a g e and 6.7% of University C alumni responded that it is low. 15 % of the University A alumni, 0% of University B alumni and 3.3 % of University C alumni responded that it is very low. In this case, the answers vary as well.
Figure 12. Quality of Teaching
Figure 12 shows that the research participants are quite satisfied with the quality of teaching. 12.5% of the University A alumni,
23.3 % of University B alumni and 33.3% of University C alumni responded that it is excellent. 40% of the University A alumni, 53.3% of University B alumni and 56.7 % of University C alumni responded that it is good. 32.5% of the University A alumni, 20% of University B alumni and 3.3% of University C alumni responded that it is average. 15% of the University A alumni, 3.4% of University B alumni, and 6.7% of University C alumni responded that it is low. None of the alumni in all universities responded that it is very low. According to the data, we see that most alumni are satisfied with the quality of teaching. It can be assumed that in the Georgian context, the quality of teaching is one of the most important factors influencing alumni satisfaction and loyalty level.
Figure 13. Availability of International Professors
Figure 13 shows that the answers of the research participants vary in what concerns the availability of international professors.
15% of the University A alumni, 23.3% of University B alumni, and 23.3% of University C alumni responded that it is excellent. 17.5% of the University A alumni, 16.7% of University B alumni, and 26.7% of University C alumni responded that it is good. 42.5%
013%
040%
033%
015%
000%
023%
053%
020%
003%
000%
033%
057%
003% 007%
000%
E X C E L L E N T G O O D A V E R A G E L O W V E R Y L O W
A B C
015% 018%
043%
013% 013%
023%
017%
023%
017%
020%
023%
027%
013%
017%
020%
E X C E L L E N T G O O D A V E R A G E L O W V E R Y L O W
62 | P a g e of the University A alumni, 23.3% of University B alumni, and 13.3% of University C alumni responded that it is average.12.5% of the University A alumni, 16.7% of University B alumni, and 16.7% of University C alumni responded that it is low. 12.5 % of the University A alumni, 20% of University B alumni and 20 % of University C alumni responded that it is very low.
Figure 14. Reputation of Academic Staff
Figure 14 shows that the respondents are satisfied with the reputation of academic staff. 22.5% of the University A alumni, 20%
of University B alumni, and 43.3% of University C alumni responded that it is the highest. 40% of the University A alumni, 43.3% of University B alumni, and 53.3% of University C alumni responded that it is high. 22.5% of the University A alumni, 33.3% of University B alumni, and 0% of University C alumni responded that it is average.7.5% of the University A alumni, 3.4% of University B alumni, and 3.4% of University C alumni responded that it is low. 7.5 % of the University A alumni, 0% of University B alumni and 0 % of University C alumni responded that it is very low.
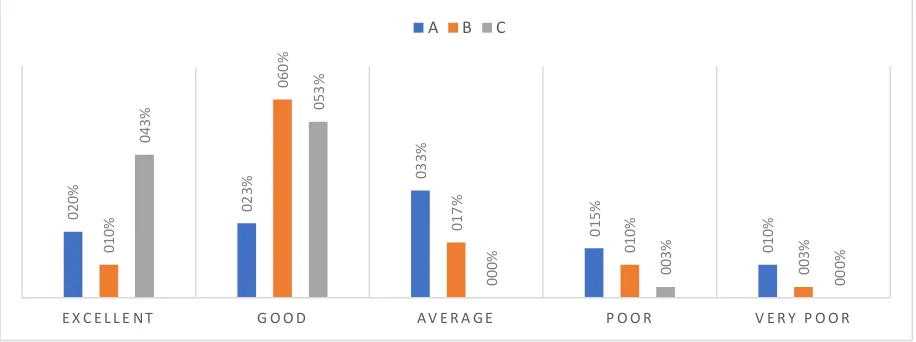
Figure 15. Alumni Office Work
Figure 15 shows that the respondents are quite satisfied with alumni office work. 20% of the University A alumni, 10% of University
B alumni, and 43.3% of University C alumni responded that it is excellent. 22.5% of the University A alumni, 60% of University B alumni, and 53.3% of University C alumni responded that it is good. 32.5% of the University A alumni, 16.7% of University B alumni, and 0% of University C alumni responded that it is average.15% of the University A alumni, 10% of University B alumni, and 3.3%
023%
040%
023%
008% 008%
020%
043%
033%
003%
000%
043%
053%
000% 003% 000%
E X C E L L E N T G O O D A V E R A G E L O W V E R Y L O W
A B C
020% 023%
033%
015%
010%
010%
060%
017%
010%
003%
043%
053%
000% 003% 000%
E X C E L L E N T G O O D A V E R A G E P O O R V E R Y P O O R
63 | P a g e of University C alumni responded that it is poor 10 % of the University A alumni, 3.3% of University B alumni and 0.1 % of University C alumni responded that it is very poor.
Figure16. The Helpfulness of the Administrative Staff
Figure 16 shows that the research participants are quite satisfied with administrative staff’s helpfulness. 32.5% of the University A
alumni, 40% of University B alumni, and 20% of University C alumni responded that it is excellent. 14% of the University A alumni, 40% of University B alumni, and 50% of University C alumni responded that it is good. 30% of the University A alumni, 20% of University B alumni, and 16.7% of University C alumni responded that it is average.15% of the University A alumni, 0% of University B alumni, and 3.3% of University C alumni responded that it is weak. 7.5 % of the University A alumni, 0% of University B alumni and 10 % of University C alumni responded that it is very weak.
Figure 17. The Helpfulness of the Academic Staff
Figure 17 shows that the research participants are quite satisfied with the helpfulness of the academic staff. 32.5% of the University
A alumni, 46% of University B alumni, and 20% of University C alumni responded that it is excellent. 15% of University A alumni, 30.7% of University B alumni, and 50% of University C alumni responded that it is good. 30% of the University A alumni, 20% of University B alumni, and 16.7% of University C alumni responded that it is average.15% of the University A alumni, 3.3% of
033%
015%
030%
015%
008%
040% 040%
020%
000% 000%
020%
050%
017%
003%
010%
E X C E L L E N T G O O D A V E R A G E W E A K V E R Y W E A K
A B C
033%
015%
030%
015%
008%
046%
031%
020%
003%
000%
020%
050%
017%
003%
010%
E X C E L L E N T G O O D A V E R A G E W E A K V E R Y W E A K
64 | P a g e University B alumni, and 3.3% of University C alumni responded that it is weak. 7.5 % of the University A alumni, 0% of University B alumni and 10 % of University C alumni responded that it is very weak.
Figure 18. Student Affairs Office Work
Figure 18 shows alumni satisfaction level with student affairs office work. 15% of the University A alumni, 36.7% of University B
alumni, and 46% of University C alumni responded that it is excellent. 20% of the University A alumni, 53.3% of University B alumni, and 30.7% of University C alumni responded that it is good. 30% of the University A alumni, 6.7% of University B alumni, and 20% of University C alumni responded that it is average. 20% of the University A alumni, 3.3% of University B alumni, and 3.3% of University C alumni responded that it is poor. 15 % of the University A alumni, 0% of University B alumni and 0 % of University C alumni responded that it is very poor.
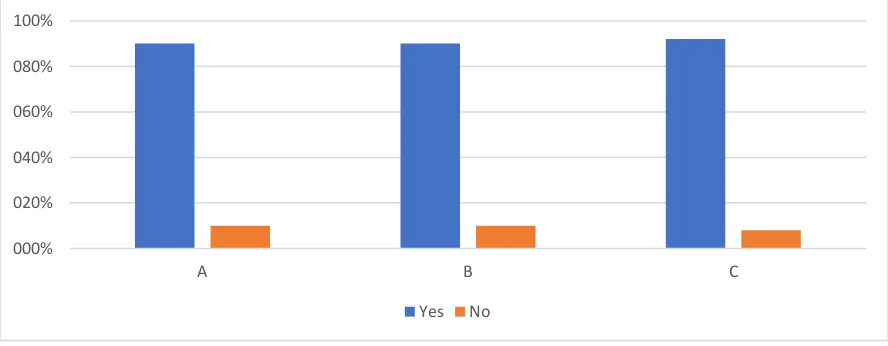
Figure 19. Alumni Expectation
Figure 19 shows that the alumni expectations were met. 90% of the University A alumni, 90% of University B alumni, and 92% of
University C alumni responded that their expectations were met. This is a good result. This also means that these alumni trust the universities they graduated from.
015%
020%
030%
020%
015%
037%
053%
007%
003%
000%
046%
031%
020%
003%
000%
E X C E L L E N T G O O D A V E R A G E P O O R V E R Y P O O R
A B C
000% 020% 040% 060% 080% 100%
A B C
65 | P a g e
Figure 20. University Prepared Me Sufficiently for My Career or Further Studies
Figure 20 shows whether education in these three private universities prepared the alumni sufficiently for their career or further
studies. The answers also indicate that their level of satisfaction is high and accordingly they are loyal, they trust these universities and have the high level of commitment. 90 % of University A alumni, 87% of University B alumni and 100% of University C alumni responded that these private universities prepared them sufficiently for their career or further studies. Therefore, they are satisfied with the quality of knowledge gained at these universities.
Figure 21. Would you Encourage Relatives and Friends to Enroll to these Universities?
Figure 21 shows that the majority of the respondents would encourage their friends and relatives to attend these universities.
90% of the University A alumni, 88% of University B alumni and 100% of University C alumni responded that they would encourage their relatives and friends to attend these universities. This means that they are satisfied with the service quality, they trust these universities and are loyal. Only in the case of having high sense of satisfaction, loyalty level, trust and commitment, would alumni encourage their relatives and friends to attend the same universities they have graduated from.
000% 020% 040% 060% 080% 100% 120%
A B C
Yes No
000% 020% 040% 060% 080% 100% 120%
A B C
66 | P a g e
Figure 22. If you had enough money, would you like to support your university financially?
Figure 22 shows that the majority of the respondents would support these universities financially. 92.5% of the University A alumni,
87.5% of University B alumni and 100% of University C alumni responded that they would support their universities financially. This means that the degree of loyalty of alumni to is quite high.
Figure 23. Are your ready to cooperate with the university you graduated from (work there, be invited to events, employ its
graduates, etc.)?
Figure 23 shows alumni the readiness for cooperation with the university. 97.5% of the University A alumni, 90% of University B
alumni and 100% of University C alumni responded that they would cooperate with their universities. This also shows that all three university alumni trust their universities as they have already experienced the quality of education, while being students.
Findings and discussion
While figures 1-20 deal with student satisfaction (and only indirectly with alumni loyalty), figures 21-23 directly deal with alumni loyalty. The three items dealing with loyalty gave mean results of 92.67, 93.33 and 95.83% consecutively (total mean 93.94), which is very high. This means that alumni loyalty in all three universities is high. As for other items, their mean results were:
000% 020% 040% 060% 080% 100% 120%
A B C
Yes No
000% 020% 040% 060% 080% 100% 120%
A B C
67 | P a g e
Table 1. Mean results of items 1-20 (out of 5 points)
item mean item mean
U-A U-B U-C U-A U-B U-C
1 2.8 3.6 3.5 11 3.4 3.9 4.1
2 3.7 4.0 3.7 12 3.5 3.9 4.1
3 1.9 2.4 2.4 13 3.1 3.0 3.1
4 2.7 3.8 4.1 14 3.6 3.8 4.3
5 4,0 4.1 4.1 15 3.2 3.6 4.3
6 2.3 3.3 4,1 16 3.5 4.2 3.7
7 3.0 3.9 3.9 17 3.5 4.2 3.6
8 3.5 3.8 3.8 18 3.0 4.2 3.7
9 2.8 4.4 4.4 19 3.6 3.6 3.7
10 3.0 3.9 4.1 20 3.6 3.5 4.0
Items to which alumni from all three universities gave a high rating (3.0 or more): 2) tuition fees, 5) learning facilities, 7) socio-cultural activities, 8) university web-page, 10) connections with industry and the field, 11) student exchange programs, 12) quality of teaching, 13) availability of international professors, 14) reputation of academic staff, 15) alumni office work, 16) helpfulness of administrative staff, 17) helpfulness of academic staff, 18) students’ affairs office work. Items 19 and 20 are sort of summarizing the alumni satisfaction, and they show that it is high enough. It means that all these factors have a strong enough impact on alumni loyalty.
68 | P a g e As for those factors which were assessed low by the alumni of all three universities, there is only one: 3) scholarship (probably, because scholarships given to students by universities in Georgia anyway are low). Thus, we can say that scholarship has no impact on student loyalty in Georgia.
Malik, Danish and Usman (2010) expressed a view that “the students will be more satisfied and motivated for completing their studies if the institution provides an environment which facilitates learning, i.e. the institution contains proper infrastructure for educational utility accumulated with essential parameters of professional and academic development’’ (p.2). Answers to items 5, 7, 15, and 18 coincide with this finding. This is reasonable because facilities have not only a visual affect, but they also help universities to improve teaching and learning processes. It is obvious that the environment helps students in development.
Risch and Kleine’s (2000) point of view supports Malik et al.’s (2010) idea that consciously or unconsciously, students pay a great attention to institutional and educational facilities, as well to a qualified and professional staff. So, items 13, 14, 16 and 17 add up to those findings.
Malik et al. (2010) and Arambewela & Hall (2013) also claim that qualified teachers and their performance and approaches play a vital role in raising or reducing students’ satisfaction level. This coincides with the positive findings in assessment of items 12, 13, 14, and 17.
Graduate employability is an essential factor of alumni satisfaction. It greatly depends on the links between the university and the industry / fields of majors. Conclusion based on item 10 coincides with Tran (2016) research on the role of university links with industry.
To sum up, the findings of the research were similar to the views expressed in the literature review. The research findings show that the level of satisfaction and loyalty is high among the alumni who took part in the survey. And this high level of satisfaction and loyalty is linked to the learning facilities, the social and cultural activities, the reputation of the academic staff, the quality of teaching, the links with industry and sphere, the helpfulness of the administrative and academic staff. The research findings showed that the respondents were satisfied with all these factors and their level of satisfaction and loyalty was high. Only satisfied and loyal customers say that their expectations were met, and only satisfied and loyal customers would encourage their relatives and friends to attend the same university they have graduated from.
Conclusion and recommendations
As research findings showed, there are numerous factors affecting alumni loyalty level. These factors include satisfaction, service quality and commitment. The literature review and research findings indicated that there is a close link between these factors and they continuously affect each other. It was indicated that a high level of satisfaction is affected by the service quality such as the facilities, the helpfulness of the administrative and academic staff, the quality of teaching, the reputation of academic staff, the alumni office work, the activities of students’self-governance, the social and cultural activities, and career planning office work; all these factors are connected to the service quality. If alumni are satisfied with these factors these, it means that their level of satisfaction is high and, in turn, they show a high level of commitment. As it was mentioned above, this is an ongoing process; satisfaction, commitment and loyalty are tightly linked to each other.
69 | P a g e implement new methods and strategies for improving the level of loyalty. In return, these universities will benefit in a lot of ways. Number one priority both for business organizations and educational institutions must be the loyal customer.
Loyal alumni can also aid universities financially, promote universities through the word of mouth communication, participate in activities offered by universities and even help universities in doing research. Accordingly, it is reasonable that all educational institutions are following their steps for increasing alumni loyalty. In today’s competitive world where rapid globalization changes are taking place, where there is a considerable shift towards education and more and more people are trying to be educated, universities must be careful and make alumni loyalty number one priority for them. Alumni loyalty can be a determinant of success or failure of a university.
The benefits of having highly loyal students are numerous. This is a far going process; it starts at university, continues after graduation, until retirement and even beyond. If universities want to become more successful and powerful, they must deeply understand the term ‘loyalty’ and do everything to improve their alumni loyalty level. Despite the fact that alumni loyalty is comparatively new for educational institutions, they must timely realize the importance and benefits of loyalty as a whole. As the research findings showed, the universities participating in the research are on the right way, but this s an ongoing process; the development should continue in the same direction, otherwise their success and fame will be under a threat and finally this may lead to a negative end. The awareness of the importance of alumni loyalty is a key factor of the success of these three private universities.
References
Arambewela, R. & Hall, J. (2013). An empirical model of international student satisfaction. Asia Pacific Journal of Marketing and
Logistics, 21(4):555-569.
Farahmandian, S., Minavand, H., & Afshardost, M. (2013). Perceived service quality and student satisfaction in higher education.
IOSR Journal of Business and Management, 12 (4), 65-74.
Gardner, J. (2000). College Is Only the Beginning. Bolton, MA: Wadsworth Publishing Company.
Gremler, D.D. & Brown, S.W. (1996). Service loyalty: Its nature, importance, and implications. In B. Edvardsson, S.W. Brown, R. Johnston, & E.E. Scheuing (Eds.). Proceedings of American Marketing Association, 170-182. New York: International Service Quality Association.
Helgesen, Ø.Y., & Nesset, E. (2007). Images, Satisfaction and antecedents: Drivers of student loyalty? A case study of a Norwegian University College. Corporate Reputation Review, 10 (1), 38-59.
Henning-Thurau, T., Langer, M.F., & Hansen, A. (2001). Modeling and managing student loyalty - an approach based on the concept of relationship quality. Journal of Service Research, 3 (4), 331–344.
Ishakova, L., Hoffmann, S. & Hilbert, A. (2015). An integrative model of alumni loyalty – an empirical validation among graduates from German and Russian universities. Journal of Non-Profit and Public Sector Marketing, 28, 2, 129-163.
70 | P a g e McCloy, U. & Liu, S. (2010). What are the Influencers of Graduate Satisfaction and Labour Market Outcomes of Ontario College
Graduates? Toronto: The Higher Education Quality Council of Ontario.
Oldfield, B. M., & Baron, S. (2000). Student perceptions of service quality in a UK university business and management faculty.
Quality Assurance in education, 8 (2), 85-95.
Risch, R. A. & Kleine, S. (2000). Customer participation in service production and delivery. In T.A. Swartz & D. Iacobucci (Eds.)
Handbook of Services Marketing and Management, p. 111-125. Thousand Oaks: Sage.
Rojas-Mendez, J.I., Vasquez-Parraga, A.Z., Kara, A., & Cerda-Urrutia, A. (2009). Determinants of student loyalty in higher education: A tested relationship approach in Latin America. Latin American Business Review, 10, 1, 21-39.
Russell, M. (2005). Marketing education: a review of service quality perceptions among international students. International Journal
of Contemporary Hospitality Management, 17 (1), 65-77.
Shekarchizadeh, A., Rasli, A., & Hon-Tat, H. (2011). SERVQUAL in Malaysian universities: perspectives of international students.
Business Process Management Journal, 17 (1), 67-81.
Tran, T.T. (2016). Enhancing graduate employability and the need for university-enterprise collaboration. Journal of Teaching and