INTRODUCTION
Composites are a category of engineering plastics characterized by a number of peculiar conditions related to the design process, manu-facturing and verification tests. Wide possibili -ties of shaping the structure, as well as the pos-sibilities of directing and differentiating the me -chanical properties of the designed system are important attributes associated with composite structures [12].
These features promote the expansion of the applications spectrum of composite construc-tions. In particular, this applies to the thin-walled structures, increasingly often used as heavily loaded supporting structures. An example of this type of application are the elements of the aircraft airframe [15, 16, 20].
Nowadays, determining the stress fields of the mentioned systems in the states of critical deformation on the basis of non-linear theories are becoming available [2, 8, 14]. Despite this,
obligatory experimental studies during which it is expected to confirm compliance in the behavior of the real system with the constructor’s assump-tions, show the necessity of continuous improve-ment [3, 13, 18, 22, 25, 27].
Verification testing of the thin-walled structures is not easy to perform. They involve high-complexity equipment, require qualified service, and finally, the results obtained are highly dependent on the quality of the mea-suring devices. Therefore, the search for im -proved methods of research, in particular the studies of composite systems, is becoming a highly topical issue.
The local loads that occur during operation, causing hardly noticeable damage caused by ac-cidental impact or collision of the structure with an obstacle (e.g. collision with a bird of the air -frame structure during a flight, as well as improp -er maintenance) are dang-erous to the thin-walled composite constructions. Thus, fast and effective repair becomes a necessity [19].
On the Identification of Local Structural Defects
in Composite Thin-Walled Structures
Henryk Kopecki
1*, Łukasz Święch
1, Radosław Kołodziejczyk
11 Department of Aircraft and Aircraft Engines, Rzeszow University of Technology, al. Powstańców Warszawy 12, 35-959 Rzeszów,
* Corresponding author’s e-mail: [email protected]
ABSTRACT
The presented work considers the issue of the usefulness of alternative methods aimed at quickly and effectively identifying the local damage to the thin-walled composite load-bearing structures. Two ways of identifying de -struction were considered, based on the assumption that the damage that occurs during operation causes local
changes in the system rigidity. The first method is based on strain gauges. It consists of embedding strain gauges in the structure at the stage of composite production and monitoring of deformation during its life cycle. The second of the concepts under consideration is based on modal analysis, carried out using a modal hammer. On the example of the plate band, experimental studies supported by numerical analysis were carried out. The obtained research
results and numerical analyses allowed for the formulation of a number of conclusions, mainly in terms of
focus-ing on further research.
Keywords: thin-walled structures, composite structures, embedded strain gauge, modal analysis
Volume 14, Issue 1, March 2020, pages 154–166
https://doi.org/10.12913/22998624/115812
Research Journal
Accepted: 2020.02.05In this work, the usefulness of alternative methods for quickly identifying the damage to a thin-walled composite structure was analyzed. The considerations were limited to the analy-sis of two methods, i.e. the widely used method based on strain gauges and the method based on a modal analysis. It is assumed that any damage will change the stiffness of the body, which can be identifiable by experimental testing, relating them to the state of the reference [6, 21, 24, 26].
The strain gauge method widely used for monitoring strength parameters in damaged load-bearing structures is possible to use if load cells are built into the structure at the manufacturing stage. The task of the measuring system is to pro -vide the right amount of information that is the basis for quick repairs. A similar task must be fulfilled by a concept based on a modal analysis implemented with an impact hammer [4, 17, 23]. The research was supported by a comparative nu-merical analysis.
The whole problem was considered on the examples of the plate band. The obtained results allowed formulating a number of conclusions, mainly in terms of directing further research with the perspective of wider applications.
SCOPE AND SUBJECT OF THE RESEARCH
In order to identify the local damage to the thin-walled composite structures, two meth-ods were analyzed to determine the presence of damage.
The first method is based on the concept of embedding strain gauges between compos-ite layers, located in various zones of the load-bearing structure. The changes in the stiffness of the system prove the existence of damage in the studied area.
The second method is based on perform-ing a modal analysis in the studied zones of the structure. It involves the excitation of the struc -ture with a modal hammer and measurement of the system response with an acceleration sensor. The local changes occurring as a result of dam-age representative of the change in the rigidity of the system, are observed. They form the basis for identifying the presence of damage.
While the first method requires prior prepara -tion of the zones subjected to potential tests at the stage of structure manufacture, the second method does not have such limitations. However, it re -quires creating a reference model by measuring the undamaged structure. Considering the issues related to the first method, attention was paid to its advantages, as well as to the disadvantages and limitations of the method. Both methods were sup -ported by appropriate numerical analyses conduct-ed in terms of the Finite Element Method (FEM).
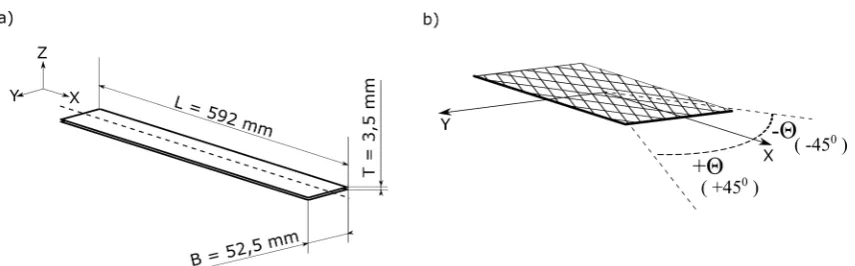
The issues determining the usefulness of the considered concept are discussed on the example of the analysis of composite plate band made of 18 layers of bidirectional carbon fiber reinforced polymer (CFRP) with an area massof 98 g/m2 and
fiber orientation ±450. The “vacuum bag” technol
-ogy was used to produce the tested specimen. As a result, a structure with a length of L = 592 mm, a width of B = 52.5 mm and a thickness of T = 3.5 mm was obtained. The beam mass was 162 g. The basic mechanical properties of the resulting composite are shown in Table 1.
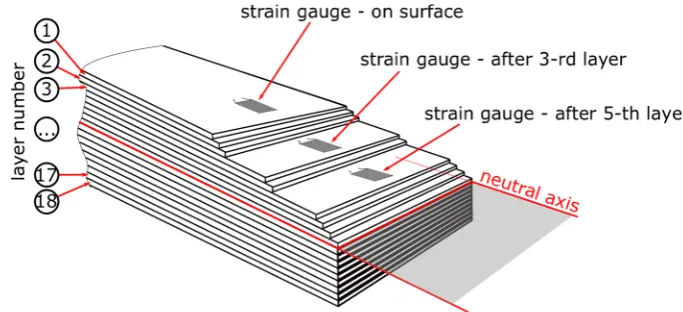
For the needs of research, special HBM LI 66 strain gauges (10mm base, 350 Ω resistance) were integrated into the structure at the manufacturing stage. These strain gauges were placed between successive layers of the fabric forming the com-posite (Fig. 2), symmetrically in relation to the neutral axis of the band. They formed half-bridge systems, connecting the 3rd and 15th layer strain
gauges and the 5th and 13th layer strain gauges, respectively [11]. In addition, the general purpose strain gauges with a base of 6 mm and 120 Ω resistances manufactured by Vishay were placed on the outside layer of the CFRP. In a plan view, the strain gauges were in the symmetry axis of the band around half of its length but were arranged so as not to overlap in order to avoid the local growth of thickness of the tested band.
The research object was created in the work-shop of the Department of Aircraft and Aircraft Engines of Rzeszow University of Technology.
EXPERIMENTAL RESEARCH
Static test with strain gauges
During the experimental tests, the beam was subjected to four-point bending using a specially prepared test setup, which was mounted in the measuring space of the ZWICK Z050 testing machine (Fig. 3). The indications of strain gauges
were recorded using an eight-channel QuantumX MX840B measuring amplifier controlled by CATMAN software (CATMAN EASY AP 3.5) from HBM GmbH.
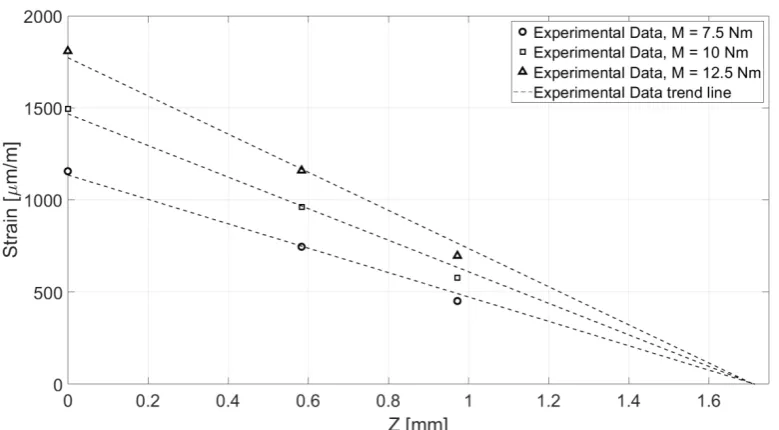
The tests were carried out for three load levels of 7.5 Nm, 10 Nm, and 12.5 Nm. As a result of the applied support system, a clean bending zone was created between the internal supports. Thus, it was possible to measure the deformation along the thickness, despite the fact that the position of the strain gauges was different along the length of the band. The distribution of this deformation is shown in Figure 4. The linear nature of the mea -sured strains was preserved even after large de-formation [1, 5]. During the tests, the beam was not damaged.
Table 1. Mechanical properties of the composite
E11 E22 ν12 G12
GPa GPa - GPa
47,9 47,9 0,295 4,5
Fig. 3. Schematic of the loading system (a) and technical realization of a test stand (b)
Research based on modal analysis
The modal analysis is an integral part of the development and research of a wide range of sup-port structures. It is a significant tool for defining and solving a number of structural dynamics prob-lems, such as fatigue, vibration and noise [9, 17].
The conditions determining the possibilities of extending the scope of applications of the said method to identify local damage to thin-walled composite structures were considered. The ana -lyzed concept is an attempt to broaden one of the most useful techniques for studying the frequency response of a structure based on the excitation of a structure using a modal hammer. In many situa -tions, this is the simplest and fastest of the various techniques currently used.
Modal hammers are precision measuring tools. They come in many variants, differing in parameters such as mass, sensitivity, amplitude and frequency ranges, as well as size and shape. Owing to this diversity, it is possible to study a variety of objects, which translates into a signifi -cant number of specific applications.
The use of the method to identify the damage in the thin-walled composite systems boils down to a rational interpretation of the perceived quan-titative and qualitative changes in the frequency response of the examined structure. This change is the effect of changing the rigidity of the dam -aged system. In the work, the damage identifica -tion was made by a quantitative comparison of natural frequencies and a qualitative comparison
of mode shapes of the plate band with and with-out damage.
Description of the method
The method used in the research involves the excitation of the structure at defined points using a hammer with a built-in force sensor. The system response is recorded using an IEPE (Integrated Electronics Piezo-Electric) accelerometer. The re -lation between the excitation introduced into the system and its response is described by the fre-quency response function (FRF). It is determined by fast Fourier transform (FFT) of the registered input and output signals. The FRF function is de -scribed by the equation [9,10]:
!
𝑋𝑋
#𝑋𝑋
$⋮
𝑋𝑋
&' =
⎣
⎢
⎢
⎡
𝐻𝐻
##… 𝐻𝐻
#.𝐻𝐻
$#⋮
⋮
𝐻𝐻
&#…
⋮
𝐻𝐻
&.⎦
⎥
⎥
⎤
!
𝐹𝐹
#𝐹𝐹
$⋮
𝐹𝐹
.'
Or in short form:
{𝑋𝑋} = [𝐻𝐻]{𝐹𝐹}
Where: X – system response,
H – matrix of frequency response, fre-quency response function,
F – excitation introduced to a system. The natural frequencies are identified as peaks in the Frequency Response Function (FRF). A useful tool for determining them is MIF (Mode Indicator Function), calculated using dependencies [9]:
𝑀𝑀𝑀𝑀𝑀𝑀 = 1 − '∑ 𝑅𝑅𝑅𝑅 +𝑇𝑇𝑀𝑀-.(𝜔𝜔)2 ∙ 4𝑇𝑇𝑀𝑀-.(𝜔𝜔)4
5 -,.78
∑5-,.7894𝑇𝑇𝑀𝑀-.(𝜔𝜔)4:;
<
Where:
𝑇𝑇𝑇𝑇
#$(𝜔𝜔)
– transfer function in response point j due to excitation in i point,MIF takes the values in the range <0: 1>, where the values close to 1 indicate the occur-rence of the natural frequency.
One of the easiest ways to determine the mode shapes of the structure is to use a method called Quadrature Picking. Its basis is the as -sumption that the coupling between individual normal modes of vibration is light. Usually, this is associated with low damping of the structure. It gives the possibility to analyze individual mode shapes independently because they have no mu-tual influence or this influence is small. For the structures with low coupling of mode shapes, the value of the imaginary part of the FRF function corresponds to the modal displacement. By de -termining this modal displacement for each point where the structure was excited, the shape of the vibrations can be determined. This method of identifying normal mode shapes is schematically shown in Fig. 5.
Description of the tests
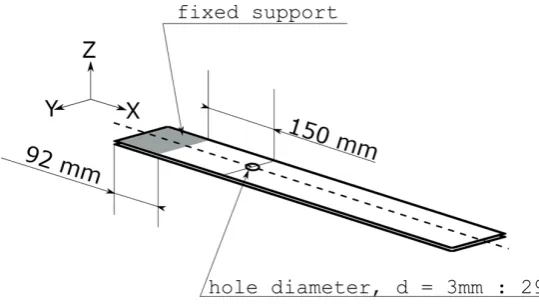
The issue is illustrated by the example of a plate band with identical material and geometri-cal properties that were used in the case of a static test. The band was fixed on one side in such a way that the free part was 500 mm long. Twelve points were marked on the band where the structure was excited with a modal hammer. The points were located at the edges of the band at 100 mm inter-vals, measured along the span. At a distance of
50 mm from the free end of the band, in the axis of symmetry, an accelerometer measuring the structure response to the applied excitation has been placed. First, the band was examined with -out damage, then the damage was simulated by making a hole. The hole was located in the beam axis of symmetry at a distance of 150 mm from the fixed support. In subsequent tests, the hole was enlarged and the measurements repeated. Five measurements of the damaged beam were carried out for the holes with diameters of 3 mm, 8 mm, 13 mm, 21 mm and 29 mm.
A PCB Piezotronics hammer was used to excite the structure. The hammer has a built-in force sensor with a sensitivity of 2.25 mV/N and a range of ± 2224 N. The acceleration measure -ment was made using an IEPE accelerometer from the PCB with a sensitivity of 10.65 mV/g. The measurement results were recorded using a DEWESoft Sirius signal analyzer. The range of tested frequencies was set at 2500 Hz with the possibility of measuring 8192 levels, which re-sulted in a resolution of 0.305 Hz. The diagram and technical implementation of the test stand is shown in Fig. 6. The location of the hole in the band is shown in Figure 7.
The Frequency Response Function was deter-mined in the dedicated DEWESoftX3 software. The obtained results were then analyzed in the MatLab software. The location of the nodal lines was determined by surface interpolation of the obtained modal displacements.
NUMERICAL ANALYSIS
The FEM analysis was performed using ANSYS (R18) software both for static test and modal analysis. Beam was modeled as a shell structure with 1297 elements and 1425 nodes. All elements are SHELL181 type, suitable to analyz -ing the thin shell structures. The elements have 4 nodes and 6 degrees of freedom at each node [28]. The characteristic element size was 5 mm. The finite element grid and boundary conditions are shown in Fig. 8. for the static test and in Fig. 9. for the modal analysis.
Finite element method analysis conducted us-ing ANSYS Composite Prep/Post (ACP) gives the information about each layer strain. This data was used for comparison of strain measure-ments in a composite band between the experi-ment and computer simulation. Additionally, total
Fig. 9. Finite element grid and boundary conditions for the modal analysis
Fig. 8. Finite element grid and boundary conditions for the static test
Fig. 7. Schematic of hole location in the band
deformation of the beam was compared to the de-formation measurements during the experimental investigation. The example results are shown in Figure 10.
TEST RESULTS
Results of test with strain gauges
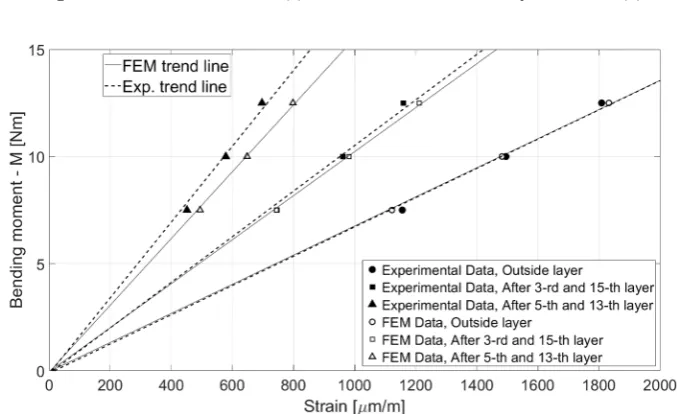
They form the basis for assessing the correct-ness of preparing the system for testing by com-paring the degree of compliance with the results of numerical calculations. The possible occur -rence of quantitative changes in the measured de-formations will prove a change in the local rigid-ity of the system caused by the structural damage. Figure 11, presents the dependence of defor-mation in relation to the applied bending moment for individual layers in which strain gauges are built-in. This graph contains both the results ob -tained through the experiment and those ob-tained as a result of numerical analysis. On its basis, it can be concluded that there is a qualitative
agreement between the experimental and numeri-cal results. The graph also shows the trend lines illustrating a linear change in strain as a func-tion of the applied load. The dashed line refers to the results of the experiment, whereas the solid line shows the trend for the results of numerical analysis. In Table 2, the quantitative comparison of the obtained results is presented. A noticeable shift in the deformation values measured in the experiment compared to the FEM analysis in the 5th and 13th layers probably results from the fact that the thickness of the obtained composite lay-ers varies, which the FEM model did not take into account.
The difference between the results obtained through the experiment and numerical analyses is expressed by the formula:
∆
"###= 𝜀𝜀
'()− 𝜀𝜀
+',𝜀𝜀
'()∙ 100%
From the results presented in Fig. 11. it fol -lows that any change in stiffness in the examined area due to damage will be noticeable in the shape of the appropriate characteristics, indicating the location of the damage zone.
Fig. 10. Deformation of beam (a) and strain in the outside layer of beam (b)
The presented analysis is limited to indicat-ing the possibilities of the methodology, without raising a number of significant problems that may constitute significant restrictions in the applica -tion, such as the technological issues related to the preparation of the system for research. The application possibilities of the methodology seem to be conditioned to a significant extent by the ex -perimenter’s experience.
Modal analysis results
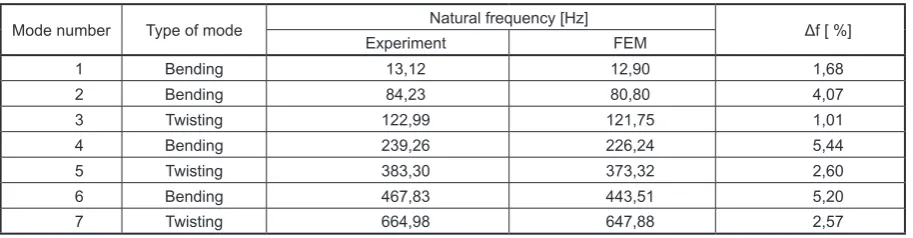
The analysis of the results obtained from the modal studies was carried out in two stages. First, the correctness of the FEM model was verified with experimental data for an undamaged band. A quantitative comparison of the natural frequen -cies obtained by means of an experiment and nu-merical analyses is illustrated in Tab. 3. This table also shows the relative difference between these frequencies. The differences were determined from the relationship:
∆"=
𝑓𝑓
&'(𝑓𝑓
− 𝑓𝑓
*&+&'(
∙ 100%
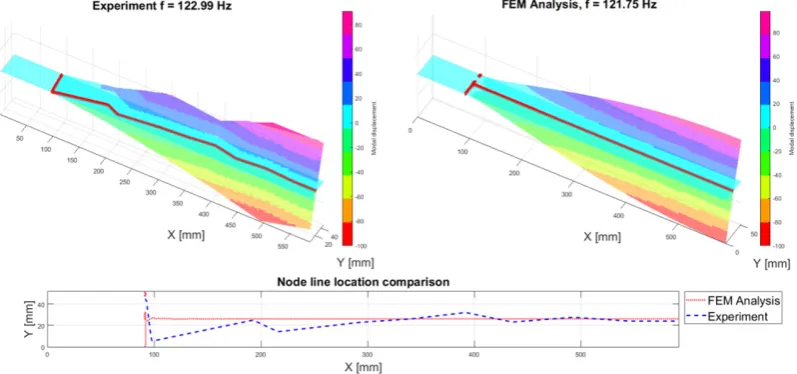
The largest error was recorded for the third bending mode and it amounted to 5.44%. This indicates that the stiffness of the tested band was greater than assumed in the numerical model. The qualitative assessment was made by com-paring the mode shapes obtained in the experi-ment and numerical analysis. The comparison is presented for the selected natural frequencies in Figures 12 to 15.
On the left side of each figure there are the values of the relative modal displacement re-corded experimentally in relation to the non-vi-brating band. An analogous representation of the results obtained in the FEM analysis is shown on the right. These results were imported from the ANSYS and processed in the MatLab software for better comparison. The figures also show the location of the nodal lines of the individual modes (bottom of each figure). It can be stated that in terms of the qualitative comparison, the obtained results show compliance.
The second stage was the analysis of the im-pact of damage presence and magnitude of this damage on the measured parameters. At this stage, the compliance of numerical calculations with the experiment was verified as well.
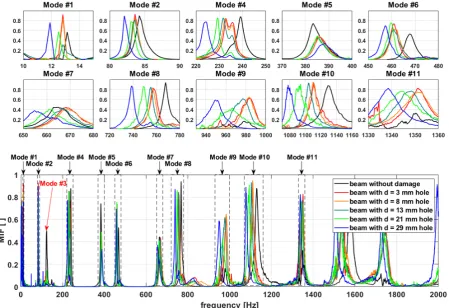
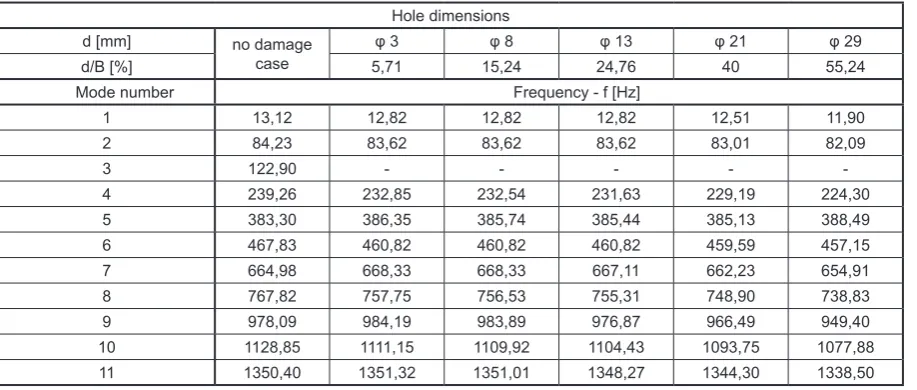
The obtained results of the analysis are shown in Fig. 16. The graph shows the MIF value rela -tive to the frequency for the undamaged band and the band with different hole sizes. Additionally, for better readability, selected frequencies are en-larged (upper part of Fig. 16). The presentation of modes with higher frequencies was deliber-ately abandoned, due to the fact that they pres-ent the same nature of changes as those already presented. The conducted experiment shows that the natural frequencies, as expected, change their value as a result of damage. In most cases, this
Table 3. Quantitative comparison of natural frequencies from experiment and FEM simulation
Mode number Type of mode Natural frequency [Hz] Δf [ %]
Experiment FEM
1 Bending 13,12 12,90 1,68
2 Bending 84,23 80,80 4,07
3 Twisting 122,99 121,75 1,01
4 Bending 239,26 226,24 5,44
5 Twisting 383,30 373,32 2,60
6 Bending 467,83 443,51 5,20
7 Twisting 664,98 647,88 2,57
Table 2. Comparison of longitudinal elastic strain measured during the experiment and calculated using FEM
Layers Longitudinal Elastic Strain [µm/m] Experiment FEM ∆"### [%] Bending moment 7,5 Nm
Outside 1155,84 1122,00 2,93
3-rd and 15-th 745,74 744,00 0,23
5-th and 13-th 451,26 494,00 -9,47
Bending moment 10 Nm
Outside 1495,04 1482,00 0,87
3-rd and 15-th 961,95 982,00 -2,08
5-th and 13-th 578,28 648,00 -12,06
Bending moment 12,5 Nm
Outside 1808,19 1832,00 -1,32
3-rd and 15-th 1159,53 1212,00 -4,53
Fig. 12. Comparison of mode shape for First Bending mode of CFRP beam. Experimental data (left), FEM Analysis (right), Nodal line location (bottom)
Fig. 13. Comparison of mode shape for Second Bending mode of CFRP beam. Experimental data (left), FEM Analysis (right), Nodal line location (bottom)
is a reduction in frequency with an increase in “damage”, for example this can be seen, in modes 2, 4, 8, 10. In the case of twisting modes, the fre -quency can be observed to remain at a compa-rable level or have a small increase in comparison to the undamaged band. It is also interesting that the first twisting mode (described in the chart as Mode # 3) obtained in both the experiment and
numerical analysis for an undamaged band, is not recorded experimentally after the damage occurs. The reason for this appears to be the location of the acceleration sensor during the experiment, as indicated by the low MIF value recorded for this frequency when the band was intact. The regis -tered natural frequency values for the undamaged and damaged band are summarized in Table 4.
Fig. 16. Comparison of frequencies change due to hole size
In order to better illustrate the change in indi -vidual frequencies as a result of “damage”, they are presented as relative values related to the fre-quency of the intact reference band. Similarly, the hole diameter d is presented as a relative value related to the plate band width B. A similar ap -proach was used for the numerical analysis taking into account damage. These results are compared in Fig. 17 for the selected modes from Mode # 1 to Mode # 9, excluding Mode # 3.
The obtained results show the qualitative agreement between the experiment and the nu-merical analysis (cf. modes 1, 4, 5, 6, 8). It can be seen that the frequency changes are non-linear, and they are more prominent the greater the dam-age (hole) is.
CONCLUSIONS
The paper examines the problems of choosing the research methodologies to determine the pres-ence of local damages that arise during the opera-tion of the composite thin-walled structures. The extent and geometry of the damage suggest using the methods that lead to determining the presence of damage as soon as possible. Out of the two methods analyzed, the modal method seems to be promising and worth recognizing more precisely. The exceptional simplicity in use, the speed of testing, and finally the possibility of testing the system under almost all conditions are clear argu-ments for continuing further research.
As part of the research, a number of results were obtained to identify the occurrence of dam-age in the analyzed composite band structure. At
the same time, they constituted the basis for the verification of the numerical model. It should be noted that the numerical analysis does not take into account certain factors that are inseparable from the experiment. The FEM analysis is a sim -plified tool because it is based on an idealized model of the real system. As an example, the infi -nite rigidity of the support method and manufac-turing imperfections can be mentioned.
While the conducted research indicates the possibility of identifying the occurrence of dam-age in the structure, it is necessary to critically approach such aspects as precise localization of this damage or its shape. The problem of identi -fying relatively small damages remains open and requires further research, which is suggested by the obtained results.
All considerations related to the methodology used to identify the damage in the thin-walled composite systems require further research.
REFERENCES
1. Aloisi, S., U. Galietti, and C. Pappalettere. Strain
measurement in composite materials using
embed-ded strain gauges. Key Engineering Materials, 1997: 251-260.
2. Arbocz, J. Post-buckling behavior of structures. Nu
-merical techniques for more complicated structures. In Lect. Notes Phys. 1985.
3. Bakunowicz, J., T. Kopecki, T. Lis, and P. Mazurek. Effect of stiffeners on nature of post-critical defor -mations of thin-walled composite aircraft structures:
A combined numerical-experimental study. 2016 7th International Conference on Mechanical and Aerospace Engineering (ICMAE), 2016.
Table 4. Change in natural frequencies due to hole dimensions. Experimental data Hole dimensions
d [mm] no damage
case
φ 3 φ 8 φ 13 φ 21 φ 29
d/B [%] 5,71 15,24 24,76 40 55,24
Mode number Frequency - f [Hz]
1 13,12 12,82 12,82 12,82 12,51 11,90
2 84,23 83,62 83,62 83,62 83,01 82,09
3 122,90 - - - -
-4 239,26 232,85 232,54 231,63 229,19 224,30
5 383,30 386,35 385,74 385,44 385,13 388,49
6 467,83 460,82 460,82 460,82 459,59 457,15
7 664,98 668,33 668,33 667,11 662,23 654,91
8 767,82 757,75 756,53 755,31 748,90 738,83
9 978,09 984,19 983,89 976,87 966,49 949,40
10 1128,85 1111,15 1109,92 1104,43 1093,75 1077,88
4. Belhouideg, S., and M. Lagache. Effect of embedded
strain gage on the mechanical behavior of composite
structures. Journal of Modern Materials, 2017. 5. Neha, C., Martinez-Sanchez, M., Soutis, C., and
Gresil, M. Early damage detection in composites by distributed strain and Acoustic Event Monitor
-ing. Procedia Engineering, 2017.
6. Diamanti, K., and C. Soutis. Structural health moni
-toring techniques for aircraft composite structures. Prog. Aero. Sci., 2010, 46(8) ed.
7. Døssing, Ole. Structural Testing. Part II: Modal Analysis and Simulation. Brüel&Kjær, 1988. 8. Doyle, J.F. Nonlinear Analysis of Thin-Walled
Structures. Luxembourg: Springer, 2001.
9. Ewins, D.J. Modal Testing: Theory, Practice and Application. Wiley, 2009.
10. Hatch, Michael R. Vibration Simulation Using MATLAB and ANSYS. Chapman and Hall, 2000. 11. Hoffmann, K. An Introduction to Stress Analysis us
-ing Strain Gauges. Hott-inger Baldwin Messtechnik GmbH, 1987.
12. Jones, R. Mechanics Of Composite Materials, 2nd ed. Philadelphia, PA, USA: Taylor & Francis, 1999. 13. Kopecki, T., J. Bakunowicz, and T. Lis. Post-critical
deformation states of composite thin-walled aircraft
load-bearing structures. Journal of Theoretical and Applied Mechanics, 2016, 54 (1) ed.: 195-204. 14. Kopecki, T., P. Mazurek, and T. Lis. Experimen
-tal and Numerical Analysis of a Composite Thin-Walled Cylindrical Structures with Different Vari
-ants of Stiffeners, Subjected to Torsion. Materials, 2019, 19 ed.
15. Kopecki, T., T. Lis, and P. Mazurek. Post-critical de -formation of thin-walled load-bearing aircraft struc-ture representing fragment of the one-way torsion
box. Advances in Science and Technology Research Journal, 2018, 3 ed.: 203-209.
16. Kopecki, T., T. Lis, P. Mazurek, and J. Bakunowicz. Buckling Deformation of Thin Layer Coverings of Small Curvatures Used in Aircraft Construction. Advances in Science and Technology Research Journal, 2018, 1 ed.: 293-302.
17. Kucharski, T. System pomiaru drgań mechanic
-znych. Warszawa: WNT, 2002.
18. Liang, K., Q. Sun, and Y. Zhang. Nonlinear buck
-ling analysis of variable stiffness composite plates based on the reduced order model. Compos. Struct., 2018, 206 ed.
19. Mamalis, A.G., D.E. Manolakos, G.A. Demosthen
-ous, and M.B. Ioannidis. Crashworthiness of Com
-posite Thin-Walled Structures. CRC Press, 2019. 20. Niu, M.C. Composite Airframe Structures, 3rd ed.
Hong Kong: Conmilit Press Ltd., 2010.
21. Orkisz, M., Ł. Święch, and J. Zacharzewski. Fa
-tigue tests of motor glider wing’s composite spar. Eksploatacja i Niezawodność – Maintenance and Reliability, 2012, 14 (3) ed.
22. Quinn, D., A. Murphy, W. McEwan, and F. Lemai
-tre. Stiffened panel stability behaviour and perfor
-mance gains with plate prismatic sub-stiffening. Thin Walled Struct., 2009, 47 ed.
23. Schaaf, K., B. Cook, F. Ghezzo, A. Starr, and S. Nemat-Nasser. Mechanical properties of compos -ite materials with integrated embedded sensor
net-works. Smart Structures and Materials, 2005. 24. Skopinski, T., W. Aiken, and W. Huston. Calibration
of strain-gauge installation in aircraft structures for
the measurements of flight loads. NASA Technical Report, 1953.
25. Święch, Ł. Experimental and Numerical Studies of Low-Profile, Triangular Grid-Stiffened Plates Sub -jected to Shear Load in the Post-Critical States of
Deformation. Materials, 2019, 12 ed.
26. Takeda, S., Y. Aoki, T. Ishikawa, N. Takeda, and H. Kikukawa. Structural health monitoring of com
-posite wing structure during durability test. Comp. Struct., 2007, 79(1) ed.
27. Wysmulski, P., H. Dębski, P. Różyło, and K. Falko
-wicz. A study of stability and post-critical behavior of thin-walled copmposite profiles under compres
-sion. Eksploatacja i Niezawodność - Maintenance and Reliability, 2016, 18 (4) ed.
![Fig. 5. Schematic of mode shape identification [7].](https://thumb-us.123doks.com/thumbv2/123dok_us/8804663.1773907/5.595.77.279.598.749/fig-schematic-of-mode-shape-identification.webp)