carcinogen-induced, and radiation-induced
mouse sarcoma
Chang-Lung Lee, … , Kouros Owzar, David G. Kirsch
JCI Insight.
2019;
4(13)
:e128698.
https://doi.org/10.1172/jci.insight.128698
.
Cancer development is influenced by hereditary mutations, somatic mutations due to
random errors in DNA replication, or external factors. It remains unclear how distinct
cell-intrinsic and -extrinsic factors affect oncogenesis within the same tissue type. We
investigated murine soft-tissue sarcomas generated by oncogenic alterations (Kras
G12Dactivation and p53 deletion), carcinogens (3-methylcholanthrene [MCA] or ionizing
radiation), and both factors in a potentially novel model (MCA plus p53 deletion).
Whole-exome sequencing demonstrated distinct mutational signatures in individual sarcoma
cohorts. MCA-induced sarcomas exhibited high mutational burden and predominantly
G-to-T transversions, while radiation-induced sarcomas exhibited low mutational burden and a
distinct genetic signature characterized by C-to-T transitions. The
insertion-deletion/substitution ratio and number of gene copy number variations were high for
radiation-induced sarcomas. MCA-induced tumors generated on a p53-deficient
background showed the highest genomic instability. MCA-induced sarcomas harbored
mutations in putative cancer driver genes that regulate MAPK signaling (
Kras
and
Nf1
) and
the Hippo pathway (
Fat1
and
Fat4
). In contrast, radiation-induced sarcomas and Kras
G12Dp53
–/–sarcomas did not harbor recurrent oncogenic mutations; rather, they exhibited
amplifications of specific oncogenes:
Kras
and
Myc
in Kras
G12Dp53
–/–sarcomas and
Met
and
Yap1
for radiation-induced sarcomas. These results reveal that different initiating
events drive oncogenesis through distinct mechanisms.
Research Article
Genetics
Oncology
Find the latest version:
R E S E A R C H A R T I C L E
Authorship note: CLL, YMM, and ARD contributed equally to this work.
Conflict of interest: The authors have declared that no conflict of interest exists.
Copyright: © 2019, American Society for Clinical Investigation.
Submitted: March 7, 2019
Accepted: May 16, 2019
Published: July 11, 2019.
Reference information:JCI Insight. 2019;4(13):e128698. https://doi. org/10.1172/jci.insight.128698.
Mutational landscape in genetically
engineered, carcinogen-induced, and
radiation-induced mouse sarcoma
Chang-Lung Lee,1,2,3 Yvonne M. Mowery,1,2 Andrea R. Daniel,1 Dadong Zhang,2 Alexander B. Sibley,2
Joe R. Delaney,4 Amy J. Wisdom,5 Xiaodi Qin,2 Xi Wang,2 Isibel Caraballo,1 Jeremy Gresham,2
Lixia Luo,1 David Van Mater,2,6 Kouros Owzar,2,7 and David G. Kirsch1,2,5
1Department of Radiation Oncology, 2Duke Cancer Institute, and 3Department of Pathology, Duke University Medical
Center, Durham, North Carolina, USA. 4Department of Biochemistry and Molecular Biology, Medical University of South
Carolina, Charleston, South Carolina, USA. 5Department of Pharmacology and Cancer Biology, 6Department of Pediatrics,
and 7Department of Biostatistics & Bioinformatics, Duke University Medical Center, Durham, North Carolina, USA.
Introduction
Approximately 50% of all cancer patients receive radiation therapy (1), which is a component of approx-imately 40% of all cancer cures (2). Although radiation is an effective cancer therapy, its use involves a small, but clinically significant, risk of developing a therapy-related malignancy (3). Radiation-associated cancers develop years later and are a particular concern for pediatric cancer patients because they may carry germline mutations in oncogenes or tumor suppressor genes and because they have many years to develop secondary cancers. Moreover, the estimated total lifetime risk of radiation-associated cancers may be higher in patients receiving modern radiation therapy techniques, such as intensity-modulated radiation therapy and image-guided radiation therapy (4, 5). When a second cancer develops after radiation expo-sure, it can be challenging to determine whether radiation caused the tumor.
Radiotherapy kills cells by generating unresolved double-stranded DNA breaks. For example, cells undergoing mitosis with unrepaired double-stranded DNA breaks after radiotherapy can die through mechanisms including mitotic catastrophe (6). Although radiation effectively kills proliferating cancer cells, it is a relatively weak carcinogen (3, 7). In contrast, the potent chemical carcinogen 3-methyl-cholanthrene (MCA) is nonlethal but acts as a mutagen to modify DNA sequences, primarily causing G-to-T transversions (8). Mutagenesis initiates a selection process that favors proliferative cells harboring activated oncogenes and inactivated tumor suppressor genes. However, mechanisms by which radia-tion-induced DNA damage and repair processes cause de novo cancer formation, as well as the specific types of DNA mutations and pathways modulated, remain poorly understood.
Cancer development is influenced by hereditary mutations, somatic mutations due to random errors in DNA replication, or external factors. It remains unclear how distinct cell-intrinsic and -extrinsic factors affect oncogenesis within the same tissue type. We investigated murine soft-tissue sarcomas generated by oncogenic alterations (KrasG12D activation and p53 deletion), carcinogens (3-methylcholanthrene [MCA] or ionizing radiation), and both factors in a potentially novel model (MCA plus p53 deletion). Whole-exome sequencing demonstrated distinct mutational signatures in individual sarcoma cohorts. MCA-induced sarcomas exhibited high mutational burden and predominantly G-to-T transversions, while radiation-induced sarcomas exhibited low mutational burden and a distinct genetic signature characterized by C-to-T transitions. The insertion-deletion/substitution ratio and number of gene copy number variations were high for radiation-induced sarcomas. MCA-induced tumors generated on a p53-deficient background showed the highest genomic instability. MCA-induced sarcomas harbored mutations in putative cancer driver genes that regulate MAPK signaling (Kras and Nf1) and the Hippo pathway (Fat1 and
To identify mutational signatures specific to radiation-induced tumors and to gain insight into how distinct cell-intrinsic and -extrinsic factors affect cancer development within the same tissue type, we per-formed genomic analysis across murine soft-tissue sarcomas induced by MCA, oncogenic mutations, or ionizing radiation. Radiation-induced sarcomas were generated by focally irradiating the mouse hind limb using a single dose of 30 or 40 Gy (9). For comparison to radiation-induced sarcomas, we used an estab-lished genetically engineered mouse model of soft-tissue sarcoma in which localized delivery of Cre recom-binase into the muscle of the hind limb activates oncogenic KrasG12D and deletes both alleles of p53 (10). In
addition, we generated MCA-induced sarcomas in the hind limb of either WT or p53fl/fl mice in which both
copies of p53 were deleted by Cre recombinase.
Using these mouse models of oncogene-driven, chemical carcinogen–induced, or radiation-induced soft-tissue sarcoma, we performed whole-exome sequencing (WES) on paired tumor and normal tissue from each mouse and observed distinct facultative molecular signatures that are specific to each carcino-genic driver. Remarkably, ionizing radiation produced tumors with relatively low levels of nonsynonymous mutations, but a high frequency of somatic copy number alterations, with a preponderance of deletions and a tendency toward C-to-T and G-to-A transitions.
Results
Generation of primary murine sarcomas by oncogenic alterations, chemical carcinogens, and ionizing radiation. To investi-gate how cell-intrinsic and -extrinsic factors affect cancer development within the same tissue type, we generated primary murine sarcomas by using defined genetic and external insults, including mutations of Kras and p53
(KrasG12D p53–/–) (10), chemical carcinogen MCA (MCA-induced p53 WT and MCA-induced p53–/–) (11), and
ionizing radiation (IR-induced) (ref. 9; Figure 1A and Supplemental Table 1; supplemental material available online with this article; https://doi.org/10.1172/jci.insight.128698DS1). KrasG12D p53–/– sarcomas were
gen-erated in LSL-KrasG12D p53fl/fl mice following intramuscular delivery of adenovirus expressing Cre recombinase (Ad-Cre) (10). The median of the observed event times for the 6 mice with KrasG12D p53–/– sarcomas for which
data were available was 77 days after Ad-Cre injection. The latency of KrasG12D p53–/– sarcomas was similar to
MCA-induced p53–/– sarcomas, which were generated via intramuscular injection of both Ad-Cre and MCA
into p53fl/fl mice (Supplemental Table 2). Compared with MCA-induced p53–/– and KrasG12D p53–/– sarcomas,
MCA-induced sarcomas generated in p53 WT mice had markedly longer latency (Supplemental Table 2). Nota-bly, IR-induced sarcomas, which developed in mice with or without temporary (10-day) p53 knockdown during a single dose of 30 or 40 Gy focal irradiation (12), had the longest observed latency. The median observed event time was 449 days after radiation exposure (Supplemental Table 2). Histology demonstrated that sarcomas generated by these approaches were intermediate- to high-grade soft-tissue sarcomas (Supplemental Figure 1). Collectively, these mouse models provide a unique resource to comprehensively understand the mutational land-scape across soft-tissue sarcomas generated through distinct oncogenic alterations and carcinogens.
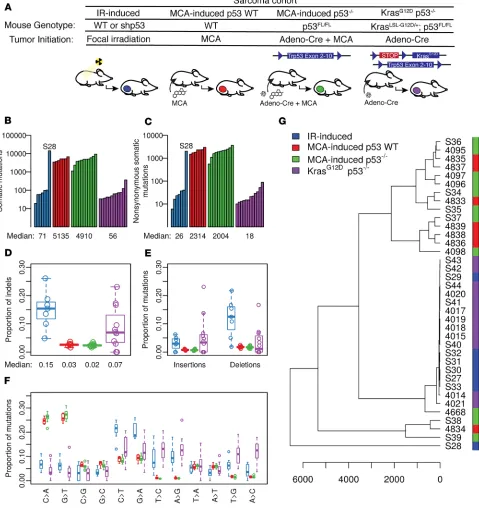
Tumor-initiating factors dictate mutational load and signatures. To determine the mutational landscape of soft-tissue sarcomas, we performed WES on paired tumor and normal liver to identify somatic mutations that are specific to each tumor model (Supplemental Figure 2). Comparing across different sarcoma cohorts, MCA-induced sarcomas harbored the highest mutational burden (Figure 1, B and C). Both MCA-induced
p53 WT and MCA-induced p53–/– sarcomas contain a median of more than 2000 nonsynonymous
muta-tions per tumor (Figure 1C). IR-induced sarcomas harbored a substantially lower mutational load, with a median of 26 nonsynonymous mutations per tumor. The mutational burden of IR-induced sarcomas was similar to KrasG12D p53–/– sarcomas (Figure 1, B and C). Notably, a single IR-induced sarcoma (S28)
exhib-ited a disproportionally high number of mutations, of which about 15% were localized on chromosome 2 (Supplemental Figure 3). Further examination of S28 revealed mutations in multiple genes that control the DNA damage response, including Brca1, Atrx, and Pole (Supplemental Table 3), suggesting that defects in DNA repair and cell cycle checkpoint controls led to an accumulation of mutations in this tumor (13). Together, these results indicate that although MCA generates sarcomas by causing gene mutations, IR does not typically induce sarcomas by increasing mutational burden.
In addition to assessing the number of mutations, we examined the impact of different genetic and external insults on the distribution of sequence variants, including single-nucleotide variants (SNVs) and insertions-deletions (indels) (Figure 1D and Supplemental Figure 4). Compared with
MCA-in-duced sarcomas and KrasG12D p53–/– sarcomas, IR-induced sarcomas showed a higher median proportion
R E S E A R C H A R T I C L E
that nonsynonymous indels in IR-induced sarcomas were predominately deletions (Figure 1E). More-over, examination of SNVs showed that although MCA-induced sarcomas harbored primarily C-to-A and G-to-T transversions, IR-induced sarcomas exhibited higher C-to-T (P = 0.0002) and G-to-A (P = 0.0006) transitions (Figure 1F). The distinction of single-nucleotide substitutions was also revealed by unsupervised hierarchical clustering showing segregation among the majority of MCA-induced
sarco-mas, KrasG12D p53–/– sarcomas, and IR-induced sarcomas (Figure 1G).
We further conducted signature analysis using nonnegative matrix factorization (NMF) (14), and compared our results to 30 published signatures identified in human cancers (https://cancer.sanger.ac.uk/ cosmic/signatures). Our results revealed that mutational signatures derived from each murine sarcoma cohort were highly correlated with distinct Catalogue Of Somatic Mutations in Cancer (COSMIC) human signatures (Supplemental Figure 5). COSMIC signature 4, which is associated with tobacco mutagens, was exclusively enriched in MCA-induced sarcomas (Supplemental Figure 5, A and B). COSMIC signature
5, which is present universally in all 30 types of human cancers (15), was enriched in a subset of KrasG12D
p53–/– sarcomas and IR-induced sarcomas. Although COSMIC signatures 9 and 17 were specifically found
in certain KrasG12D p53–/– sarcomas, IR-induced sarcomas exhibited a signature that correlated with
COS-MIC signature 6, which may indicate microsatellite instability (Supplemental Figure 5, C and D). In sum, as shown in the mutational analysis, our results reveal unique mutational processes underlying the develop-ment of sarcomas induced by Kras and p53 mutations, MCA carcinogen, and IR.
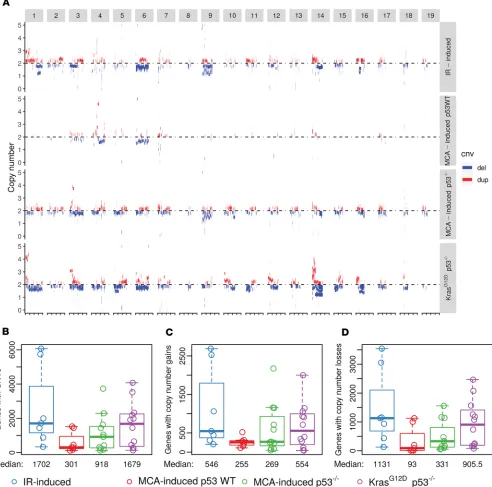
IR and p53 status contribute to increased copy number variations. In addition to examining mutations, we evaluated somatic copy number variations (CNVs) using CODEX2 (ref. 16; Figure 2A and Supplemental Figures 2 and 6). Among sarcomas initiated in p53 WT mice, IR-induced sarcomas exhibited a markedly higher median number of genes affected by CNVs compared with MCA-induced p53 WT sarcomas (P = 0.0262; Figure 2B). This trend was consistent for both copy number gains and losses (P = 0.0262 and 0.0297; Figure 2, C and D, respectively). Moreover, MCA-induced sarcomas in p53 WT mice showed a lower median number of genes affected by CNVs compared with sarcomas initiated by MCA and p53 loss, suggesting that the p53 status of tumor cells either at the time of MCA exposure or during subsequent
tumor development had a marked impact on chromosomal instability (Figure 2, B–D). KrasG12D p53–/–
sar-comas, which did not develop after an external genotoxic exposure, showed a similar median number of genes with CNVs as IR-induced sarcomas (Figure 2, B–D). Together, these findings suggest that both IR and p53 loss contribute to increasing the number of CNVs during sarcomagenesis.
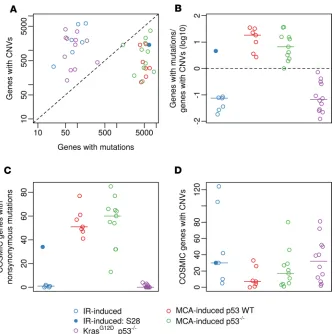
Different sarcoma cohorts show enrichment in genes affected by mutations versus CNVs. To elucidate genet-ic alterations that contribute to sarcoma development, we compared the number of genes affected by mutations versus the number affected by CNVs in each sarcoma sample. Both IR-induced sarcomas and
KrasG12D p53–/– sarcomas were defined by a markedly higher number of genes affected by CNVs than
muta-tions (Figure 3, A and B). In contrast, the majority of MCA-induced tumors exhibited relatively few genes affected by CNVs compared with mutations (Figure 3, A and B). Of note, about 50% of MCA-induced
p53–/– sarcomas were clustered at the top right of the graph as a result of harboring both nonsynonymous
SNVs and CNVs in a high number of genes (Figure 3A).
To examine genetic alterations that potentially contribute to oncogenesis, we used the COSMIC database to evaluate specific oncogenic genes that were affected by mutations and CNVs. Although the number of nonsynonymous mutations in COSMIC genes was extremely low in radiation-induced and
KrasG12D p53–/– sarcomas, frequent mutations were observed in COSMIC genes in the MCA-induced
tumors (Figure 3C). In contrast, the median number of COSMIC genes affected by CNVs was higher
in IR-induced sarcomas, KrasG12D p53–/– sarcomas, and MCA-induced p53–/– sarcomas compared with
MCA-induced p53 WT sarcomas (Figure 3D).
Mutations in putative driver genes of sarcomas. To evaluate putative driver genes, we analyzed recurring
nonsynonymous mutations and CNVs of COSMIC genes in different sarcoma cohorts. KrasG12D p53–/–
R E S E A R C H A R T I C L E
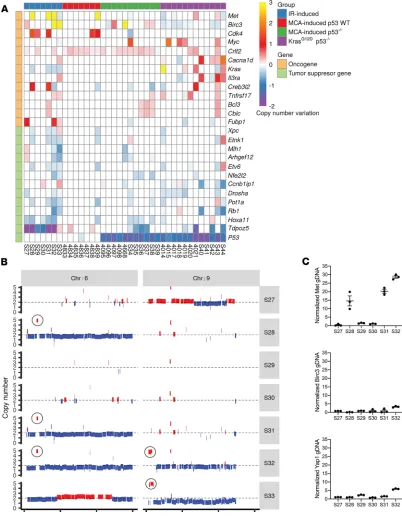
Examination of genes affected by CNVs revealed amplification of a distinct spectrum of COSMIC
oncogenes in KrasG12D p53–/– sarcomas versus IR-induced sarcomas (Figure 5A and Supplemental Tables
4–7). Although a subset of KrasG12D p53–/– sarcomas had amplifications of oncogenes Kras and Myc, several
IR-induced sarcomas exhibited prominent amplifications of Met and Birc3 (Figure 5A). An increase in CNVs of Met and Birc3 resulted from partial amplifications of chromosomes 6 and 9, respectively (Figure 5B). The fragment that was amplified on chromosome 9 contains multiple putative driver genes, including
Yap1 (Supplemental Table 4). To validate the results from the WES data, we performed quantitative reverse transcription PCR (qRT-PCR) to examine CNVs of Met, Birc3, and Yap1 (Figure 5C). Our results from qRT-PCR were consistent with the findings from WES, showing amplification of Met in IR-induced sarco-mas S28, S31, and S32, as well as amplifications of Birc3 and Yap1 in IR-induced sarcosarco-mas S32 and S33.
Discussion
Radiation-associated sarcomas are a rare but substantial potential late side effect of radiation therapy (17). However, methods are currently lacking to discern whether a second malignancy is caused by radiation expo-sure. To date, a robust mutational signature for distinguishing IR-initiated cancers from tumors driven by other pathogenetic events has not been defined. Because the genetic drivers of radiation-related cancers may differ from spontaneous cancers, identifying specific genetic features in tumors that contribute to an IR sig-nature has the potential to not only affect diagnosis but also affect therapy. Searching for a genetic sigsig-nature of radiation-associated cancer in human samples is complicated by variations in radiation dose and fraction-ation, anatomic locfraction-ation, tumor type, and uncertainty regarding whether radiation initiated the tumor. In contrast, our primary murine sarcoma models provide a well-controlled system to search for a genetic signa-ture of radiation-driven tumorigenesis. We used WES to characterize the genetic changes in sarcomas derived from 4 mouse models with distinct and clearly defined tumor-initiating events: high-dose focal IR, chemical carcinogen (MCA), p53 loss with a chemical carcinogen (MCA), and p53 loss with Kras activation.
A mutational signature depends on the mechanism of mutagenesis and subsequent selection pro-cess that malignant cells undergo during tumor development. For example, MCA metabolites form
R E S E A R C H A R T I C L E
covalent bonds with double- and single-stranded DNA, preferentially at guanine residues, to produce G-to-T transversions (8). Therefore, the specific base changes that predominate in the MCA-induced
p53 WT and MCA-induced p53–/– sarcomas are G-to-T and the reverse (C-to-A) single-base
substitu-tions (Figure 1F). IR generates DNA damage when energy is directly absorbed by DNA molecules and indirectly through ionization of water or other intracellular molecules to generate hydroxyl radicals that cause 2-deoxyribose oxidation (18, 19). Guanine residues are particularly sensitive to oxidation
compared with cytosine, thymine, and adenine, and 8-oxo-7,8-dihydro-2′-deoxyguanosine (8-oxoG) is
among the most readily detected base products after IR (20). Subsequently, 8-oxoG itself is far more susceptible to further oxidation, yielding more stable molecules, including spiroiminodihydantoin and guanidinohydantoin, which are more mutagenic (18). 8-oxoG adducts predominately lead to G-to-C and T-to-A transitions (21). Furthermore, reactive oxygen species through Fenton chemistry lead to deamination of methylated cytosines and thymine single-base substitutions (22, 23). Therefore, G-to-A and C-to-T DNA transition mutations are hallmarks of oxidative damage (23). Previous analyses of
R E S E A R C H A R T I C L E
radiation-associated human tumors (24, 25) and radiation-induced mouse tumors (26) reported a prev-alence of C-to-T transitions. Our data, which include specific controls for alternative tumor-initiating events, demonstrate a preference for C-to-T and the reverse (G-to-A) base sequence mutations in radi-ation-induced tumors (Figure 1F), indicating a strong oxidative mutation signature generated by IR.
Although the single-base substitution patterns for each tumor model reveal distinguishing underlying mechanistic information, the overall somatic mutational load also provides insights into tumor initiation. MCA is a potent mutagen that generates sarcomas with roughly 80 times the median number of mutations
compared with IR-induced sarcomas or KrasG12D p53–/– sarcomas (Figure 1B). Thus, the MCA-driven p53–
/– sarcomas represent a potentially novel, spatially and temporally restricted, high–mutational load mouse
model in which autochthonous tumors develop over 10–18 weeks (Supplemental Table 2), evolving under the selective pressure of an intact immune system. In contrast with conventional genetically engineered mouse models, such as the KrasG12D p53–/– sarcomas, the MCA-driven p53–/– sarcomas exhibit a mutational
load similar to many human cancers that respond to immunotherapy (27, 28). Therefore, this model will be an important new tool to study the coevolution of tumors with the immune system and a preclinical platform to test immunotherapy.
Remarkably, the radiation-induced sarcomas exhibited relatively few nonsynonymous somatic mutations (Figure 1C). The low mutational load in the radiation-induced tumors is surprising, but this is consistent with radiation acting as a relatively weak carcinogen (3, 7). Notably, others have reported higher mutational loads in radiation-induced mouse tumors (26). Potential explanations for this discrepancy include differences in tumor types analyzed and radiation dose and fractionation. Moreover, a reference genome was used to call somatic mutations (26), which has the potential to increase the number of called mutations. In contrast, we performed WES using paired normal tissue as the reference for each tumor. Consistent with our findings, studies examining human radiation-associated tumors reported a relatively low mutational load (24, 25, 29). Because we did not sequence other tumor types or include tumors that developed after fractionated radiation exposure, the signature defined herein may not be universal for all radiation-induced cancers.
Although radiation-induced sarcomas exhibited a low number of mutations, they were composed of
a higher proportion of nonsynonymous deletion events compared with KrasG12D p53–/– and MCA-driven
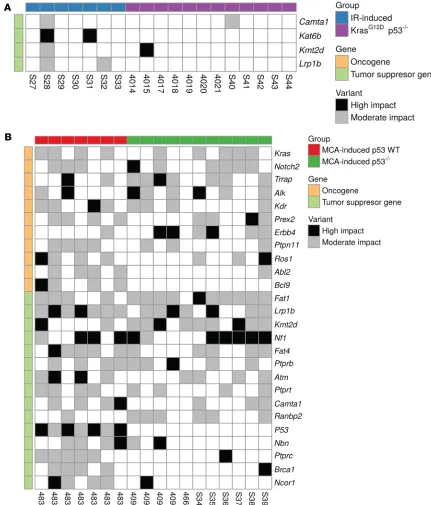
sarcomas (Figure 1E). This result corroborates the finding from Behjati et al. (25) showing that insertions and deletions were not equally represented in human radiation-associated second malignancies, but rather that deletions were enriched and evenly distributed throughout the genome (25). Although deletions were relatively common, perhaps suggesting a loss of tumor suppressor function, none of the radiation-induced sarcomas in this study exhibited a mutation in the p53 gene. In fact, no specific driver mutations were identified in this tumor cohort (Figure 4A). However, the low mutational burden observed by WES in the mouse radiation-induced sarcomas represents a limitation for identifying specific driver mutations and conducting NMF signature analysis. In contrast, gene copy number changes were more abundant in
radia-tion-induced sarcomas compared with KrasG12D p53–/– and MCA-driven tumors. Oncogenes Met, Yap1, and
Birc3 each exhibited copy number gains in approximately half of the radiation-induced tumors (Figure 5C). Notably, the Yap1 pathway is commonly activated in rhabdomyosarcomas, and Yap1 overexpression in muscle satellite cells is sufficient to induce sarcomagenesis in the context of muscle injury (30).
In contrast with the radiation-induced tumors, which retained WT p53 genes, all MCA-induced tumors from WT mice acquired a p53 mutation (Figure 4B and Supplemental Figure 7). Although 7 of 8 of the radiation-induced tumors arose from mice that received 10 days of doxycycline to induce p53 shRNA during radiation (i.e., temporary p53 knockdown), doxycycline was removed immediately following irra-diation, and mice subsequently remained on normal chow for the remainder of the experiment. Notably, the radiation-induced tumor that arose from a mouse lacking the p53 shRNA gene likewise did not harbor a detectable p53 mutation. The MCA-induced tumors that developed on a p53 WT background exhibited increased incidence of tumor suppressor mutations compared with MCA-induced tumors that developed in the setting of Cre-mediated p53 deletion. Interestingly, the MCA-induced p53 WT tumor mutational
spectrum differed substantially from that of the MCA-induced p53–/– tumors. The tumors that arose in
WT mice with initially intact p53 developed over a longer period and activated different pathways. Indeed, oncogenes Abl2 and Bcl9 and tumor suppressors Nbn, Ptprc, Brca1, and Ncor1 were altered in over half of
the MCA-induced p53 WT tumors versus almost none of the MCA-induced p53–/– tumors (Figure 4B).
was mutated in half of all MCA-driven tumors independent of p53 status. Moreover, the tumor suppressor Fat1 was mutated in nearly all MCA tumors, and Fat4, Notch2, and NF1 were also commonly disrupted (Figure 4B). Our study comports with sequencing data from a commonly used MCA-driven sarcoma cell
line derived from immunodeficient mice (Rag2–/–) (31). Furthermore, our comprehensive analysis of a large
cohort of MCA-driven tumors supports the utility of this well-characterized primary mouse model of sar-coma for preclinical drug development studies in the presence of an intact immune system.
The genetic landscape of radiation-induced tumors reported here is distinct from published signatures for other carcinogenic processes, such as aging (32) or UV exposure (33). In studies examining radiation-as-sociated liver tumors, higher radiation dose resulted in an increased fraction of cells harboring p53 muta-tions, likely through a clonal expansion mechanism (34). We previously published a report detailing the non–cell-autonomous mechanism by which radiation induces lymphomagenesis (12). In this case, total-body irradiation eliminates cells in the bone marrow niche, allowing thymic cells with preexisting oncogenic mutations to expand into a tumor unencumbered by cell competition from the bone marrow. However, the mechanisms for radiation-induced sarcomagenesis may be distinct from radiation-induced lymphom-agenesis. The WES provides evidence of radiation-induced oxidative DNA damage and amplification of genes such as Met and Yap1, which are both associated with injury-induced sarcomas (35), suggesting a cell-autonomous mechanism. We suspect that after tumor-initiating cells undergo radiation-induced DNA damage, they begin clonal expansion and develop into a tumor through a selection process shaped by acute and chronically injured surrounding tissue following radiation exposure. The microenvironment of irradi-ated tissue is characterized by high levels of inflammatory cells and increased growth factor secretion to stimulate wound healing. Tumors that arise under these conditions are adapted to take advantage of the abundant cytokines in this milieu (36). Therefore, radiation-induced cancer may respond to different ther-apeutic approaches, including immunotherapy, compared with tumors from the same tissue that develop independent of radiation exposure. Defining a signature of radiation-induced cancer that can identify and characterize these tumors is a critical step toward optimizing treatment for this challenging clinical problem.
Methods
Mouse strains and sarcoma induction
To study IR-induced sarcomas, we used previously described mouse models expressing a doxycycline-inducible shRNA against p53, including CMV-rtTA TRE-p53.1224 and Actin-rtTA TRE-p53.1224 mice, as well as their litter-mates that express only rtTA or TRE-p53.1224 (12). These mice were provided by Scott Lowe (Memorial Sloan Kettering Cancer Center, New York, New York, USA). All mice were on a C3H and C57BL/6J mixed genetic background. Six- to 24-week-old mice were placed on a doxycycline diet for 10 days before irradiation (12). The left hind limb of the mice was irradiated with 30 or 40 Gy, and then animals were immediately returned to normal chow. Hind limb irradiation was performed using the X-RAD 225Cx small-animal image-guided irradiator (Precision X-Ray). The irradiation field included the whole left hind limb and was defined using fluoroscopy with 40-kVp, 2.5-mA x-rays using a 2-mm aluminum filter. Irradiations were performed using parallel-opposed anterior and posterior fields with an average dose rate of 300 cGy/min prescribed to midplane with 225-kVp, 13-mA x-rays using a 0.3-mm copper filter.
Genetically engineered and carcinogen-induced primary sarcomas were generated in 6- to 10-week-old mice with a mixed genetic background. LSL-Kras mice were provided by Tyler Jacks (MIT,
Cam-bridge, Massachusetts, USA) and p53fl/fl mice were provided by Anton Berns (Netherlands Cancer
Institute, Amsterdam, The Netherlands). Primary KrasG12D p53–/– sarcomas were induced by injection
of Ad-Cre (Viral Vector Core, University of Iowa, Iowa City, Iowa, USA) into the gastrocnemius of
LSL-KrasG12D p53fl/fl mice (10). Carcinogen-induced sarcomas in mice with intact p53 (MCA-induced p53
WT) were generated by intramuscular injection of 300 μg MCA (MilliporeSigma) resuspended in
ses-ame oil (MilliporeSigma) at 6 μg/μL. MCA-induced sarcomas were induced in the setting of p53
dele-tion by intramuscular Ad-Cre injecdele-tion into the gastrocnemius of p53fl/fl mice (MCA-induced p53–/–),
followed 24 hours later by a 300-μg injection of MCA.
R E S E A R C H A R T I C L E
WES methods
Tumor specimens and matched liver control samples stored in RNAlater were used for DNA extraction. DNA extraction was performed using DNeasy Blood and Tissue Kit or AllPrep DNA/RNA Mini Kit (Qia-gen). WES was performed in 2 batches using either previously described methods (batch 1) (35) or the
follow-ing method (batch 2) (Supplemental Table 1). One mouse in the KrasG12D p53–/– cohort, S45, was excluded
from analyses after WES showed no evidence of a deletion of p53 exons 2–10. Genomic DNA samples were quantified using fluorometric quantitation on the Qubit 2.0 (Thermo Fisher Scientific). For each sample, 200 ng of DNA was sheared using Focused-ultrasonicators (Covaris) to generate DNA fragments of about 300
bp in length. Sequencing libraries were then prepared using the Agilent SureSelectXT Mouse All Exon Kit
(S0276129). During adapter ligation, unique indexes were added to each sample. Resulting libraries were cleaned using Solid Phase Reversible Immobilization beads (Beckman Coulter) and quantified on the Qubit 2.0, and size distribution was checked on an Agilent Bioanalyzer. Libraries were subsequently enriched indi-vidually by hybridization of the prepared genomic DNA libraries with mouse all-exome target-specific probes provided with the SureSelectXT Mouse All Exon Kit. The kit has a target size of 49.6 megabases. After hybrid-ization, the targeted molecules were captured on streptavidin beads (Invitrogen). Once enriched, the libraries were pooled and sequenced on the Illumina HiSeq 2500 and Illumina HiSeq 4000 with read length of 125-bp and 150-bp paired-end sequencing protocols, respectively (Supplemental Table 8). This pooling scheme gen-erated about 14.5 to 63.5 million reads per sample, or about 6 gigabytes of data. Once gengen-erated, sequence data were demultiplexed, and FASTQ files were generated using Bcl2Fastq2 conversion software provided by Illumina. The sequencing data along with the called mutations in vcf format have been deposited into the National Center for Biotechnology Information Sequence Read Archive under project ID PRJNA516973.
WES data analyses
Somatic mutation calling. The raw sequences were first aligned to the mouse reference genome using the BWA-MEM algorithm (v0.7.12-r1039) (37). The mouse reference genome, and SNP and indel annotation data were obtained from Sanger Institute FTP site (ftp://ftp-mouse.sanger.ac.uk/): GRCm38_68.fa (md5sum b81bcde0f9246abe84208e80049d5ba8), mgp.v5.merged.snps_all.dbSNP142.vcf.gz (md5sum e778a2cbc-c05fef1fac3d4025bcfb660), mgp.v5.merged.indels.dbSNP142.normed.vcf.gz (md5sum 3ceffa10ee653ef54d-c0f3524b7d9a57). Somatic mutation information was from COSMIC (38), and SNPs were annotated using SNPeff (39) and Oncotator (40). The original capture file, which had been built on GRCm37 (mm9), was lifted to GRCm38 (mm10) to match with the other reference files. The aligned bam files were preprocessed by using Picard tools (v2.8.3; http://broadinstitute.github.io/picard/faq.html), followed by somatic muta-tion detecmuta-tion using GATK3-MuTect2 (41). The impact of called mutamuta-tions was evaluated using Ensembl’s Variant Effect Predictor (VEP) (v91.3) (42) and visualized using R package pheatmap (43).
Somatic mutation plots. Called mutations (SNVs and indels) in GATK3-MuTect2 and annotated by VEP as having “High” or “Moderate” impact were considered “protein altering.” To determine oncogen-ic drivers, the COSMIC database (44) was used as a consistent, community-accepted database of tumor suppressors and oncogenes (release v85). Tier 1 genes were downloaded from the Cancer Gene Census, with fusion-only genes removed, and entered into MouseMine to determine murine homologs of these oncogenes and tumor suppressor genes.
The list of protein-altering mutations was filtered to only those mutations occurring within one of the identified genes, using the Bioconductor (45) R package biomaRt (46) to determine gene locations. If a sample had more than 1 mutation within a single gene, the mutation of greatest impact was retained. For non-MCA sarcoma samples, genes mutated in 2 or more samples were included in the figures. For sarco-mas induced by MCA, genes mutated in more than 50% of samples in a single tumor type were included.
Mutational signatures. Signature analysis and visualization were conducted using the method of Alexan-drov et al. (14) implemented in R package maftools (v1.6.15) (47).
qRT-PCR
Relative genomic DNA levels were determined using quantitative PCR assays performed on the Quant-Studio 6 Flex Real-Time PCR System with PowerUp SYBR Green Master Mix (Thermo Fisher Scientific, A25742) and specific primer sets designed within exons. Target gene quantification levels were normalized
to a housekeeper gene and normal tissue DNA samples using the ΔΔCT method. Primers included Met
DNA, forward, AATATCCTCCAAGCCGCGTA; Met DNA, reverse, TGATGGGGAATGCACAGACT; Yap1 DNA, forward, CAAATGTGGACCTTGGCACA; Yap1 DNA, reverse, CCCTCACAGACTCA-GAGTGG; Brca1 DNA, forward, CGGATGCCAAGAAGAACGAG; Brca1 DNA, reverse, GTTCCT-GTTCTCTGAGGGCT; Birc3 DNA, forward, GGACAGTCCCATGGAGAAGC; Birc3 DNA, reverse, CAAAGGCATGGTGCTCATCG; 36B4 DNA, forward, ACTGGTCTAGGACCCGAGAAG; and 36B4 DNA, reverse, TCAATGGTGCCTCTGGAGATT.
Immunohistochemistry
Tumor tissue was fixed in 10% neutral buffered formalin for 24 to 48 hours, preserved in 70% ethanol, and embedded in paraffin. Tissues were sectioned onto a slide and stained with hematoxylin and eosin.
Statistics
The P values presented were 2 sided, were the results of post hoc analyses, and were not adjusted for multi-ple testing. When comparing a quantitative phenotype with respect to 2 groups, the Mann-Whitney U test was used, whereas for 3 or more groups, the Kruskal-Wallis test was used. All inferential analyses were carried out using the R statistical environment (50) along with extension packages from the Comprehensive R Archive Network (https://cran.r-project.org/) and the Bioconductor project (45). Box-and-whisker plots presented in the figures were constructed as follows: the center line indicates the median value, the bounds represent the first and third quartiles, and the whiskers extend to either a length of 1.5 times the interquar-tile range past the bounds or to the most extreme data value (i.e., minimum or maximum), whichever was shorter. In box and scatter plots, each dot represents the data for 1 tumor, unless otherwise indicated. In bar plots, each bar represents the data for 1 tumor, unless otherwise indicated.
Computational considerations
The analyses were conducted with adherence to the principles of reproducible analysis using the knitr package (51) for generation of dynamic reports and Mercurial (https://www.mercurial-scm.org/) for source code management. The code for replicating the statistical analysis was made available through a public source code repository (https://bitbucket.org/dcibioinformatics/kirsch-lee-sarcoma-wes/src/ default/, commit ID 13:82732a597433).
Study approval
All animal procedures for this study were approved by the Institutional Animal Care and Use Committee at Duke University, Durham, North Carolina, USA.
Author contributions
CLL, YMM, ARD, and DGK designed the study. CLL, YMM, ARD, AJW, IC, LL, and DVM performed exper-iments. CLL, YMM, ARD, DZ, ABS, JRD, AJW, XQ, XW, JG, DVM, KO, and DGK analyzed and interpreted data. CLL, YMM, ARD, and DGK wrote the manuscript. All authors edited and approved the manuscript.
Acknowledgments
R E S E A R C H A R T I C L E
Address correspondence to: David G. Kirsch, Duke University Medical Center, Box 91006, Durham, North Carolina 27708, USA. Phone: 919.681.8605; Email: [email protected].
1. Moding EJ, Kastan MB, Kirsch DG. Strategies for optimizing the response of cancer and normal tissues to radiation. Nat Rev Drug Discov. 2013;12(7):526–542.
2. Sharma RA, et al. Clinical development of new drug-radiotherapy combinations. Nat Rev Clin Oncol. 2016;13(10):627–642. 3. Suit H, et al. Secondary carcinogenesis in patients treated with radiation: a review of data on radiation-induced cancers in
human, non-human primate, canine and rodent subjects. Radiat Res. 2007;167(1):12–42.
4. Hall EJ. Intensity-modulated radiation therapy, protons, and the risk of second cancers. Int J Radiat Oncol Biol Phys. 2006;65(1):1–7.
5. Dracham CB, Shankar A, Madan R. Radiation induced secondary malignancies: a review article. Radiat Oncol J. 2018;36(2):85–94. 6. Eriksson D, Stigbrand T. Radiation-induced cell death mechanisms. Tumour Biol. 2010;31(4):363–372.
7. Little JB. Radiation carcinogenesis. Carcinogenesis. 2000;21(3):397–404.
8. Shimokado K, et al. p53 gene mutation and loss of heterozygosity of chromosome 11 in methylcholanthrene-induced mouse sarcomas. Jpn J Cancer Res. 1998;89(3):269–277.
9. Edmondson EF, Hunter NR, Weil MM, Mason KA. Tumor induction in mice after localized single- or fractionated-dose irradiation: differences in tumor histotype and genetic susceptibility based on dose scheduling. Int J Radiat Oncol Biol Phys. 2015;92(4):829–836.
10. Kirsch DG, et al. A spatially and temporally restricted mouse model of soft tissue sarcoma. Nat Med. 2007;13(8):992–997. 11. Prehn RT, Main JM. Immunity to methylcholanthrene-induced sarcomas. J Natl Cancer Inst. 1957;18(6):769–778.
12. Lee CL, et al. Acute DNA damage activates the tumour suppressor p53 to promote radiation-induced lymphoma. Nat Commun. 2015;6:8477.
13. Campbell BB, et al. Comprehensive analysis of hypermutation in human cancer. Cell. 2017;171(5):1042–1056.e10. 14. Alexandrov LB, et al. Signatures of mutational processes in human cancer. Nature. 2013;500(7463):415–421. 15. Alexandrov LB, et al. Clock-like mutational processes in human somatic cells. Nat Genet. 2015;47(12):1402–1407. 16. Jiang Y, Wang R, Urrutia E, Anastopoulos IN, Nathanson KL, Zhang NR. CODEX2: full-spectrum copy number variation
detection by high-throughput DNA sequencing. Genome Biol. 2018;19(1):202.
17. Berrington de Gonzalez A, Kutsenko A, Rajaraman P. Sarcoma risk after radiation exposure. Clin Sarcoma Res. 2012;2(1):18. 18. Cui L, et al. Comparative analysis of four oxidized guanine lesions from reactions of DNA with peroxynitrite, singlet oxygen,
and γ-radiation. Chem Res Toxicol. 2013;26(2):195–202.
19. Chan W, Chen B, Wang L, Taghizadeh K, Demott MS, Dedon PC. Quantification of the 2-deoxyribonolactone and nucleoside
5′-aldehyde products of 2-deoxyribose oxidation in DNA and cells by isotope-dilution gas chromatography mass spectrometry:
differential effects of gamma-radiation and Fe2+-EDTA. J Am Chem Soc. 2010;132(17):6145–6153.
20. Cooke MS, Evans MD, Dizdaroglu M, Lunec J. Oxidative DNA damage: mechanisms, mutation, and disease. FASEB J. 2003;17(10):1195–1214.
21. Yasui M, Kanemaru Y, Kamoshita N, Suzuki T, Arakawa T, Honma M. Tracing the fates of site-specifically introduced DNA adducts in the human genome. DNA Repair (Amst). 2014;15:11–20.
22. Kreutzer DA, Essigmann JM. Oxidized, deaminated cytosines are a source of C → T transitions in vivo. Proc Natl Acad Sci U S
A. 1998;95(7):3578–3582.
23. Bacolla A, Cooper DN, Vasquez KM. Mechanisms of base substitution mutagenesis in cancer genomes. Genes (Basel). 2014;5(1):108–146.
24. Thibodeau BJ, et al. Mutational landscape of radiation-associated angiosarcoma of the breast. Oncotarget. 2018;9(11):10042–10053. 25. Behjati S, et al. Mutational signatures of ionizing radiation in second malignancies. Nat Commun. 2016;7:12605.
26. Sherborne AL, Davidson PR, Yu K, Nakamura AO, Rashid M, Nakamura JL. Mutational analysis of ionizing radiation induced neoplasms. Cell Rep. 2015;12(11):1915–1926.
27. Samstein RM, et al. Tumor mutational load predicts survival after immunotherapy across multiple cancer types. Nat Genet. 2019;51(2):202–206.
28. Chalmers ZR, et al. Analysis of 100,000 human cancer genomes reveals the landscape of tumor mutational burden. Genome Med. 2017;9(1):34.
29. López GY, et al. The genetic landscape of gliomas arising after therapeutic radiation. Acta Neuropathol. 2019;137(1):139–150. 30. Tremblay AM, et al. The Hippo transducer YAP1 transforms activated satellite cells and is a potent effector of embryonal
rhab-domyosarcoma formation. Cancer Cell. 2014;26(2):273–287.
31. Matsushita H, et al. Cancer exome analysis reveals a T-cell-dependent mechanism of cancer immunoediting. Nature. 2012;482(7385):400–404.
32. Martincorena I, et al. Somatic mutant clones colonize the human esophagus with age. Science. 2018;362(6417):911–917. 33. Brash DE. UV signature mutations. Photochem Photobiol. 2015;91(1):15–26.
34. Iwamoto KS, Mizuno T, Tokuoka S, Mabuchi K, Seyama T. Frequency of p53 mutations in hepatocellular carcinomas from atomic bomb survivors. J Natl Cancer Inst. 1998;90(15):1167–1168.
35. Van Mater D, et al. Injury promotes sarcoma development in a genetically and temporally restricted manner. JCI Insight. 2018;3(20):e123687.
36. Nguyen DH, et al. Radiation acts on the microenvironment to affect breast carcinogenesis by distinct mechanisms that decrease cancer latency and affect tumor type. Cancer Cell. 2011;19(5):640–651.
37. Li H. Aligning sequence reads, clone sequences assembly contigs with BWA-MEM. Cornell University. https://arxiv.org/ abs/1303.3997. Published March 16, 2013. Updated May 26, 2013. Accessed June 5, 2019.
2015;43(Database issue):D805–D811.
39. Cingolani P, et al. A program for annotating and predicting the effects of single nucleotide polymorphisms, SnpEff: SNPs in the genome of Drosophila melanogaster strain w1118; iso-2; iso-3. Fly (Austin). 2012;6(2):80–92.
40. Ramos AH, et al. Oncotator: cancer variant annotation tool. Hum Mutat. 2015;36(4):E2423–E2429.
41. McKenna A, et al. The Genome Analysis Toolkit: a MapReduce framework for analyzing next-generation DNA sequencing data. Genome Res. 2010;20(9):1297–1303.
42. McLaren W, et al. The Ensembl Variant Effect Predictor. Genome Biol. 2016;17(1):122.
43. Kolde R. 2015. pheatmap: Pretty Heatmaps. R package version 1.0.8. https://CRAN.R-project.org/package=pheatmap. 44. Forbes SA, et al. COSMIC: somatic cancer genetics at high-resolution. Nucleic Acids Res. 2017;45(D1):D777–D783. 45. Gentleman RC, et al. Bioconductor: open software development for computational biology and bioinformatics. Genome Biol.
2004;5(10):R80.
46. Durinck S, Spellman PT, Birney E, Huber W. Mapping identifiers for the integration of genomic datasets with the R/Biocon-ductor package biomaRt. Nat Protoc. 2009;4(8):1184–1191.
47. Mayakonda A, Koeffler HP. Maftools: Efficient analysis, visualization and summarization of MAF files from large-scale cohor tbased cancer studies. bioRxiv. https://doi.org/10.1101/052662. Published May 11, 2016. Accessed June 5, 2019.
48. Team BC, Maintainer BP. TxDb.Mmusculus.UCSC.mm10.knownGene: Annotation package for TxDb object(s). R package ver-sion 3.4.7. Bioconductor. https://doi.org/10.18129/B9.bioc.TxDb.Mmusculus.UCSC.mm10.knownGene. Accessed June 5, 2019. 49. Carlson M. org.Mm.eg.db: Genome wide annotation for Mouse. R package version 3.8.2. Bioconductor. https://doi.
org/10.18129/B9.bioc.org.Mm.eg.db. Accessed June 5, 2019.
50. R Core Team. R: A language and environment for statistical computing. R Foundation for Statistical Computing, Vienna, Austria. http://www.R-project.org/. Accessed June 5, 2019.