A b s t r a c t. Measurements of single-kernel mass and volume made on healthy (control) and scab-damaged samples of grain of three winter wheat varieties never resulted in lower values of mean single-kernel density for scab-damaged grain. This finding, contra-ry to common opinion, can be explained as being a result of the comparable magnitude of relative decrease (due to infestation) of two features (mass and volume) that define single-kernel density. The discrepancy between results presented in this paper (kernel volume was determined with an air pycnometer) and the results in some other reports (liquid pycnometers used) can result from the different methods applied for kernel volume measurements: when a liquid medium is used the surface tension effect tends to overes-timate the volume, especially for scabby kernels that are known to be shrivellediepossessing voids and pores at the surface that the liquid cannot penetrate. As a consequence kernel density of scabby kernels can be significantly underestimated.
K e y w o r d s: wheat, scab, single-kernel density INTRODUCTION
Fusariumspp. invading grain is known to cause a grain disease called fusarium head blight or scab. Scab-damaged kernels differ from sound kernels in many respects. First of all, they differ in chemical composition, also due to conta-mination with mycotoxins, which results in a lowering of grain quality (Bechtelet al.,1985; Boyaciouglu and Hettia-rachchy, 1995; Seitz and Bechtel, 1985; W¹sowicz, 1991). Changes in chemical composition are accompanied by chan-ges in physical properties, such as mass, volume, density, kernel colour, hardness,etc. These changes can influence grain processing parameters dependent on physical traits (Dobraszczyket al., 2002; Dziki and Laskowski, 2004, 2005)
and some procedures proposed for improvement grain quality (Siemens and Jones, 2008). Furthermore, changes in physical properties can also be a basis for the development of different approaches for rapid and cost-effective methods both for grading grain quality and for improving the quality of grain by removal of damaged kernels (Dowell et al., 2006; Pearson et al., 2007). Huff (1980) and Huff and Hagler (1982, 1985) used buoyancy of grain in liquids of various densities for the separation of less dense (more buoyant) fractions of grain. The buoyant fractions were much more contaminated with mycotoxins than the samples of grain before separation. Tkachuket al. (1991) showed a distinct negative correlation between kernel density and the inten-sity of visible symptoms of scab in wheat. Mycological and chemical examinations of the samples investigated by Tkachuk et al. (1991) proved that the higher the level of infestation withFusariumand contamination with deoxy-nivalenol, the lower was the density of wheat kernels. Our own preliminary evaluations of SK (single-kernel) density of control and scabby grain for two varieties (cultivated in the years 2004 and 2005), based on measurements of SK mass and volume, showed greater mean SK density for scabby grain (Siuda and Sadowski, 2005). Although SK volume measurements came from a simple homemade air micropycnometer, careful analysis of the instrument proper-ties revealed no reasons for erroneous systematic under-estimation of smaller volumes (Siuda and Rozwadowski, 2006). Therefore, a more advanced air micropycnometer was developed and constructed, and the measurements were repeated on three varieties of winter wheat cultivated and harvested in the year 2006. The obtained results showed Int. Agrophys., 2012, 26, 129-135
doi: 10.2478/v10247-012-0019-5
Evaluation of single-kernel density of scab-damaged winter wheat**
A. Grabowski
1, R. Siuda
1*, L. Lenc
2, and S. Grundas
31Institute of Mathematics and Physics, University of Technology and Life Sciences, Al. Prof. Kaliskiego 7, 85-789 Bydgoszcz, Poland 2
Chair of Phytopathology and Molecular Mycology, University of Technology and Life Sciences, Ks. Kordeckiego 20, 85-225 Bydgoszcz, Poland
3
Institute of Agrophysics, Polish Academy of Sciences, Doœwiadczalna 4, 20-290 Lublin, Poland Received April 21, 2011; accepted September 29, 2011
© 2012 Institute of Agrophysics, Polish Academy of Sciences *Corresponding author’s e-mail: [email protected]
**The work was financed from the budget for science in Poland, projects No. 2P06R 040 30 and BS-16/2005.
again that mean SK density of the control (healthy) grain again did not exceed the density of the scabby grain samples. Similar results ware also obtained in the year 2007. It has to be stressed, however, that several definitions for SK density are in use (Chang, 1988). In the present report SK density is the ratio of SK mass to SK volume, the latter as determined with air pycnometer ie as the volume that can include possible internal voids inaccessible for air.
The aim of the study is to provide detailed evidence that the mean single-kernel density can be approximately the same in both healthy and scab-damaged kernels. Further-more, we also want to explain why this finding may only seemingly contradict the results reported in the some other papers (Huff, 1980; Huff and Hagler, 1982, 1985; Martinet al.,1998).
MATERIALS AND METHODS
Two lots of three varieties (Satyna, Tonacja, Trend) of winter wheat (Triticum aestivumL.emend) grain were ob-tained from two plots cultivated in the year 2006. One lot of each variety was harvested from a plot where the crop grew in natural conditions, while the other one was harvested from a plot where inoculation of the heads with a suspension of F. culmorumconidia (concentration 1 106cm-3, intensity of the sprinkling 0.09 dcm3of the suspension per m2) was carried out during the flowering stage. Grain from the plots where inoculation was not applied will be referred to as control, whereas that from the inoculated plot as scabby or damaged. The control grain had no visual symptoms of infestation. After harvesting and threshing, lots of both control and damaged grain were dried in air at room tem-perature, then stored in the same conditions for about two months and the measurements were then carried out within three weeks, subsequently for samples taken from both control and damaged lots of particular varieties.
From the lots of control and damaged grain, samples of 377 to 430 kernels were taken randomly. For each kernel were measured both mass and volume and SK density was calculated as the ratio of SK mass to SK volume. SK masses were taken from kernel examinations made one by one with an SKCS 4100 (Single Kernel Characterization System, Perten Instruments, Springfield, IL) device that allowed measurement of mass at position 0.1 mg. SK volumes were measured with an homemade air micropycnometer prior to the SKCS measurements.
The principle of SK volume measurement is based on measurements of air pressure in the micropycnometer cham-ber (with pressure sensor HPXA 6115A, Semiconductors, US) before and after its expansion, and when the chamber is either empty or containing a kernel. Knowledge of the four pressures permitted determination of the volume of the SK on the basis of the law describing the polytropic process:
pVk=const, (1)
where:pandVstand for the pressure and volume of a con-stant amount of gas, respectively, whilekis an exponent of the polytropic process. Test measurements showed that if the time between the expansion and pressure readouts was set as at least 0.7 s, the process could be assumed as an isothermal one. Denoting measured pressures as p with subscript 1 or 2 for the values before and after expansion, respectively, and superscript 0 for an empty chamber, while without superscript for the chamber with a kernel, Eq. (1) allows us to write two equations:
p Vc10 = p (V20 c+V )a ,
and
p (V1 c-V )k = p (V2 c+Va-V )k , (2)
where:Vc= 297.8±5.4 mm3,Va= 255.4±4.6 mm3andVk
denote the volume of the chamber, the additional volume due to expansion and the volume of the kernel, respectively. The above equations lead to the formula:
V V p p
p p
k= c
-æ
è ç ç
ö
ø ÷ ÷
1 1
1 1
0 2 0
1 2
( / )
/ , (3)
that enables one to determine kernel volume based on mea-surements of relevant pressures. Calibration of the pycno-meter was made with six steel balls of volumes ranging from 7.92±0.08 to 48.84±0.21 mm3determined on the basis of precisely measured diameters. Coefficient of determination for the relationship between volumes measured with the pycnometer and calculated volumes was 0.9995. The pycno-meter gave no possibility for using gas other than atmos-pheric air. The measurement of kernel volume starts with putting a kernel by hand into the measuring chamber, and the computer that controls the chamber expansion process, pres-sure meapres-surements and data acquisition is then activated. Prior to the measurement of every twenty kernels, a measu-rement of pressure with an empty chamber is made and used in the volume determination of these twenty kernels. The cycle for one kernel lasts ca. 5 s, however, the necessary hand operations elongate this time and practical throughput of this half-automated instrument isca. 120 kernels per hour.
RESULTS AND DISCUSSION
For each series the first quartile,Q1, and the third quartile,
Q3, were determined and the data outside the range [Q1-t(Q3-Q1);Q3+t(Q3-Q1)] removed, where the value of factor,t, equal to 3, is recommended for discarding extreme outliers, while t = 1.5 for the so called middle outliers (Tukey, 1977). Outlier removal was performed twice, once with each of both of the above values. In most cases the num-ber of outliers was a dozen or so. The resulted values of SK density for all samples and applied procedures for outliers removal, as well as for raw data, are listed in Table 1.
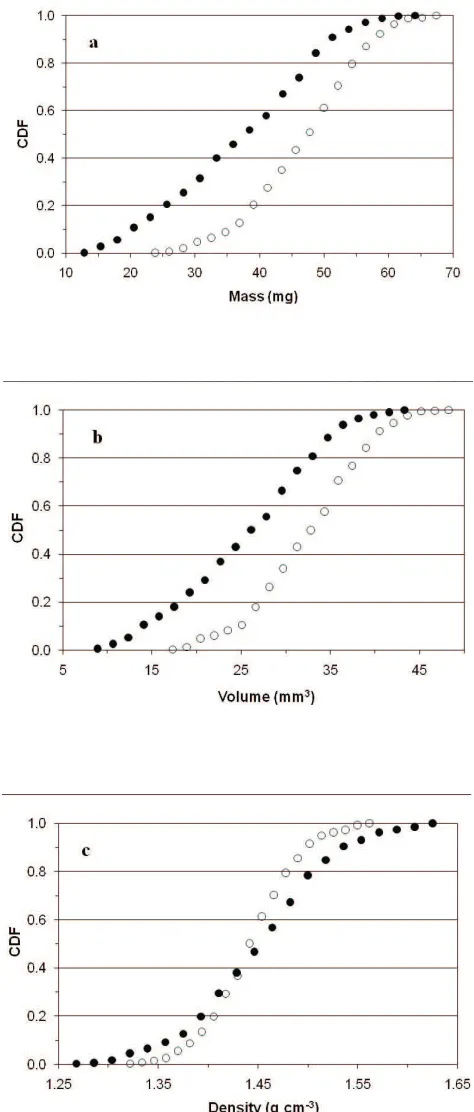
The series of data obtained after discarding the middle outliers was taken for further analysis, since the properties of such data can be expected to be more regular. Some statis-tical parameters characterising the results of measurements selected in a such way are listed in Table 2. Additionally, plots of cumulative distribution functions were made in order to get a better insight into the properties of data series. Fig. 1 present such plots for only one variety, since for the remaining two the plots were qualitatively similar.
The accuracy of directly measured SK mass and volume can be characterised by standard combined uncertainties uC(m) anduC(V), respectively, taking into account standard uncertainties of type A and type B according to the formula (Anonymous, 1993):
uC( )x = uA2( )x +uB2( )x , (4)
where:xstands formorV. As the readout for mass was at position 0.1mg, the standard uncertainty of typeBfor mass measurements can be assumed to be equal touB(m) =±0.1/
3=±0.058 mg. Evaluation of type A uncertainty would need a series of measurements to be made for the same mass (single kernel). This was not feasible with the SKCS 4100, since the instrument crushed the examined kernel and no repetitions of the mass measurements were possible. There-fore, standard combined uncertainty for mass has to be tem-porarily assumed equal touB(m) and as such it is most likely
underestimated. Eight reference volumes were measured in 15 repetitions in order to get information on uC(V). The
results showed that relative standard uncertainty,uC(V)/V,
never exceeded 0.02. As SK density is defined as the ratio of SK mass to SK volume, the standard uncertainty of density, u(d), can be expressed by:
u d d
u m
m
u V
V
C C
( ) ( ) ( )
= æ
è ç ç
ö
ø ÷ ÷+
æ
è ç ç
ö
ø ÷ ÷
2 2
. (5)
Variety Category
Type of outliers removed
None (raw data) Extreme Middle
max mean min max mean min max mean min
Satyna
Control 2.020 1.435 0.886 1.643 1.436 1.286 1.561 1.430 1.311
Damaged 2.571 1.442 0.824 1.761 1.436 1.070 1.639 1.439 1.233
Tonacja
Control 2.222 1.454 0.923 1.677 1.449 1.207 1.590 1.449 1.308
Damaged 3.483 1.483 0.704 1.868 1.462 1.039 1.705 1.455 1.223
Trend
Control 2.379 1.448 0.872 1.593 1.444 1.276 1.562 1.443 1.322
Damaged 5.369 1.476 0.171 1.768 1.447 1.129 1.625 1.450 1.268
T a b l e 1.Maximum, mean and minimum values for SK density (g cm-3) in all series of measurements for raw data and after removal of two types of outliers
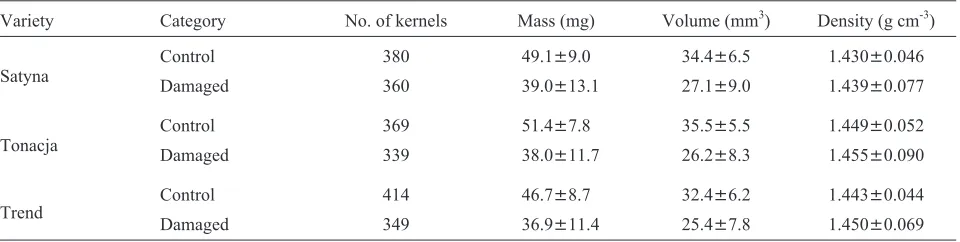
Variety Category No. of kernels Mass (mg) Volume (mm3) Density (g cm-3)
Satyna
Control 380 49.1±9.0 34.4±6.5 1.430±0.046
Damaged 360 39.0±13.1 27.1±9.0 1.439±0.077
Tonacja
Control 369 51.4±7.8 35.5±5.5 1.449±0.052
Damaged 339 38.0±11.7 26.2±8.3 1.455±0.090
Trend
Control 414 46.7±8.7 32.4±6.2 1.443±0.044
Damaged 349 36.9±11.4 25.4±7.8 1.450±0.069
Formula (5) suggests that the absolute value of density uncertainty could increase for lighter kernels. As a conse-quence, one may expect to appear a similar property in the standard deviation of SK density that resulted from measurements. The knowledge of the actual dependence of the observed relative standard deviation of SK density, s(d)/d, versus SK volume could be helpful in settling if this is important. Figure 2 presents plots illustrating such depen-dence for samples of both control and damaged grain calcu-lated within eight subintervals of equal widths (hereafter called octants) covering the whole range of SK volume for only one variety because no qualitative differences were found for the remaining two varieties. The greater values of relative standard deviation of SK density seen for damaged grain could be expected as a result of the smaller volumes of damaged kernels. For variety Trend, mean SK volumes in the extreme octants were 19.3 and 46.4 mm3 for control samples, and 11.1 and 41.2 for damaged samples. This result in the ratios of mean SK volumes in relevant SK volume octants calculated for control and damaged samples equal to 1.74 and 1.13, respectively. One can see from Fig. 2 that these ratios are close to the ratios of relative standard devia-tions of SK density for damaged and control samples within relevant octants. Hence, the above evaluation allows us to assume that the observed dependency, for both categories of grain, of relative standard deviations of SK density on SK volume could be caused by changes in SK volume. This as-sumption is worth being verified more precisely.
The observed standard deviation of SK density, s(d), can be treated as a result of the natural diversity characte-rising kernels in the sample, sn(d), and the uncertainty of density measurements,u(d). The approximate relationship between quantities mentioned above can be written:
Fig. 1.Cumulative distribution functions (CDF) for single kernel: a – mass, b – volume, and c – density distributions for cv. Trend;
control grain,damaged grain.
Fig. 2.Relative standard deviation of SK densityvsSK volume for:
s2( )d @s2n( )d +u2( )d , (6)
and using Eq. (5) it can be rewritten as:
s d d
s d d
u m
Vd
u V
V
n C C
( ) ( ) ( ) ( )
æ è
ç ö
ø ÷ @æ
è
ç ö
ø ÷ +æ
è
ç ö
ø ÷ +æ
è
2 2 2
ç ö
ø ÷
2 , (7)
where:m=Vdhas been substituted. Eq. (7) can be applied to the data presented as plots in Fig. 2. In each octant the values ofs(d),dandVare known, so eight equations can be ob-tained from Eq. (7) with three unknown parameters common for all the equations. This gives a set of linear equations that enables us to find the unknown values ofsn(d),uC(m) and
uC(V). In order to obtain statistically more confident results,
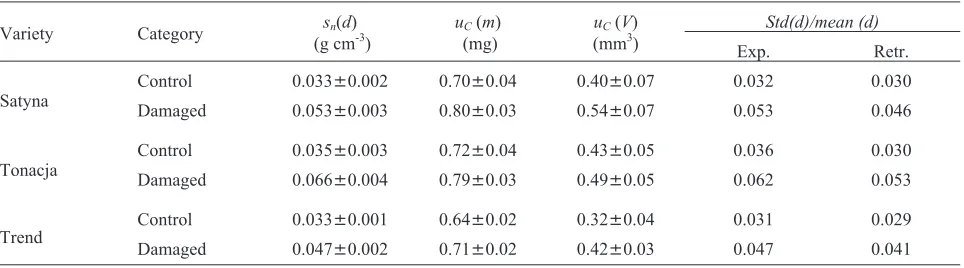
the range for values of SK volume was divided into different equal subintervals, ranging from 6 (sextants) to 10 (decants). Each time the relevant set of equations was solved for un-knowns with the least-squares method. The resulting mean values and standard deviations for the unknowns are listed in Table 3. All parameters are noticeably greater for damaged samples, especiallysn(d). This finding is not surprising since
a greater dispersion of SK density in damaged material was expected. Increase ofuc(V) for damaged sample was also
ex-pected because of possible influence of a more developed morphology of shrivelled infested kernels surface on pres-sure meapres-surements after expansion in a micropycnometer chamber. But the small systematic (for all varieties) increase ofuC(m) is more surprising. This finding suggests that the
weighing device in the SKCS 4100 (under experimental conditions in the course of our measurements) was charac-terized by a weak dependence of the sensitivity on the measured mass. Linear fit touC(m) versus mean SK mass
(Table 2) dependence resulted in a slope equal to -0.0073 and R2=0.53. It is worth pointing out thatuC(m) values in
Table 3 exceed byca. one order of magnitude the evaluation of uB(m) given above. Hence, the actual accuracy of SK
mass measurements was well below expectations based on the precision of the readout only. Its relative valueuC(m)/m
(averaged over varieties) was equal toca. 0.014 and 0.020 for control and damaged samples, respectively. A similar evaluation foruC(V)/Vgives 0.011 and 0.018, which results
in a total experimental relative uncertainty (Eq. (5)) equal to 0.018 and 0.027 for control and damaged samples, respectively. If the calculation of sn(d)/d is based on
averaged values of sn(d) and density within category, the
results are 0.023 for control samples and 0.038 for damaged. These values, compared with the former ones, show that the total uncertainty due to measurements is expected to cause a narrower dispersion of SK density values when we compa-re it to so-called natural diversity. Nevertheless, the measu-rements could increase the experimental dispersion a little. Table 3 provides also comparison of s(d)/mean(d), which were obtained on the basis of obtained unknowns and the right hand side of Eq. (7), with the values obtained from mean and standard deviations for SK density listed in Table 2. One can see that retrieved and experimental values are quite similar in all samples.
To conclude, the experimental relative standard devia-tion of SK density increased a little due to uncertainties of measurements, however, this increase should not affect mean values in the samples since both signs of experimental uncertainties can be expected to be equally probable.
Data from Table 1 show that there is no systematic in-fluence of outliers on mean SK density in the analyzed sam-ples, while their influence on the scatter of density values is clearly seen. Raw data contained a number of obviously false measurements that, if discarded, improved the pro-perties of all data series independently if the extreme or mid-dle outliers were removed. Considerable changes of mean SK mass and volume due to infestation are clearly seen from the values listed in Table 2. It can also be seen that the chan-ges have expected signs,ieboth features have lower means for damaged grain. Furthermore, standard deviations for damaged samples exceed distinctly standard deviations for control samples. The plots presented in Fig. 1 demonstrate, especially for damaged grain, that strong deviation from the
Variety Category sn(d)
(g cm-3)
uC(m) (mg)
uC(V) (mm3)
Std(d)/mean (d)
Exp. Retr.
Satyna
Control 0.033±0.002 0.70±0.04 0.40±0.07 0.032 0.030
Damaged 0.053±0.003 0.80±0.03 0.54±0.07 0.053 0.046
Tonacja
Control 0.035±0.003 0.72±0.04 0.43±0.05 0.036 0.030
Damaged 0.066±0.004 0.79±0.03 0.49±0.05 0.062 0.053
Trend
Control 0.033±0.001 0.64±0.02 0.32±0.04 0.031 0.029
Damaged 0.047±0.002 0.71±0.02 0.42±0.03 0.047 0.041
shape characteristic for normal distribution can be seen even visually. Contrary to plots for mass and volume, the plots for density shown in Fig. 1c resemble the shape typical for normal distribution, both for control and damaged grain.
The increase in the standard deviations of measured features observed for samples taken from damaged grain (Table 2 and Figs 1) was expected because infestation, as an additional source of variability, should broaden the obser-ved variance for the values of measured features in infested samples. Furthermore, comparison of the shapes presented in Fig. 1a, b shows a shift towards lower values and over-representation at these lower values for damaged grain. This finding is understandable in light of the well-known effects of fungal infestation, such as loss of kernel mass, shrinking and shrivelling. As a consequence, a lowering of mean va-lues for SK mass and volume has to appear in samples of damaged grain. How these effects influence SK density de-pends on which one is prevailing. When mass loss prevails, the density is lowered, and when shrinking, the density is in-creased. Ratios of mean SK values of mass to mass and volu-me to voluvolu-me calculated for damaged and control samples give the values 0.794, 0.739, 0.790, and 0.788, 0.738, 0.784 for the three varieties, respectively. These ratios show that losses of mass and volume due to infestation were closely comparable to each other in the investigated samples. It resulted in a much weaker change in the mean SK density.
The results of more than three hundred measurements support any of the values set in Table 2 iea quite ample amount of data. Discussion on the accuracy of the measu-rements from the preceding subsection together with the numerous data sets give strong support for the plausibility of each of the means from Table 2. The Kruskal-Wallis non-parametric one-way analysis of variance, used for evalua-tion of the significance of the differences observed within varieties, classified the differences for mass and volume as significant (confidence parameter p = 0.01) for all varieties. In the case of SK density, the differences were significant for cvs. Satyna and Trend (p = 0.05), while not significant for cv. Tonacja.
The results presented above on the SK density con-tradict the common opinion about density of scabby kernels. Moreover, at first sight, they are inconsistent with the results reported in the cited papers (Huff, 1980; Huff and Hagler, 1982, 1985). However, this contradiction may only be appa-rent, since whether the kernel is buoyant or not depend on its density and the density of the liquid as well as the ability of the liquid to wet the surface of the kernel and penetrate possible pores. For kernels of smooth surface their density is a dominant factor in determining their buoyancy, while for kernels with a more developed surface morphology the surface tension of the liquid may be even more important. The role of surface tension in determination of wheat density was pointed out by (Fang and Campbell, 2000). The authors stated that wheat density, determined with gas pycnometers,
gave values higher than those determined with liquid pycno-meters by up to 10% (depending on the liquid). They assig-ned this difference to lower ability of the liquids to penetrate the pores on the kernel surface. There are also other reports which support this statement. Chang (1988) measurements (helium gas pycnometer) on healthy grain of four varieties of wheat resulted in 1.447 g cm-3on average. This value is close to the ones form our studies, while (Martinet al., 1998) measurements with liquid pycnometer made on samples from eight wheat varieties resulted in averaged SK density 1.28 g cm-3for healthy kernels and 1.08 g cm-3for scab-damaged ones, both considerably lower than our and Chang results. The lower results even for healthy kernels reported by Martinet al. (1998) can likely be ascribed to poor wet-tability of kernel surfaces at the crease (anonymous Referee suggestion).
CONCLUSIONS
1. The presented results show that the samples of kernels, which are taken from lots of scabby grain of three winter wheat varieties, have a mean single-kernel density that is not lower than the control grain. This finding, which is contrary to common opinion, can be explained as being a re-sult of the comparable magnitude of relative decrease of two features (mass and volume) defining density.
2. In experiments where an interaction of a liquid with grain takes place two hypothetical effects can be expected due to surface tension. Firstly, the limited ability of the li-quid to wet the surface of the kernel can result in enhance-ment of a kernel buoyancy, especially of scabby kernel as its surface morphology is more developed.
3. Hence, the buoyancy of scabby kernels is connected more with the limited ability of the liquid to wet kernels surfaces than with the difference in the density of the kernel and liquid. As a consequence, removal of the buoyant fraction from a studied lot of grain makes this method still effective for the separation of more scabby grain from the lot. Secondly, liquid pycnometers overestimate kernel volu-me, especially for damaged grain, though it can also apply for healthy grain due to poor wettability of kernel surfaces at the crease. As a consequence the more the morphology of a kernel surface is developed the more kernel density can be underestimated when it is determined by liquid pycnometry.
REFERENCES
Anonymous, 1993. Guide to the Expression of Uncertainty in Measurement. ISO, Geneva, Switzerland.
Bechtel D.B., Kaleikau L.A., Gaines R.L., and Seitz L.M., 1985.
The effects ofFusarium graminearum on wheat kernels. Cereal Chem., 62, 191-197.
Boyacioglu D. and Hettiarachchy N.S., 1995.Changes in some
Chang C.S., 1988.Measuring density and porosity of grain kernels using a gas pycnometer. Cereal Chem., 65, 13-15.
Dobraszczyk B.J., Whitworth M.B., Vincent J.F.V., and Khan
A.A., 2002. Single kernel wheat hardness and fracture
properties in relation to density and the modelling of fracture in wheat endosperm. J. Cereal Sci., 35, 245-263.
Dowell F.E., Maghirang E.B., Graybosch R.A., Baenziger P.S.,
Baltensperger D.D., and Hansen L.E., 2006. An
automa-ted NIR system for selecting individual kernels based on specfic quality characteristics. Cereal Chem., 83, 537-543.
Dziki D. and Laskowski J., 2004.Influence of kernel size on grind-ing process of wheat at respective grindgrind-ing stages. J. Food Nutr. Sci., 13/54, 29-33.
Dziki D. and Laskowski J., 2005.Wheat kernel physical
pro-perties and milling process. Acta Agrophysica, 127, 59-71.
Fang C. and Campbell G.M., 2000. Effect of measurement
method and moisture content on wheat kernel density mea-surement. Food Bioproducts Proces., 78, 179-186.
Huff W.E., 1980.A physical method for the segregation of afla-toxin-contaminated corn. Cereal Chem., 57, 236-238.
Huff W.E. and Hagler W.M., 1982.Evaluation of density
segre-gation as a means to estimate the degree of aflatoxin conta-mination of corn. Cereal Chem., 59, 152-154.
Huff W.E. and Hagler W.M., 1985.Density segregation of corn
and wheat naturally contaminated with aflatoxin, deoxy-nivalenol and zearalenone. J. Food Protection, 48, 416-420.
Martin Ch., Herrman T.J., Loughin T., and Oentong S., 1998.
Micropycnometer measurement of single-kernel density of healthy, sprouted, and scab-damaged wheats. Cereal Chem., 75, 177-180.
Pearson T.C., Cetin A.E., Tewfik A.H., and Haff R.P., 2007.
Feasibility of impact-acoustic emissions for detection of damaged wheat kernels. Digital Signal Proc., 17, 617-633.
Seitz L.M. and Bechtel D.B., 1985. Chemical, physical and
microscopical studies of scab-infected hard red winter wheat. J. Agric. Food Chem., 33, 373-377.
Siemens M.C. and Jones D.F., 2008.Segregation of soft white
wheat by density for improved quality. Transactions of ASABE, 51, 1035-1047.
Siuda R. and Sadowski C., 2005.Single-kernel density analysis: preliminary results from case study on scab damaged wheat. Proc. 2nd Int. Symp. Recent Advances in Food Analysis, November 2-4, Prague, Czech Republic.
Siuda R. and Rozwadowski M., 2006.Analysis of the accuracy of single-kernel density measurements made with a simple set-up. Acta Agrophysica, 133, 477-485.
Tkachuk R., Dexter J.E., Tipples K.H., and Nowicki T.W., 1991.Removal by specific gravity table of tombstone and associated trichotecenes from wheat infected withFusarium head blight. Cereal Chem., 68, 428-431.
Tukey J.W., 1977.Exploratory Data Analysis. Addison-Wesley
Press, New York, USA.
W¹sowicz E., 1991. Changes of chemical grain components,