A Monthly Double-Blind Peer Reviewed (Refereed/Juried) Open Access International e-Journal - Included in the International Serial Directories
Indexed & Listed at:
VOLUME NO.2(2012),ISSUE NO.11(NOVEMBER) ISSN 2231-5756
INTERNATIONAL JOURNAL OF RESEARCH IN COMMERCE, IT & MANAGEMENT
CONTENTS
CONTENTS
CONTENTS
CONTENTS
Sr.No.
TITLE & NAME OF THE AUTHOR (S)
Page No.
1. SIGNIFICANCE OF COST MANAGEMENT TECHNIQUES IN DECISION MAKING: AN EMPIRICAL STUDY ON ETHIOPIAN MANUFACTURING PRIVATE LIMITED COMPANIES (PLCs)
DR. FISSEHA GIRMAY TESSEMA
1
2. TECHNICAL EFFICIENCY ANALYSIS AND INFLUENCE OF SUBSIDIES ON THE TECHNICAL EFFICIENCY OF FARMS IN THE SLOVAK REPUBLIC DR. ING. ANDREJ JAHNÁTEK, DR. ING. JANA MIKLOVIČOVÁ & ING. SILVIA MIKLOVIČOVÁ
10
3. A COMPARISON OF DATA MINING TECHNIQUES FOR GOING CONCERN PREDICTION FEZEH ZAHEDI FARD & MAHDI SALEHI
14
4. DETERMINANTS OF CONSTRAINTS TO LOW PROVISION OF LIVESTOCK INSURANCE IN KENYA: A CASE STUDY OF NAKURU COUNTY THOMAS MOCHOGE MOTINDI, NEBAT GALO MUGENDA & HENRY KIMATHI MUKARIA
20
5. PERCEPTIONS OF ACCOUNTANTS ON FACTORS AFFECTING AUDITOR’S INDEPENDENCE IN NIGERIA AKINYOMI OLADELE JOHN & TASIE, CHUKWUMERIJE
25
6. AN ASSESSMENT OF MARKET SUSTAINABILITY OF PRIVATE SECTOR HOUSING PROJECT FINANCING OPTIONS IN NIGERIA I.S. YESUFU, O.I. BEJIDE, F.E. UWADIA & S.I. YESUFU
30
7. AN EXPLORATORY STUDY ON THE PERCEPTION OF CUSTOMERS TOWARDS THE ROLE OF MOBILE BANKING, AND ITS EFFECT ON QUALITY OF SERVICE DELIVERY, IN THE RWANDAN BANKING INDUSTRY
MACHOGU MORONGE ABIUD, LYNET OKIKO & VICTORIA KADONDI
35
8. BUSINESS PROCESS REENGINEERING AND ORGANIZATIONAL PERFORMANCE C. S. RAMANIGOPAL, G. PALANIAPPAN, N.HEMALATHA & M. MANICKAM
41
9. CUSTOMER PERCEPTION OF REAL ESTATE SECTOR IN INDIA: A CASE STUDY OF UNORGANISED PROPERTY ADVISORS IN PUNJAB-INDIA DR. JASKARAN SINGH DHILLON & B. J. S. LUBANA
46
10. INNOVATIVE TECHNOLOGY AND PRIVATE SECTOR BANKS: A STUDY OF SELECTED PRIVATE SECTOR BANKS OF ANAND DISTRICT POOJARA J.G. & CHRISTIAN S.R.
51
11. THE PROBLEMS AND PERFORMANCE OF HANDLOOM COOPERATIVE SOCIETIES WITH REFERENCE TO ANDHRA PRADESH INDIA DR. R. EMMANIEL
54
12. IMPACT OF GENDER AND TASK CONDITIONS ON TEAMS: A STUDY OF INDIAN PROFESSIONALS DEEPIKA TIWARI & AJEYA JHA
58
13. MOTIVATIONAL PREFERENCES OF TEACHERS WORKING IN PRIVATE ENGINEERING INSTITUTIONS IN WESTERN INDIA REGION: AN EXPLORATORY STUDY
DD MUNDHRA & WALLACE JACOB
68
14. CHANNEL MANAGEMENT IN INSURANCE BUSINESS DR. C BHANU KIRAN & DR. M. MUTYALU NAIDU
74
15. MANAGEMENT INFORMATION SYSTEM APPLIED TO MECHANICAL DEPARTMENT OF AN ENGINEERING COLLEGE C.G. RAMACHANDRA & DR. T. R. SRINIVAS
78
16. A STUDY ON THE PERCEPTIONS OF EMPLOYEES ON LEADERSHIP CONCEPTS AND CONSTRUCTS IN LIC H. HEMA LAKSHMI, P. R. SIVASANKAR & DASARI.PANDURANGARAO
83
17. TEXTURE FEATURE EXTRACTION
GANESH S. RAGHTATE & DR. S. S. SALANKAR
87
18. INDIAN BANKS: AN IMMENSE DEVELOPING SECTOR PRASHANT VIJAYSING PATIL & DR. DEVENDRASING V. THAKOR
91
19. DEVALUATION OF INDIAN RUPEE & ITS IMPACT ON INDIAN ECONOMY DR. NARENDRA KUMAR BATRA, DHEERAJ GANDHI & BHARAT KUMAR
95
20. SERVICE PRODUCTIVITY: CONCERNS, CHALLENGES, AND RESEARCH DIRECTIONS DR. SUNIL C. D’SOUZA
99
21. A STUDY OF THE MANAGERIAL STYLES OF EXECUTIVES IN THE MANUFACTURING COMPANIES OF PUNJAB DR. NAVPREET SINGH SIDHU
105
22. FINANCIAL LEVERAGE AND IT’S IMPACT ON COST OF CAPITAL AND CAPITAL STRUCTURE SHASHANK JAIN, SHIVANGI GUPTA & HAMENDRA KUMAR PORWAL
112
23. REACH OF INTERNET BANKING DR. A. JAYAKUMAR & G.ANBALAGAN.
118
24. THE PROPOSED GOODS AND SERVICE TAX REGIME: AN ANALYSIS OF THE DIFFERENT MODELS TO SELECT A SUITABLE MODEL FOR INDIA ASHISH TIWARI & VINAYAK GUPTA
122
25. ESTIMATION OF STOCK OPTION PRICES USING BLACK-SCHOLES MODEL DR. S. SARAVANAN & G. PRADEEP KUMAR
130
26. MIS AND MANAGEMENT
DR.PULI.SUBRMANYAM & S.ISMAIL BASHA
137
27. REFORMS IN INDIAN FINANCIAL SYSTEM: A CONCEPTUAL APPROACH PRAVEEN KUMAR SINHA
147
28. NATURAL RUBBER PRODUCTION IN INDIA DR. P. CHENNAKRISHNAN
151
29. QUALITY IMPROVEMENT IN FREE AND OPEN SOURCE SOFTWARE PROJECTS DR. SHAIK MAHABOOB BASHA
157
30. ICT & PRODUCTIVITY AND GROWTH BUSINESS: NEW RESULTS BASED ON INTERNATIONAL MICRODATA VAHID RANGRIZ
160
CHIEF PATRON
CHIEF PATRON
CHIEF PATRON
CHIEF PATRON
PROF. K. K. AGGARWAL
Chancellor, Lingaya’s University, Delhi
Founder Vice-Chancellor, Guru Gobind Singh Indraprastha University, Delhi
Ex. Pro Vice-Chancellor, Guru Jambheshwar University, Hisar
FOUNDER
FOUNDER
FOUNDER
FOUNDER PATRON
PATRON
PATRON
PATRON
LATE SH. RAM BHAJAN AGGARWAL
Former State Minister for Home & Tourism, Government of Haryana
Former Vice-President, Dadri Education Society, Charkhi Dadri
Former President, Chinar Syntex Ltd. (Textile Mills), Bhiwani
CO
CO
CO
CO----ORDINATOR
ORDINATOR
ORDINATOR
ORDINATOR
AMITA
Faculty, Government M. S., Mohali
ADVISORS
ADVISORS
ADVISORS
ADVISORS
DR. PRIYA RANJAN TRIVEDI
Chancellor, The Global Open University, Nagaland
PROF. M. S. SENAM RAJU
Director A. C. D., School of Management Studies, I.G.N.O.U., New Delhi
PROF. M. N. SHARMA
Chairman, M.B.A., Haryana College of Technology & Management, Kaithal
PROF. S. L. MAHANDRU
Principal (Retd.), Maharaja Agrasen College, Jagadhri
EDITOR
EDITOR
EDITOR
EDITOR
PROF. R. K. SHARMA
Professor, Bharti Vidyapeeth University Institute of Management & Research, New Delhi
CO
CO
CO
CO----EDITOR
EDITOR
EDITOR
EDITOR
DR. BHAVET
Faculty, M. M. Institute of Management, Maharishi Markandeshwar University, Mullana, Ambala, Haryana
EDITORIAL
EDITORIAL
EDITORIAL
EDITORIAL ADVISORY BOARD
ADVISORY BOARD
ADVISORY BOARD
ADVISORY BOARD
DR. RAJESH MODI
Faculty, Yanbu Industrial College, Kingdom of Saudi Arabia
PROF. SANJIV MITTAL
University School of Management Studies, Guru Gobind Singh I. P. University, Delhi
PROF. ANIL K. SAINI
Chairperson (CRC), Guru Gobind Singh I. P. University, Delhi
DR. SAMBHAVNA
Faculty, I.I.T.M., Delhi
DR. MOHENDER KUMAR GUPTA
VOLUME NO.2(2012),ISSUE NO.11(NOVEMBER) ISSN 2231-5756
INTERNATIONAL JOURNAL OF RESEARCH IN COMMERCE, IT & MANAGEMENT
DR. SHIVAKUMAR DEENE
Asst. Professor, Dept. of Commerce, School of Business Studies, Central University of Karnataka, Gulbarga
DR. MOHITA
Faculty, Yamuna Institute of Engineering & Technology, Village Gadholi, P. O. Gadhola, Yamunanagar
ASSOCIATE EDITORS
ASSOCIATE EDITORS
ASSOCIATE EDITORS
ASSOCIATE EDITORS
PROF. NAWAB ALI KHAN
Department of Commerce, Aligarh Muslim University, Aligarh, U.P.
PROF. ABHAY BANSAL
Head, Department of Information Technology, Amity School of Engineering & Technology, Amity University, Noida
PROF. A. SURYANARAYANA
Department of Business Management, Osmania University, Hyderabad
DR. SAMBHAV GARG
Faculty, M. M. Institute of Management, Maharishi Markandeshwar University, Mullana, Ambala, Haryana
PROF. V. SELVAM
SSL, VIT University, Vellore
DR. PARDEEP AHLAWAT
Associate Professor, Institute of Management Studies & Research, Maharshi Dayanand University, Rohtak
DR. S. TABASSUM SULTANA
Associate Professor, Department of Business Management, Matrusri Institute of P.G. Studies, Hyderabad
SURJEET SINGH
Asst. Professor, Department of Computer Science, G. M. N. (P.G.) College, Ambala Cantt.
TECHNICAL ADVISOR
TECHNICAL ADVISOR
TECHNICAL ADVISOR
TECHNICAL ADVISOR
AMITA
Faculty, Government H. S., Mohali
DR. MOHITA
Faculty, Yamuna Institute of Engineering & Technology, Village Gadholi, P. O. Gadhola, Yamunanagar
FINANCIAL ADVISORS
FINANCIAL ADVISORS
FINANCIAL ADVISORS
FINANCIAL ADVISORS
DICKIN GOYAL
Advocate & Tax Adviser, Panchkula
NEENA
Investment Consultant, Chambaghat, Solan, Himachal Pradesh
LEGAL
LEGAL
LEGAL
LEGAL ADVISORS
ADVISORS
ADVISORS
ADVISORS
JITENDER S. CHAHAL
Advocate, Punjab & Haryana High Court, Chandigarh U.T.
CHANDER BHUSHAN SHARMA
Advocate & Consultant, District Courts, Yamunanagar at Jagadhri
SUPERINTENDENT
SUPERINTENDENT
SUPERINTENDENT
SUPERINTENDENT
SURENDER KUMAR POONIA
CALL FOR MANUSCRIPTS
CALL FOR MANUSCRIPTS
CALL FOR MANUSCRIPTS
CALL FOR MANUSCRIPTS
Weinvite unpublished novel, original, empirical and high quality research work pertaining to recent developments & practices in the area of
Computer, Business, Finance, Marketing, Human Resource Management, General Management, Banking, Insurance, Corporate Governance and emerging paradigms in allied subjects like Accounting Education; Accounting Information Systems; Accounting Theory & Practice; Auditing; Behavioral Accounting; Behavioral Economics; Corporate Finance; Cost Accounting; Econometrics; Economic Development; Economic History; Financial Institutions & Markets; Financial Services; Fiscal Policy; Government & Non Profit Accounting; Industrial Organization; International Economics & Trade; International Finance; Macro Economics; Micro Economics; Monetary Policy; Portfolio & Security Analysis; Public Policy Economics; Real Estate; Regional Economics; Tax Accounting; Advertising & Promotion Management; Business Education; Management Information Systems (MIS); Business Law, Public Responsibility & Ethics; Communication; Direct Marketing; E-Commerce; Global Business; Health Care Administration; Labor Relations & Human Resource Management; Marketing Research; Marketing Theory & Applications; Non-Profit Organizations; Office Administration/Management; Operations Research/Statistics; Organizational Behavior & Theory; Organizational Development; Production/Operations; Public Administration; Purchasing/Materials Management; Retailing; Sales/Selling; Services; Small Business Entrepreneurship; Strategic Management Policy; Technology/Innovation; Tourism, Hospitality & Leisure; Transportation/Physical Distribution; Algorithms; Artificial Intelligence; Compilers & Translation; Computer Aided Design (CAD); Computer Aided Manufacturing; Computer Graphics; Computer Organization & Architecture; Database Structures & Systems; Digital Logic; Discrete Structures; Internet; Management Information Systems; Modeling & Simulation; Multimedia; Neural Systems/Neural Networks; Numerical Analysis/Scientific Computing; Object Oriented Programming; Operating Systems; Programming Languages; Robotics; Symbolic & Formal Logic and Web Design. The above mentioned tracks are only indicative, and not exhaustive.
Anybody can submit the soft copy of his/her manuscript anytime in M.S. Word format after preparing the same as per our submission
guidelines duly available on our website under the heading guidelines for submission, at the email address: [email protected].
GUIDELINES FOR SUBM
GUIDELINES FOR SUBM
GUIDELINES FOR SUBM
GUIDELINES FOR SUBMISSION OF MANUSCRIPT
ISSION OF MANUSCRIPT
ISSION OF MANUSCRIPT
ISSION OF MANUSCRIPT
1. COVERING LETTER FOR SUBMISSION:
DATED: _____________ THE EDITOR
IJRCM
Subject: SUBMISSION OF MANUSCRIPT IN THE AREA OF .
(e.g. Finance/Marketing/HRM/General Management/Economics/Psychology/Law/Computer/IT/Engineering/Mathematics/other, please specify)
DEAR SIR/MADAM
Please find my submission of manuscript entitled ‘___________________________________________’ for possible publication in your journals.
I hereby affirm that the contents of this manuscript are original. Furthermore, it has neither been published elsewhere in any language fully or partly, nor is it under review for publication elsewhere.
I affirm that all the author (s) have seen and agreed to the submitted version of the manuscript and their inclusion of name (s) as co-author (s).
Also, if my/our manuscript is accepted, I/We agree to comply with the formalities as given on the website of the journal & you are free to publish our contribution in any of your journals.
NAME OF CORRESPONDING AUTHOR: Designation:
Affiliation with full address, contact numbers & Pin Code: Residential address with Pin Code:
Mobile Number (s): Landline Number (s): E-mail Address: Alternate E-mail Address:
NOTES:
a) The whole manuscript is required to be in ONE MS WORD FILE only (pdf. version is liable to be rejected without any consideration), which will start from the covering letter, inside the manuscript.
b) The sender is required to mention the following in the SUBJECT COLUMN of the mail:
New Manuscript for Review in the area of (Finance/Marketing/HRM/General Management/Economics/Psychology/Law/Computer/IT/ Engineering/Mathematics/other, please specify)
c) There is no need to give any text in the body of mail, except the cases where the author wishes to give any specific message w.r.t. to the manuscript. d) The total size of the file containing the manuscript is required to be below 500 KB.
e) Abstract alone will not be considered for review, and the author is required to submit the complete manuscript in the first instance.
f) The journal gives acknowledgement w.r.t. the receipt of every email and in case of non-receipt of acknowledgment from the journal, w.r.t. the submission of manuscript, within two days of submission, the corresponding author is required to demand for the same by sending separate mail to the journal. 2. MANUSCRIPT TITLE: The title of the paper should be in a 12 point Calibri Font. It should be bold typed, centered and fully capitalised.
3. AUTHOR NAME (S) & AFFILIATIONS: The author (s) full name, designation, affiliation (s), address, mobile/landline numbers, and email/alternate email address should be in italic & 11-point Calibri Font. It must be centered underneath the title.
VOLUME NO.2(2012),ISSUE NO.11(NOVEMBER) ISSN 2231-5756
INTERNATIONAL JOURNAL OF RESEARCH IN COMMERCE, IT & MANAGEMENT
5. KEYWORDS: Abstract must be followed by a list of keywords, subject to the maximum of five. These should be arranged in alphabetic order separated by commas and full stops at the end.
6. MANUSCRIPT: Manuscript must be in BRITISH ENGLISH prepared on a standard A4 size PORTRAIT SETTING PAPER. It must be prepared on a single space and single column with 1” margin set for top, bottom, left and right. It should be typed in 8 point Calibri Font with page numbers at the bottom and centre of every page. It should be free from grammatical, spelling and punctuation errors and must be thoroughly edited.
7. HEADINGS: All the headings should be in a 10 point Calibri Font. These must be bold-faced, aligned left and fully capitalised. Leave a blank line before each heading.
8. SUB-HEADINGS: All the sub-headings should be in a 8 point Calibri Font. These must be bold-faced, aligned left and fully capitalised. 9. MAIN TEXT: The main text should follow the following sequence:
INTRODUCTION
REVIEW OF LITERATURE
NEED/IMPORTANCE OF THE STUDY
STATEMENT OF THE PROBLEM
OBJECTIVES
HYPOTHESES
RESEARCH METHODOLOGY
RESULTS & DISCUSSION
FINDINGS
RECOMMENDATIONS/SUGGESTIONS
CONCLUSIONS
SCOPE FOR FURTHER RESEARCH
ACKNOWLEDGMENTS
REFERENCES
APPENDIX/ANNEXURE
It should be in a 8 point Calibri Font, single spaced and justified. The manuscript should preferably not exceed 5000 WORDS.
10. FIGURES & TABLES: These should be simple, crystal clear, centered, separately numbered & self explained, and titles must be above the table/figure. Sources of data should be mentioned below the table/figure. It should be ensured that the tables/figures are referred to from the main text.
11. EQUATIONS: These should be consecutively numbered in parentheses, horizontally centered with equation number placed at the right.
12. REFERENCES: The list of all references should be alphabetically arranged. The author (s) should mention only the actually utilised references in the preparation of manuscript and they are supposed to follow Harvard Style of Referencing. The author (s) are supposed to follow the references as per the following:
•
All works cited in the text (including sources for tables and figures) should be listed alphabetically.•
Use (ed.) for one editor, and (ed.s) for multiple editors.•
When listing two or more works by one author, use --- (20xx), such as after Kohl (1997), use --- (2001), etc, in chronologically ascending order.•
Indicate (opening and closing) page numbers for articles in journals and for chapters in books.•
The title of books and journals should be in italics. Double quotation marks are used for titles of journal articles, book chapters, dissertations, reports, working papers, unpublished material, etc.•
For titles in a language other than English, provide an English translation in parentheses.•
The location of endnotes within the text should be indicated by superscript numbers.PLEASE USE THE FOLLOWING FOR STYLE AND PUNCTUATION IN REFERENCES: BOOKS
•
Bowersox, Donald J., Closs, David J., (1996), "Logistical Management." Tata McGraw, Hill, New Delhi.•
Hunker, H.L. and A.J. Wright (1963), "Factors of Industrial Location in Ohio" Ohio State University, Nigeria.CONTRIBUTIONS TO BOOKS
•
Sharma T., Kwatra, G. (2008) Effectiveness of Social Advertising: A Study of Selected Campaigns, Corporate Social Responsibility, Edited by David Crowther & Nicholas Capaldi, Ashgate Research Companion to Corporate Social Responsibility, Chapter 15, pp 287-303.JOURNAL AND OTHER ARTICLES
•
Schemenner, R.W., Huber, J.C. and Cook, R.L. (1987), "Geographic Differences and the Location of New Manufacturing Facilities," Journal of Urban Economics, Vol. 21, No. 1, pp. 83-104.CONFERENCE PAPERS
•
Garg, Sambhav (2011): "Business Ethics" Paper presented at the Annual International Conference for the All India Management Association, New Delhi, India, 19–22 June.UNPUBLISHED DISSERTATIONS AND THESES
•
Kumar S. (2011): "Customer Value: A Comparative Study of Rural and Urban Customers," Thesis, Kurukshetra University, Kurukshetra.ONLINE RESOURCES
•
Always indicate the date that the source was accessed, as online resources are frequently updated or removed.WEBSITES
TEXTURE FEATURE EXTRACTION
GANESH S. RAGHTATE
RESEARCH SCHOLAR
RASTRASANT TUKDOJI MAHARAJ NAGPUR UNIVERSITY
NAGPUR
DR. S. S. SALANKAR
PROFESSOR
RASTRASANT TUKDOJI MAHARAJ NAGPUR UNIVERSITY
NAGPUR
ABSTRACT
A feature is nothing but the significant representative of an image which can be used for classification, since it has a property which distinguishes one class from other. The extracted features provide the characteristics of input pixel to the classifier. Feature extraction is used in various pattern recognition applications. This paper aims to compile the recent trends on the usage of feature extraction methods used in the research of texture classification. The study shows that the signal processing methods, such as Gabor filters and wavelets are gaining popularity but old methods such as GLCM are still used but are improved with new calculations or combined with other methods.
KEYWORDS
Computer Vision, Feature extraction, Machine Learning, Pattern Recognition, Texture Classification.
1.
INTRODUCTION
eature extraction is the process to obtain different features from the given images. It is used in texture classification has a large variety of real world problems involving specific textures of different objects. Some of the real world applications that involve textured objects of surfaces include rock classification , wood species recognition, face detection, fabric classification, geographical landscape segmentation and etc. Texture classification techniques are grouped up in five main groups in general, namely 1) structural; 2) statistical; 3) signal processing; 4) model-based stochastic, and; 5) morphology-based methods.
Out of the five groups, statistical and signal processing methods are the most widely used because they can be directly applied onto any type of texture. The rest are not as widely used because the structural methods need to implemented on structured textures which are naturally rare, the model based stochastic methods are not easily implemented due to the complexity to estimate the parameters and morphology-based methods are relatively new and the process are very simple, they may not promise very good textural features. This paper describes the recent trends in feature extraction methods used in the research of texture classification.
2.
FEATURE EXTRACTION METHODS
There are many different feature extraction methods that were introduced and used for texture classification problems. Most of these methods that were popularly used in recent years were statistical and signal processing methods.
2.1. GRAY LEVEL CO-OCCURRENCE MATRIX (GLCM)
This method was first proposed by Haralick in 1973 and still is one of the most popular means of texture analysis [10].The key concept of this method is generating features based on gray level co – occurrence matrices (GLCM). The matrices are designed to measure the special relationships between pixels. The method is based on the belief that texture information is contained in such relationships.
Co – occurrence features are obtained from a gray level co – occurrence matrix M, which keeps co – occurrence frequencies of pairs of gray intensity. The matrix M has the parameters d, θ. The value of element (i, j) in M is the frequency with which a pixel (x, y) in gray tone I has a pixel (x’, y’) in gray tone j in distance d. The angle between the two pixels is θ. It can be described as [10]:
M i, j = # {((x, y), (x’, y’)) Є (Lx × Ly)× (Lx × Ly) │ (1)
║(x, y) - (x’, y’) ║ = d, arctg ( ) = θ} (2)
Lx = {1, 2, ……, W}, Ly = {1, 2, ……, H} (3)
Where # denotes the number of elements in the set, Lx and Ly denote the horizontal and vertical spatial domain and W and H are the width and height of the
image. Normally, θ is quantized in four directions (00, 450, 900 and 1350) [1].
Once the matrix is calculated, fourteen different categories of Haralick features are extracted at angle θ and distance d.
They are 1)Angular second moment, 2) Contrast, 3) Correlation, 4) Variance, 5) Inverse difference moment, 6) Sum average, 7) Sum variance, 8) Sum entropy, 9) Entropy, 10) Difference variance, 11) Difference entropy, 12) and 13) two information measures of correlation and 14) Maximal correlation coefficient[10]. These features have been widely used in machine vision, for example in remote sensing, document image understanding and image database retrieval. The first feature “ Angular second moment” measures textural uniformity, the second feature contrast implies the special frequency of textures and the third feature Correlation describes gray tone linear dependency which is a way to describe texture homogeneity.
In texture analysis community, this method is known by several names, including Co – occurrence measures, Gray Level Co – occurrence Matrices (GLCM), Spatial Gray Level Dependence Matrices (SGLDM) and the Harlick method.
2.2. LOCAL BINARY PATTERNS (LBP)
The idea of LBP (local binary pattern) is originally proposed by Ojala et al. in [15] for the aim of texture classification, and then extended for various fields, including face recognition, face detection, facial expression recognition etc. The most attractive advantages of LBP are its invariance to monotonic gray-scale changes, low computational complexity and convenient multi-scale extension. The philosophy behind LBP is simple and elegant: unify statistical and traditional structural methods.
VOLUME NO.2(2012),ISSUE NO.11(NOVEMBER) ISSN 2231-5756
INTERNATIONAL JOURNAL OF RESEARCH IN COMMERCE, IT & MANAGEMENT
FIGURE 1. ILLUSTRATION OF LBP. TYPICALLY THE BINARY CODES OBTAINED BY LOCAL THRESHOLDING ARE TRANSFORMED INTO DECIMAL CODES. NOTE THATIN THIS EXAMPLE WE USE A THRESHOLD OF 30, WHICH IS SLIGHTLY DIFFERENT FROM THE ORIGINAL LBP. SEE TEXT FOR MORE DETAILS
In Figure 1, we give an illustration for how LBP serves as local descriptor. Each neighbor pixel is compared with the center pixel, and the ones whose intensities exceed the center pixel’s are marked as”1”, otherwise as”0”. In this way we get a simple circular point features consisting of only binary bits. Typically the feature ring is unfolded as a row vector; and then with a binomial weight assigned to each bit, the row vector is transformed into decimal code for further use.
For clarity, we adopt the same notation LBPP, R as in [14], where R is the radius of the circle to be sampled (see Figure 2), and P is the number of sampling points.
Examples for various choices of these two parameters can be found in Figure 2. It is obvious to see that LBP can be effortlessly extended to the multi-scale case.
Denote the ring feature for image pixel (x, y) as B(x, y)=< bP−1, . . . , b1, b0 >, where bi є {0, 1}. It is common to transform B(x, y) into decimal code via binomial
weighting:
LBP P, R (x,׀y) = ∑ 2 (4)
which characterizes image textures over neighborhood of (x, y). And a 1D histogram for a target image region can be built by counting the frequencies of each
value of LBP codes, which is finally normalized with L1-norm or L2-norm as image region representation.
An important special case of LBP is the uniform LBP. A LBP descriptor is called uniform if and only if at most two bitwise transition between 0 and 1 over the circulated binary feature. For example, 00000000 (0 transition), 11100011 (2 transitions) are uniform, while 01010000 (4 transitions), 01110101 (6 transitions) are non-uniform ones. An important observation was made by Ojala et al. [15] that in texture images, majority of LBP features can be categorized to be uniform. In practice, all non-uniform LBP are labeled with a single label, while each uniform LBP is cast into a unique histogram bin according to its decimal value.
FIGURE 2: MULTI - SCALE LBP. R: RADIUS OF SAMPLING CIRCLE. P: NUMBER OF SAMPLING PIXELS.
2.3. GABOR FILTERS
In 1946 Dennis Gabor proposed a method to represent signals in both the time and frequency domains. Unlike the Fourier series, this method allows the analysis of local information rather than just global information. However Gabor’s analysis method went almost unnoticed until the early 1980’s. It was proposed as a texture analysis method by Turner [6] and Clark et al. [17] in the middle 80’s.
A Gabor filter is a harmonic oscillator, composed of a sinusoidal plane wave of a particular frequency and orientation with a Gaussian kernel [3]:
Ψ (x, y; σ, u, v) = {exp –( ) ( + )} exp ( + ! ) (5)
Where (x, y) are the variables representing position in the spatial domain, (u, v) are the spatial frequencies and σ is the width of the Gaussian. The Gabor
transform, G (u, v), of an image fragment, I(x, y), is defined as the convolution of a Gabor kernel ψ with I:
G (u, v) = ∫ ∫ ψ (x, y; σ, u, v) I (x, y) dx dy (6)
The Gabor filter is frequency and orientation selective. The orientation of the filter, which is defined as θ = tan - 1 v / u
and the size of image fragments are adjustable. The Gabor features are generated from filtered images proposed by a Gabor filter at a certain size and a certain angle, for example the energy or variance of the filtered images. Gabor filters have been applied in various domains in machine vision, such as texture analysis, face recognition and handwriting recognition. Gabor filters are considered a powerful analysis tool.
2.4. WAVELET TRANSFORM
Wavelet transform is a type of signal representation that can give the frequency content of the signal at a particular instant of time. In this context, one row/column of image pixels can be considered as a signal. Applying a wavelet transform on such a signal decomposes the signal into different frequency sub-bands (for example, high frequency and low frequency sub-sub-bands). Initially, regions of similar texture need to be separated out. This may be achieved by decomposing the image in the frequency domain into a full sub-band tree using filter banks [9]. Each of the sub-bands obtained after filtering has uniform texture information. A filter bank based on wavelets could be used to decompose the image into low-pass and high-pass spatial-frequency bands [12].
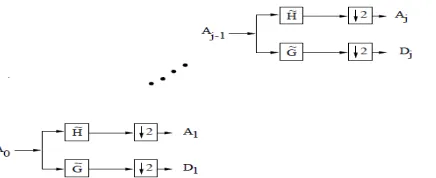
We will now briefly review the wavelet-based multi-resolution decomposition. To have the multi-resolution representation of signals we can use a discrete
wavelet transform. We can compute a coarser approximation of input signal A0 by convolving it with the low pass filter H and down sampling the signal by two
[13]. By down sampling, we mean skipping every other signal sample (for example a pixel in an image). All the discrete approximations Aj , 1 < j < J, (J is the
FIGURE 3: BLOCK DIAGRAM OF MULTI-RESOLUTION WAVELET TRANSFORM
We can extract the difference of information between the approximation of signal at scale j -1 and j. Dj denotes this difference of information and is called detail
signal at the scale j. We can compute the detail signal Dj by convolving Aj-1 with the high pass filter G and returning every other sample of output. The wavelet
representation of a discrete signal A0 can therefore be computed by successively decomposing Aj into Aj+1 and Dj+1 for 0 ≤j < J. This representation provides
information about signal approximation and detail signals at different scales. We denote wavelet representation of signal A0after K levels as {Ak , Dk , Dk – 1 , ….,
D1}, 1 ≤ k ≤j. The idea of using multi-resolution property of wavelets in clustering is to use the features of the wavelet coefficients at the coarse scale levels.
Corresponding to the lowpass filter, there is a continuous-time scaling function ø (t), and corresponding to the highpass filter, there is a wavelet ω (t). The
dilation equation produces ø (t), and the wavelet equation produces ω (t) [4]. For example, for Haar wavelet transform with H = [1/√2, 1/√2], and G = [1/√2,
-1/√2], the dilation equation is,
ø (t) = ø (2t) + ø (2t - 1) (7) and the wavelet equation is
ω (t) = ø (2t) - ø (2t - 1) (8)
Figure 4 shows the Haar wavelet ω (t).
FIGURE 4: THE HAAR WAVELET Ω (T)
We can easily generalize wavelet model to 2 dimensions for images, in which we can apply 2 separate one-dimensional transforms [5]. The image is first filtered
along the horizontal (x) dimension, resulting in a lowpass image L and a highpass image H. We then down sample each of the filtered images in the x dimension
by 2. Both L and H are then filtered along the vertical (y) dimension, resulting in four subimages : LL, LH, HL, and HH. Once again, we down sample the subimages
by 2, this time along the y dimension. The two-dimensional filtering decomposes an image into an average signal (LL) and three detail signals which are
directionally sensitive: LH emphasizes the horizontal image features, HL the vertical features, and HH the diagonal features.
Figure 5-a show a sample airphoto image. Figures 5- b, c, and d show the wavelet representation of the image at three scales from fine to coarse. At each level,
sub-band LL (the wavelet approximation of the original image) is shown in the upper left quadrant. Sub-band LH (horizontal edges) is shown in the upper right
quadrant, sub-band HL (vertical edges) is displayed in the lower left quadrant, and sub-band HH (corners) is in the lower right quadrant.
Feature extraction and clustering methods can use any appropriate wavelet transforms such as Haar, Daubechies, Cohen-Daubechies-Feauveau or Gabor wavelet transforms
FIGURE 5: MULTI-RESOLUTION WAVELET REPRESENTATION OF AN AIR PHOTO IMAGE: A) ORIGINAL IMAGE; B) WAVELET REPRESENTATION AT SCALE 1; C) WAVELET REPRESENTATION AT SCALE 2; D) WAVELET REPRESENTATION AT SCALE 3.
Applying wavelet transform on images results in wavelet coefficients corresponding to each sub-band. We can extract different features from wavelet coefficients of each of these sub-bands. Next subsection explains the features that we used in the experiments.
2.5. INDEPENDENT COMPONENT ANALYSIS
Assume a set of training images X = [x1, x2, · · ·, xn], where each column vector xi represents an image and the total number of training samples is n. The general
model of ICA can be described as follows:
X = AS (9)
where S = [s1, s2, · · ·, sn ] is the coefficient, A is a square mixing matrix and its column vectors are basis functions. The independent component analysis is to find a
separating matrix WI, so that
UI = WI X (10)
approximates the independent component S, possibly per muted and rescaled. The components of S are as mutual independent as possible.
Many methods have been proposed to learn the separating matrix WI. For example, Bell and Sejnowski [2] developed a simple learning algorithm based on the
information maximization, and it is improved by Amari [11] with a natural gradient method for better convergence. Their learning algorithm for WI can be
summarized as the following:
∆WI= (I + g(y) yT) WI
(11)
Where, y = WI X and g(y) = 1 –
"#$
Before the learning procedure, a preprocessing operation WP, known as whitening or sphering, is required for most ICA learning algorithms. The transformed
data is zero- mean, decorrelated data:
VOLUME NO.2(2012),ISSUE NO.11(NOVEMBER) ISSN 2231-5756
INTERNATIONAL JOURNAL OF RESEARCH IN COMMERCE, IT & MANAGEMENT
This transformation can be accomplished by eigen value decomposition. In fact, when WP= % /V T, the Eq.(4) can be satisfied. Here, Λ and V are the eigen
values matrix and eigenvectors matrix of the covariance matrix of X, respectively.
2.6. REGION COVARIANCE MATRIX
Region covariances were introduced by Tuzel et al. [16] as a novel region descriptor for object detection and classification. Given an image I, let φ define a
mapping function that extracts an n-dimensional feature vector zi from each pixel i ∈ I, such that
φ (I, xi, yi) = zi, (13)
where zi ∈ Rn, and (xi, yi) is the location of the ith
pixel. A given image region R is represented by the n×n covariance matrix CR of the feature vectors () }|+| of the
pixels in region R. Thus the region covariance descriptor is given by,
CR =
| +| ∑ () ,+)
|+| ()
,+)- (14)
where, µR is the mean vector,
µR =
|+|∑ )
|+| (15)
The feature vector z usually consists of color information (in some preferred color–space, usually RGB) and information about the first and higher order spatial
derivatives of the image intensity, depending on the application intended.
Although covariance matrices can be positive semi–definite in general, the covariance descriptors themselves are regularized by adding a small constant multiple
of the identity matrix, making them strictly positive definite. Thus, the region covariance descriptors belong to Sn
++, the space of n×n positive definite matrices
which forms a connected Riemannian manifold. Given two covariance matrices Ciand Cj, the Riemannian distance metric dgeo (Ci, Cj) gives the length of the
geodesic connecting these two points on this manifold. This is given by [7],
dgeo (Ci, Cj) = ||log (Ci-1/2 Cj Ci-1/2) || F
(16)
where log (·) represents the matrix logarithm and ||·|| F is the Frobenius norm. Many existing classification algorithms for region covariances use the geodesic
distance in a K-nearest-neighbor framework. The geodesic distance can also be used with a modified K-means algorithm for clustering.
Methods for fast computation of region covariances using integral images [8] enable the use of these compact features for many practical applications that demand real–time performance. For texture characterization, spatial derivatives are suitable features [16], whereas for face recognition, region covariances are constructed from outputs of a bank of Gabor filters. Covariance descriptors are used for probabilistic tracking using particle filtering, multi–object tracking using region covariances and particle filters, improve the classification accuracy, for pedestrian detection and semi- supervised clustering.
2.7. OTHER FEATURE EXTRACTIONS
There are many other feature extractions that are not popularly used in recent years which some are recently proposed, including model-based stochastic methods, e.g. fractals and Markov random field. Also includes some other methods, e.g. Sequential Approximation Error Curves (SAEC) , Basic Image Features, Spectral Correlation Function (SCF), Legendre Spectrum and Multiscale Blob Features (MBF).
3. CONCLUSION
It is easily noticeable that signal processing methods are very popularly used in the recent years, especially for Gabor filters and wavelets. Although these methods require more computation as they are examining the frequency domain, the accuracy obtained is good and usually outperform older and simpler techniques. The old technique like GLCM is however yet to be forgotten in the field of texture classification because it is one of the simplest textural feature which is old but is computationally inexpensive. It remains to be mainly used as a baseline algorithm for comparative studies especially when a new application of texture classification is experimented. The GLCM is however more commonly used in some improved or combined ways recently but none of these variants have grown into a major trend.
The major trend of the research today in terms of feature extraction for texture classification is accuracy- oriented, however usually the newer algorithms that promises better accuracy is much more complicated in its calculations and often sacrifices the speed of the algorithm. The signal processing methods for example is a relatively slow algorithm with a higher accuracy. The region covariance matrix is new in the area of texture classification. It has the potential to become the next trend due to its fast computations using integral images.
4. REFERENCES
1. Baraldi, F. Parmiggiani, “An Investigation Of The Textural Characteristics Associated With GLCM Matrix Statistical Parameters”, IEEE Trans. on Geos. and
Rem. Sens., vol. 33(2), pp. 293-304, 1995.
2. A.J.Bell and T.J.Sejnowski, ”An information maximization approach to blind separation and blind deconvolution”,Neural Computation, vol.7, pp.1129-1159,
1995.
3. Chen and D. C. Chen.Multi – resolutional Gabor filter in texture analysis. Pattern Recognition Letters, 23(7):755 – 771, May 2002.
4. Gilbert Strang and Truong Nguyen. Wavelets and Filter Banks. Wellesley-Cambridge Press, 1996.
5. Michael L. Hilton, Bjorn D. Jawerth, and Ayan Sengupta. Compressing Still and Moving Images with Wavelets. Multimedia Systems, 2(5):218 - 227,
December 1994.
6. M. R. Turner. Texture discrimination by Gabor functions. Biological Cybernetics, 55(2 - 3): 71 – 82, November 1986.
7. Pennec, X., Fillard, P., Ayache, N.: A Riemannian Framework for Tensor Computing. In: International Journal of Computer Vision 66(1), pp. 41-66 (2005)
8. Porikli, F., Tuzel, O.: Fast Construction of Covariance Matrices for Arbitrary Size Image Windows. In: Proceedings of IEEE International Conference on Image
Processing, pp. 1581-1584 (2006)
9. P. P. Vaidyanathan.Multirate Systems And Filter Banks. Prentice Hall Signal Processing Series. Prentice Hall, Englewood Clis, NJ, 1993.
10. R. M. Harlick, K. Shanmugam, and I. Dinstein. Texture features for image classification. IEEE Transactions On Systems, Man, and Cybernetics, SMC – 3 (6):
610 – 621, November 1973.
11. S.Amari, ”Natural gradient works efficiently in learning”,Neural Computation, 1998, 10(2), pp. 251-276.
12. S. Mallat. Multiresolution approximation and wavelet orthonormal bases of L2(R).Transactions of American Mathematical Society, 315:69- 87, September
1989.
13. S. Mallat. A theory for multiresolution signal decomposition: the wavelet representation.. IEEE Trnasactions on Pattern Analysis and Machine Intelligence,
11:674 - 693, July 1989.
14. T. Ahonen, A. Hadid, and M. Pietik¨ainen. Face recognition with local binary patterns. In ECCV (1), pages 469–481, 2004.
15. T. Ojala, M. Pietik¨ainen, and D. Harwood. A comparative study of texture measures with classification based on featured distributions. Pattern
Recognition, 29(1):51–59, 1996.
16. Tuzel, O., Porikli, F., Meer, P.: Region Covariance: A Fast Descriptor for Detection and Classification. In: Leonardis, A., Bischof, H., Pinz, A. (eds.) ECCV 2006.
LNCS, vol. 3952, pp. 697-704. Springer, Heidelberg (2006)
REQUEST FOR FEEDBACK
Dear Readers
At the very outset, International Journal of Research in Commerce, IT and Management (IJRCM)
acknowledges & appreciates your efforts in showing interest in our present issue under your kind perusal.
I would like to request you to supply your critical comments and suggestions about the material published
in this issue as well as on the journal as a whole, on our E-mail i.e.
for further
improvements in the interest of research.
If you have any queries please feel free to contact us on our E-mail
.
I am sure that your feedback and deliberations would make future issues better – a result of our joint
effort.
Looking forward an appropriate consideration.
With sincere regards
Thanking you profoundly
Academically yours
Sd/-
VOLUME NO.2(2012),ISSUE NO.11(NOVEMBER) ISSN 2231-5756