BEHAVIOR OF MODEL CIRCULAR FOOTINGS ON SILTY
SOILS WITH CELLULAR SUPPORTS
R. Gupta*
Department of Civil Engineering, Thapar University 147001, Patiala, India
rajeev.gupta@thapar.edu
A. Trivedi
Department of Civil Engineering, Delhi College of Engineering 110042, Delhi, India
prof.trivedi@yahoo.com
*Corresponding Author
(Received: April 14, 2009 – Accepted in Revised Form: November 5, 2009)
Abstract An experimental study of the effect of silt and influence of cell confinement on the bearing capacity of circular footings on silty sand was carried out. Laboratory experiments on clean sand and sand containing silt up to 25 % were performed. Cells with different heights and diameters were used to confine the silty sand. The effect of proportion of silt in sand, cell diameter, cell height and the embedded depth of footing were studied. Initially, the response of a footing without cellular support was determined and then compared with that of footing with cellular support. The results indicate that the bearing capacity of circular footing can be appreciably increased by soil confinement. It was interpreted that such confinement resists lateral displacement of soil underneath the footing. It leads to a significant improvement in the bearing capacity of the footing. The cell–soil footing behaves as one unit for small cell diameters, while this pattern was no longer observed with large diameter cells. Results of model-scale footing tests show that bearing capacity decreases with fines. It is due to fact that on the increase of silt while density increases but increase in compressibility offsets the effect of density. The cell height, depth, and diameter that give the maximum bearing capacity improvement are presented and discussed.
Keywords Silty Soil, Model Tests, Footings, Shallow Foundations, Bearing Capacity, Confinement
هﺪﻴﻜﭼ
ﺛﺎﺗ ﻴ ﺳﺮ ﻴﻓﺮﻇ ﺮﺑلﻮﻠﺳﻪﻈﻔﺤﻣوﺖﻠ
ﻴ
ﺎﭘﻞﻤﺤﺗﺖ
ﻳ ﻪ ﺎﻫ ي
ﺳﻪﺳﺎﻣروﺪﻣ
ﻴ ﺘﻠ ﻲ ﺳرﺮﺑ ﻲ ﺪﺷ . ﺎﻣزآ ﻳ ﺶ ﺎﻫ ﺮﺑ ور ي ﻤﺗﻪﺳﺎﻣ ﻴ
وﺎﺣﻪﺳﺎﻣوﺰ
ي ﺎﺗ 25 % ﺳ ﻴ
ﺪﺷمﺎﺠﻧاﺖﻠ
.
لﻮﻠﺳ ﺎﻫ ﻲﻳ
وعﺎﻔﺗراﺎﺑ
اﺮﺑتوﺎﻔﺘﻣﺮﻄﻗ
ي ندﺮﻛسﻮﺒﺤﻣ ﺳ ﻪﺳﺎﻣ ﻴ ﺘﻠ ﻲ ﺪﺷهدﺎﻔﺘﺳا . ﺛﺎﺗ ﻴ
ﺳ ﺖﺒﺴﻧﺮ
ﻴ
عﺎﻔﺗراوﺮﻄﻗ،ﻪﺳﺎﻣردﺖﻠ
ﺮﺘﺴﺑ ﻖﻤﻋو،لﻮﻠﺳ
ﭘﺎ ﻳ
راﺮﻗﻪﻌﻟﺎﻄﻣدرﻮﻣﻪ
ﺖﻓﺮﮔ
.
ﺦﺳﺎﭘاﺪﺘﺑارد
ﻳ
ﺎﭘﻚ
ﻳ
ﻜﺗنوﺪﺑﻪ
ﻴ ﻪ ﻟﻮﻠﺳهﺎﮔ ﻲ ﻌﺗ ﻴﻴ
ﺎﭘﺦﺳﺎﭘﺎﺑهﺎﮕﻧآوﺪﺷﻦ
ﻳ ارادﻪ ي ﻜﺗ ﻴ ﻪ ﻟﻮﻠﺳهﺎﮔ ﻲ ﺎﻘﻣ ﻳ ﻪﺴ ﺪﺷ . ﺎﺘﻧ ﻳ
ﻣنﺎﺸﻧﺞ
ﻲ
ﻣكﺎﺧندﺮﻛ سﻮﺒﺤﻣﺎﺑﻪﻛﺪﻫد
ﻲ
ﻓﺮﻇ ناﻮﺗ
ﻴ
ﺎﭘﻞﻤﺤﺗﺖ
ﻳ
ﻬﺟﻮﺗﻞﺑﺎﻗ راﺪﻘﻣﻪﺑارروﺪﻣ ﻪ
ﻲ اﺰﻓا ﻳ دادﺶ . ﺟﻮﺗ ﻴ اﻪ ﻳ
اﺮﻣاﻦ
ﻳ
ندﺮﻛسﻮﺒﺤﻣﻪﻛﺖﺳاﻦ
ﺖﻣوﺎﻘﻣﺚﻋﺎﺑ ﺮﺑاﺮﺑرد ﻪﺑﺎﺟ ﺎﺟ ﻲﻳ ﺒﻧﺎﺟ ﻲ زكﺎﺧ ﻳ ﺎﭘﺮ ﻳ ﻪ ﻣ ﻲ دﻮﺷ . اﻳ
ﻓﺮﻇردﻪﺟﻮﺗﻞﺑﺎﻗدﻮﺒﻬﺑﻪﺑﺮﻣاﻦ
ﻴ
ﺎﭘﻞﻤﺤﺗﺖ
ﻳ
ﻣﺮﺠﻨﻣﻪ
ﻲ دﻮﺷ . ﺎﭘ ﻳ ﻟﻮﻠﺳﻪ ﻲ
ناﻮﻨﻋﻪﺑكﺎﺧ
ﻳ ﺪﺣاوﻚ اﺮﺑ ي ﺎﻫﺮﻄﻗ ي
ﻣرﺎﺘﻓرﻚﭼﻮﻛلﻮﻠﺳ
ﻲ
ﻟﺎﺣرد،ﺪﻨﻛ
ﻲ
اﻪﻛ
ﻳ
لﻮﻠﺳردﻮﮕﻟاﻦ
ﺎﻫ ي ﺸﻣرﻮﻄﻗ ﺪﺸﻧهﺪﻫﺎ . ﺎﺘﻧ ﻳ ﺞ نﻮﻣزآ ﺎﻫ ي ﺎﭘ ﻳ ﻪ راﺬﮔ ي ﻣنﺎﺸﻧ ﻲ
ﻓﺮﻇ ﻪﻛ ﺪﻫد
ﻴ
اﺰﻓا ﺎﺑ ﻞﻤﺤﺗﺖ
ﻳ
ﻣ ﺶ
ﻴ
ر تارذ ناﺰ
ﻳ
ﻣﺶﻫﺎﻛ ﺰ
ﻲ ﻳ ﺪﺑﺎ
.
اﻳ
ﺷﺎﻧ ﺮﻣا ﻦ
ﻲ ا زا ﻳ ﻦ ﻌﻗاو ﻴ
ﻟﺎﺣ رد ﻪﻛﺖﺳا ﺖ
ﻲ
اﺰﻓاﺎﺑ ﻪﻛ
ﻳ ﺳ ﺶ ﻴ ﺴﻧادﺖﻠ ﻴ اﺰﻓاﻪﺘ ﻳ ﻣ ﺶ ﻲ ﻳ
اﺰﻓا ﺎﻣا ،ﺪﺑﺎ
ﻳ
ﻠﺑﺎﻗ رد ﺶ
ﻴ ﮔدﺮﺸﻓ ﺖ ﻲ ﺛﺎﺗ ﻴ ﺮ ﺴﻧاد ﻴ ارﻪﺘ ﺜﻨﺧ ﻲ ﻣ ﻲ ﺪﻨﻛ . ﻖﻤﻋ ،عﺎﻔﺗرا
ﺑ ﻪﻛلﻮﻠﺳﺮﻄﻗو
ﻴ ﺸ ﻴ اﺰﻓا ﻪﻨ ﻳ ﻓﺮﻇﺶ ﻴ
اارﻞﻤﺤﺗﺖ
ﻳ
ﻣدﺎﺠ
ﻲ
وﻪﺋارا ،ﺪﻨﻛ
ﻣراﺮﻗﺚﺤﺑدرﻮﻣ
ﻲ ﮔ ﻴ دﺮ . 1. INTRODUCTION
In the Indo-Gangetic planes, the Indian subcontinent has vast deposits of silty sands along the bank of perennial Himalayan Rivers namely Indus, Ghaggar,
systems, the sand and silt are coarse and fine grained granular materials. These are obtained in abundance as geological deposits in the earth crust. They occur with varied surface textures and shapes ranging from angular to spherical with moisture in void space. In modern times, some of the granular industrial byproducts deposited as structural fill with common range of specific gravity, unit weight and grain characteristics are often classified for sizes as sand and silts [2]. Over the past fifty years, there were intensive attempts to characterize sandy soil without fines [3-7]. However, there were scanty efforts to map the engineering behavior of silty sands. The authors observed that silty sands are largely found in earth crest in a low to medium density states with varied moisture. This material supports structural rafts and deep foundations for multistoried buildings, underground excavations, tunnels and pipeline. There is a need to characterize this granular media as an engineering material. There is a better understanding of the anticipated behavior of clean sand under undrained monotonic loading in terms of its initial state of stress, void ratio and state parameters. There is a mixed opinion in the literature on the role of fines on stress strain behavior of silty sand [8-10]. It is difficult to anticipate why the behavior of silty sand is contractile. The basis for deformations, whether silty sand would be contractile or dilative and what kind of stress strain behavior is to be expected compared with that of clean sand needs further explanation. The factor that controls the behavior of confined silty sands is a matter to be investigated. The natural sands contain varying amount of fines, whereas the current knowledge of its engineering behavior is primarily based on clean sands [11,12].
Further, the presence of fines in sand has an influence on the bearing capacity. The problem of bearing capacity of shallow foundations on granular soils has been studied for many years [3-7]. However, an accurate solution capable of predicting peak load carrying capacity for a wide range of soil relative densities, effective stress conditions and foundation shapes within a practical context remains elusive owing to the presence of fines.
The structural measures for foundations are widely used in weak soil conditions to support column loads. Sometimes the excavation needs to be braced during foundation construction. One of
the available solutions is to use side supports to the excavation during construction. Due to the problems associated with the removal of these supports, they are provided as part of the permanent structure. Accordingly it consists of two parts; it is to deal with the structural analysis of the footing if the side supports are used as end supports for the foundation [13]. Secondly, the effect of these supports on the lateral movement of the soil underneath the foundation is to be investigated as the effect of the lateral confinement on the bearing capacity of the silty sands. While there are several solutions for the first problem, such as isolating the foundation from the side supports but the effect of lateral confinement by these side supports on the foundation behavior is not well understood.
The experimental studies on bearing capacity of sands need to include the followings:
(I) Effect of proportion of fines on the bearing capacity of silty sands.
(II) Effect of confinement on the bearing capacity of silty sands
In order to investigate the effect of confinement on bearing capacity of circular footing, the cells were fabricated in the laboratory. These were made of mild steel plates of thickness of 0.94 mm and having different diameters. The cells were open at both the ends. It was modeled as a circular footing supported on a silty soil, which is surrounded by a mild steel cell having same soil outside. The tests were performed first without cells (un-confined case) below the footing and then with cells (confined case) and the results of ultimate bearing capacity are compared.
2. REVIEW OF PREVIOUS WORK
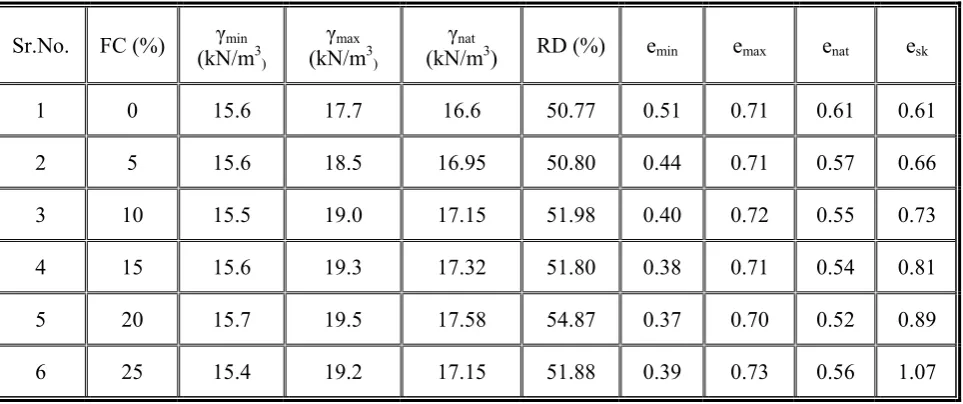
Lade, et al [15] explained the pattern of decreasing the maximum and minimum void ratios of silty sand with increasing fine content. With increasing percentage of fines in a dense or loose sand matrix, most silt particles initially occupy the voids among sand particles. This represents the reduction in void ratio with increasing the amount of fines. Some silt particles, however, end up between the surfaces of adjacent sand particles. Such particles would tend to cause an increase in void ratio, as they do not occupy the natural void space left by the sand matrix. This process pushes sand particles apart.
For a given overall void ratio, there is a fines content for which they completely (or almost completely) separate adjacent sand particles. An easy way to determine the fines content for which this happens is based on the concept of the skeleton void ratio esk given by Kuerbis, et al [14],
which is the void ratio of the silty sand calculated as if fines were voids
1 ) f 1 (
) e 1 ( sk
e −
− +
= (1)
Where e = overall void ratio of soil; and f = ratio of weight of fines to total weight of solids. Whenever esk is greater than the maximum void
ratio (emax)f=0 of clean sand, the sand matrix exists
with a void ratio higher than it could achieve in the absence of fines. It means that the sand particles are, on average, not in contact, and the mechanical behavior is no longer controlled by the sand matrix.
Sawwaf, et al [13] studied the effect of confinement on the bearing capacity of sand and have found an improvement in bearing capacity as high as 17 times as that without confinement. Rajagopal, et al [16] studied the strength of confined sand by carrying out a large number of triaxial compression tests to study the influence of geocell confinement on the strength and stiffness behavior of granular soils.
Rea, et al [17] conducted a series of model plate load tests on circular footings supported over sand filled square shaped paper grid cells to identify different modes of failure and arrive at optimum dimensions of the cell.
Dash, et al [18] conducted load tests on a strip footing on homogeneous dense sand (relative density of 70%) beds. They indicate that an 8-fold
increase in bearing capacity could be achieved with the provision of geocell in the foundation sand. Dash, et al [19] conducted the model test results on a circular footing supported on a dense sand layer (relative density of 70%) overlying a soft clay bed which showed about a 6-fold increase in bearing capacity with the provision of geocell in the overlying sand layer. The higher performance improvement due to geocell in the sand bed compared with that in the soft clay bed is attributed to the mobilization of higher passive force at the geocell walls and frictional resistance at the geogrid-soil surface.
The aim of present study is to model and investigate the effect of cell confinement in silty sands on the behavior of soil foundation system. This paper reports the results from a series of laboratory model tests carried out to determine the performance of a circular footing due to the provision of cell underlying clean sand and sand with increasing proportions of fine content. To achieve that objective, more than 61 model plate load tests were carried out with a wide range of variables. A summary of the experimental program is given in Tables 1a,b.
3. GRAIN SIZE AND SPECIFIC GRAVITY
The clean sand contains particle sizes in the range of coarse sand to fine sand shown in Figure 1. However, the maximum frequency of the particles is in the range of coarse sand to medium sand. The clean sand, which was examined for bearing capacity behavior, contains 60-65 % of particles in coarse and medium sand size, 30-35 % in fine sand size and 1-2 % of particles in the range of silt. Hydrometer analysis were also carried out on silt in order to plot grain size distribution curve as shown in Figure 1 along with clean sand.
4. MATERIALS AND METHODS
The study was conducted on clean sand which was used after washing. After washing sand contains 0 % fines and it was designated as clean sand. The specific gravity as determined by the pycnometer method as per IS: 2720 [20] was 2.67. The non plastic fines which passes through IS 75 μ sieve were used. The fines were prepared in the laboratory. Numbers of soil samples were taken from the near by area and then wet analysis was carried to know the percentage of particles passing
75 μ sieves. After processing, silt was finalized for the preparation of fines which had a maximum amount of particles passing 75 μ sieve. The wet analysis was carried on the selected soil samples. The material which passed through 75 μ was collected in a container and allowed to settle. Then the passing material is dried in the oven and pulverized. The pulverized material was again sieved though 75 μ sieve. Then the hydrometer analysis was carried out as per IS: 2720 [21] to know the amount of clay particles. The amount of clay particles was found insignificant. The specific TABLE 1(a). A Summary of Experimental Programme for Direct Shear Test.
Test Series FC (%) Normal Stress (kPa) No of Tests
A 0 50, 100, 150 03
B 5 50, 100, 150 03
C 10 50, 100, 150 03
D 15 50, 100, 150 03
E 20 50, 100, 150 03
F 25 50, 100, 150 03
TABLE 1(b). A Summary of Experimental Programme for Model Plate Load Test.
Test Series Constant Parameters Variable Parameters No of Tests 1 Load tests on Sand without Cellular Confinement FC = 0 %, 5 %, 10 %, 15 %, 20%, 25 % 06
2 d/D = 1.0, z/h = 0.0 h/D = 0.5, 1.0, 1.5 FC = 0 %, 5%, 10 %, 20 %, 25 % 15
3 d/D = 1.5, z/h = 0.0 h/D = 0.5, 1.0, 1.5 FC = 0 %,
5%, 10 %, 20 %, 25 % 15 4 d/D = 2.0, z/h = 0.0 h/D = 0.5, 1.0, 1.5 FC = 0 %,
5%, 10 %, 20 %, 25 % 15 5 d/D = 1.0, h/D = 0.5, FC = 10 % z/h = 0.0, 0.2, 0.4, 0.6, 0.8 05 6 d/D = 2.0, h/D = 0.5, FC = 10 % z/h = 0.0, 0.2, 0.4, 0.6, 0.8 05
gravity of fines was 2.63. The maximum and the minimum dry densities of the sand were found to be 17.7 kN/m3 and 15.6 kN/m3 and the corresponding
values of the minimum and the maximum void ratios was found to be 0.51 and 0.71, respectively as per the specification of IS: 2720 [22]. Clean sand was classified as SP according to Unified classification system. The effective size (D10), the
mean grain size (D50), coefficient of uniformity (Cu),
and coefficient of curvature (Cc) for sand were 0.19
mm,0.50 mm, 2.9 and 1.007, respectively. Figure 1 shows the grain size analysis of clean sand, sand with varying percentage of fines and that of fines alone.
In the present case, we have studied clean Ghaggar sand mixed with varying percentage of fines.
A series of direct shear tests were performed on clean sand and on sand with varying fine content as per IS: 2720 [23] in order to know the effect of fines on the value of angle of internal friction. The samples were prepared by estimating the weight of sand and silt needed for desired percentage of fine content. The weighed amount of silt and sand were then mixed properly. The test was performed on silty sands at a normal stress of 50, 100 and 150 kPa. Samples were sheared at a constant rate of 0.2 mm/minute. It was observed that the as proportions of fines increased, the angle of internal friction decreased. (Table 2).
The confining cells were made of mild steel
cells with different diameters and heights. The used diameters were 100, 150, and 200 mm and height was 50, 100 and 150 mm respectively. The response of cell depends on the wall thickness, uniformity and the rate of loading. The interior and exterior surfaces of the cells were kept as smooth as possible. The thickness of the cell wall was 0.94 mm. The cells were installed vertically after setting soil beds.
In order to set up a sample, the soil was poured in 100 mm height layer by rainfall technique in which sand is allowed to fall through air at a controlled discharge rate and prefixed height of fall to give uniform densities. The raining technique adopted in the present study provided a unique relative density, unit weight; maximum and minimum void ratios on the addition of fines content which are shown in Table 3.
5. LABORATORY PLATE LOAD TEST
Six series of laboratory model tests were conducted in a test box, using loading frame assembly. The soil beds were prepared in a test tank with inside dimensions of 0.60 m Χ 0.60 m Χ 0.60 m. The sand particles were deposited in the box by rain fall method. The model footing was a rigid steel plate with 100 mm diameter and 10 mm thickness. The footing was loaded with a hydraulic jack supported against the reaction frame. After the soil surface was set up, the cells were pushed vertically into the deposits at the desired location, the footing was placed in position and the load was applied in increments by a hydraulic jack. Each load increment was maintained constant until the footing settlement is less than 0.02 mm/hour. The settlement of the footing was measured using two dial gauges placed on opposite sides of the footing. The total assembly including the hydraulic jack, proving ring and the plate were aligned with the help of plumb bob to attain the verticality [24]. The geometry of the soil surface model footing and cell are shown in Figure 2. The experimental program consisted of carrying out six series of tests on the circular model footing to study the effect of fines and soil confinement on soil–foundation response as shown in Table 1b. The behavior of the footing supported on the unconfined clean sand
0 10 20 30 40 50 60 70 80 90 100
0.001 0.01 0.1 1 10
Grain Size (mm)
% Finer by W
eight
FC=5% FC=10% FC=15% FC=20% FC=25% FC=0% FC=100%
and then sand with varying amount of fines content (i.e. 5, 10, 20 and 25%) was determined. Each series of the tests was carried out to study the effect of one parameter while the other variables were kept constant. The variables such as the fine content (FC), cell height (h), cell diameter (d), and the embedded depth (z) were studied. A typical sketch of the apparatus is illustrated in Figure 3.
6. RESULTS AND DISCUSSION
Circular footing on clean sand and sand with increasing proportions of fines was tested to investigate the effect of confinement on bearing capacity. Typically, pressure-settlement responses observed from different series of tests are presented in Figures 4-6. The pressure settlement TABLE 2. Angle of Internal Friction with Different Proportions of Fines.
FC (%) γnat (kN/m3) RD (%)
φ
(Degrees) G0 16.5 45.97 42.5 2.67
5 16.9 49.07 41 2.63
10 17.2 53.40 39 2.63
15 17.2 48.52 38.01 2.63
20 17.6 55.39 37.14 2.63
25 17.0 47.85 36.12 2.63
TABLE 3. Values of Relative Density, Unit Weight, Maximum and Minimum Void Ratios on the Addition of Fines Content.
Sr.No. FC (%) γmin
(kN/m3 )
γmax
(kN/m3 )
γnat
(kN/m3) RD (%) emin emax enat esk
1 0 15.6 17.7 16.6 50.77 0.51 0.71 0.61 0.61
2 5 15.6 18.5 16.95 50.80 0.44 0.71 0.57 0.66
3 10 15.5 19.0 17.15 51.98 0.40 0.72 0.55 0.73
4 15 15.6 19.3 17.32 51.80 0.38 0.71 0.54 0.81
5 20 15.7 19.5 17.58 54.87 0.37 0.70 0.52 0.89
responses show that there is no pronounced peak in the case of an unconfined soil bed, but slope of the pressure settlement curve tends to become steeper beyond a some level of settlement ratio i.e. S/D ratio. This indicated soil failure. With the provision
of cell, clear failure is not noticed even at larger percentage of settlement.
In addition, when the footing is loaded, cellular support below the footing resists the lateral displacement of soil particles underneath the footing and confines the soil leading to a significant decrease in settlement and hence improving the bearing capacity. The improvement due to the soil confinement is represented using a non-dimensional factor, called improvement factor (If), which is defined as the ratio of the footing
ultimate load with cellular support to the footing ultimate load in tests without cellular support. D
Footing
(a)
d
z
h
(b)
Figure 2.Geometric parameters of confined soil-foundation model; (a) footing on silty sand and (b) footing on silty sand without confinement.
Figure 3.Line sketch of laboratory plate load test (free scale).
D=100mm,WC 0
5
10
15
20
25
0 50 100 150 200
Pressure(kPa)
S/D
(%)
FC=0%,RD=50.77% FC=5%,RD=50.80% FC=10%,RD=51.98% FC=20%,RD=54.87% FC=25%,RD=51.88% FC=15%,RD=51.80%
Figure 4.Variation of bearing pressure with settlement ratio (S/D) for a circular plate of 100 mm without lateral confinement.
D=100mm, d/D=1.5, h/D=1.0 0
5
10
15
20
25
0 200 400 600 800 1000
Pressure (kPa)
S/D (%
)
FC=0%,RD=50.77% FC=5%,RD=50.80% FC=10%,RD=51.98% FC=20%,RD=54.87% FC=25%,RD=51.88%
The footing settlement (S) is also expressed in non-dimensional form in terms of the footing diameter (D) as the settlement ratio, SD (S/D,%). In
the present study the ultimate capacity is interpreted as the bearing pressure, which produced a relative settlement of 10 % of diameter of footing (the values across the dotted line, S/D=0.1). Although selection to define qult at a
relative settlement of S/D is due to (i) is convenience and ease, (ii) may actually be close to the average soil strain at failure, (iii) forces a fixed value at qult for comparison (iv) treats the
displacement of all footing sizes at the same strain level [25,26].
The theoretical ultimate bearing capacity can be calculated from equation (2)
γ γ ≡0.5BN S ult
q (2)
Using the shape factor (Sγ=0.6) proposed for circular footing by deBeer [27] and the values of the bearing capacity factor Nγ from Terzaghi [28], the theoretical bearing capacities for clean sand and sand with different proportions of fines are listed in Table 4. The data shows a close agreement between both the theoretical values and experimental results.
Typical variations of bearing pressure with footing settlement ratios (S/D) for confined case for different values of fine content are shown in Figure 5.
Typical variation of bearing pressure with footing settlement ratios (S/D) with and without confinement for 0, 5 and 10% fines content for different diameter and heights of confining cells are shown in Figures 6 and 7. It can be seen that the installation of cells appreciably improves the bearing capacity of the footing as well as the stiffness of the foundation bed. Comparing the plots of Figure 6 at ultimate S/D ratio of the unconfined case they (the values corresponding to, S/D=10%), it can be seen that soil confinement improved the bearing capacity from 48.21 kPa to 306.71 kPa using cells with a d/D ratio of 2.0 and h/D ratio of 1.5(If=6.35). Therefore, in cases when
the excessive settlement is the controlling factor in determining the allowable bearing capacity, use of cellular supports may significantly decrease the settlement ratio for the same level of bearing pressure. The soil confinement could be considered D=100mm, h/D=1.0, FC=0%, RD=50.77%
0
5
10
15
20
25
0 100 200 300 400 500 600 700
Pressure (kPa)
S/
D
(
%
)
d/D=1.0 d/D=1.5 d/D=2.0 WC
(a)
D=100mm, FC=5%, h/D=1.0, RD=50.80% 0
5
10
15
20
25
0 100 200 300 400 500 600 700 800
Pressure (kPa)
S/
D
(
%
)
d/D=1.0 d/D=1.5 d/D=2.0 WC
(b)
D=100mm, h/D=1.0, FC=10%, RD=51.98% 0
5
10
15
20
25
0 100 200 300 400 500 600 700
Pressure (kPa)
S/D
(%
)
d/D=1.0 d/D=1.5 d/D=2.0 WC
(c)
as a method to improve the bearing capacity of isolated footings on loose to medium dense silty soil. Mild steel cells with different heights and diameters could easily be manufactured and placed around the individual footings leading to a significant improvement in their bearing capacity.
6.1. Effect of Cell Diameter
In order to investigate the effect of cell diameter on the footing behavior resting on silty soils, three cells of diameters 100, 150 and 200 mm were used. Figure 8 shows the variation of improvement factor with normalized cell diameter for different cell heights with a constant footing diameter of 100 mm for different proportions of fines. For h/D ratio of 0.5 and 1.0, the value of improvement factor for circular footing supported on confined silty sands increases up to d/D equals to 1.5. When d/D ratio is increased beyond 1.5, improvement factor decreases. The value of improvement factor is maximum for normalized d/D equal to 2 and h/D equal to 1.5. While conducting the model tests, it was observed that as failure approaches in tests carried out with small cell diameters, soil inside and the cell behaved as one unit (when the load was increased, the cell, soil, and footing settled altogether). During the tests carried out with large cell diameters, this behavior was noticed for the initial part of loading, but as the load was increased it could no longer be observed (the footing settled down while the cell was unaffected with the increase of the load). It is clear that the best benefit of cellular confinement could be obtained with a(d/D) ratio between 1.5 to 2.0 with the maximum improvement in the bearing capacity at a ratio of 1.5 for different heights of confining cells.
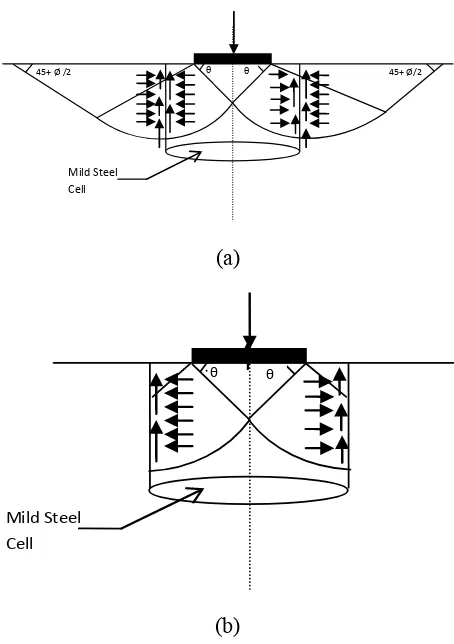
This increase in the bearing capacity of the footing can be explained with the help of Figure 9. When the footing is loaded, such cell resists the lateral displacement of soil particles underneath the footing and confines the soil leading to a significant decrease in the vertical settlement and hence improving the bearing capacity. For small cell diameters, as the pressure is increased, the plastic state is developed initially around the edges of the footing and then spreads downward and outward. The mobilized vertical friction between the sand and the inside wall of the cell increases with the increase of the acting active earth pressure until the point when the system (the cell, the soil, and the footing) behaves as one unit. The behavior is similar to that observed in deep foundations in which the bearing capacity increases due to the shear resistance of cell surface. This explains the increase in the bearing capacity with the increase of the cell diameter and cell height.
6.2. Effect of Cell Height
In order to investigate the effect of cell height on the footing response of silty soil, tests were carried out using three different heights for each cell diameter for different percentages of fines. The variation of improvement factor with normalized cell height (h/D) is shown in Figure 10 for different normalized cell diameters (d/D). The figure shows the same pattern of behavior for the different cell diameters.TABLE 4. Model–Scale Footing Test Results (Un-Confined Case).
FC (%) D (mm) RD (%) Experimental q
ult(kPa)
Theoretical qult(kPa)
Back–Calculated
Nγ Terzaghi Nγ *
0 100 50.77 101.25 99.07 203.32 198.95
5 100 50.80 73.12 71.09 144.24 139.82
10 100 51.98 48.21 45.68 93.44 88.8
15 100 51.80 42.63 40.17 82.61 77.31
20 100 54.87 37.80 35.45 72.01 67.22
25 100 51.88 30.56 28.49 59.58 55.39
D=100mm, d/D=1.5, FC=0%, RD=50.77% 0
5
10
15
20
25
0 200 400 600 800 1000 1200 1400
Pressure (kPa)
S/
D (
%
)
h/D=1.0 h/D=0.5 h/D=1.5 WC
Pressure (kPa)
(a)
25
D=100mm, d/D=1.5, FC=5%, RD=50.80% 0
5
10
15
20
25
0 200 400 600 800 1000
Pressure (kPa)
S/
D
(
%
)
h/D=0.5 h/D=1.5 h/D=1.0 WC
(b)
D=100mm, d/D=1.5, FC=10%, RD=51.98% 0
5
10
15
20
25
0 100 200 300 400 500 600
Pressure(kPa)
S/
D
(
%
)
h/D=0.5 h/D=1.0 h/D=1.5 WC
(c)
Figure 7. Variation of bearing pressure with settlement ratio (S/D) with cellular support for different cell heights for different percentage of fines: (a) 0%, (b) 5% and (c) 10%.
D=100mm, FC=0%, RD=50.77%
0 1 2 3 4 5 6 7 8
0 0.5 1 1.5 2 2.5
d/D
If
h/D=0.5 h/D=1.0 h/D=1.5
(a)
D=100mm, FC=5%, RD=50.80%
0 1 2 3 4 5 6 7 8
0 0.5 1 1.5 2 2.5
d/D
If
h/D=0.5 h/D=1.0 h/D=1.5
(b)
D=100mm, FC=10%, RD=51.98%
0 1 2 3 4 5 6 7
0 0.5 1 1.5 2 2.5
d/D
If
h/D=0.5 h/D=1.0 h/D=1.5
(c)
Increasing the cell height results in a greater improvement in the bearing capacity. The increase in cell height results in the enlargement in the surface area of the cell–model footing leading to a higher bearing capacity. Figure 10 shows the same pattern of behavior for d/D = 1.0 and 1.5. For d/D = 2.0 and h/D = 1.5, the bearing capacity (If=6.35)
is more in comparison to d/D = 1.0 and 1.5 for h/D values equal to 0.5, 1.0 and 1.5. It is due to the increased height of the cellular supports by which the surface area increases and failure plane moves in downward direction.
6.3. Effect of the Depth of Embedment
In order to investigate the effect of side supports provided to support soil cuts on the behavior when the foundation level is low, a series of tests were carried out (i.e. sometimes the footing is placed at low depth relative to top of the side support). All parameters namely diameter of the cell, height of45+Ø /2 θ 45+ Ø/2
Mild Steel Cell
θ
(a)
θ
Mild Steel Cell
θ
(b)
Figure 9. (a) Intersection of failure surface with the cell and (b) obstructed failure surface by a cell.
D=100mm, FC=0%, RD=50.77%
0 1 2 3 4 5 6 7 8
0 0.2 0.4 0.6 0.8 1 1.2 1.4 1.6
h/D
If
d/D=1.0 d/D=1.5 d/D=2.0
(a)
D=100mm, FC=5%, RD=50.80%
0 1 2 3 4 5 6 7 8
0 0.2 0.4 0.6 0.8 1 1.2 1.4 1.6 h/D
If
d/D=1.0 d/D=1.5 d/D=2.0
(b)
D=100mm, FC=10%, RD=51.98%
0 1 2 3 4 5 6 7 8
0 0.2 0.4 0.6 0.8 1 1.2 1.4 1.6
h/D
If
d/D=1.0 d/D=1.5 d/D=2.0
(c)
the cell and proportion of fines held constant except the depth of the footing relative to the top of the cell (z). To precisely model the site condition, two cases were evaluated in this series of tests. The two cell diameters with d/D ratio equal to 1 and 2 were used. The normalized depth of the footing to the cell height (z/h) values varied among 0 to 0.8 for d/D equal 1 and 2 were used. Figure 11 shows the variation of improvement factor with normalized embedded depth (z/h) for cells with d/D equal to 1 and 2 and h/D of 0.5. It is clear that variation in the footing depth relative to the cell top has no effect on the behavior of cell–model footing. The difference between the maximum improvement factor (2.77,1.49) and the minimum value (2.68,1.35) is 0.09 and 0.14 respectively. This difference is caused by the slight disturbance that occurred in the sand beds while placing the footing within the cell. This can be explained as follows. For ordinary footings (without cellular support), increasing the foundation depth results in increasing the overburden pressure and hence increasing the bearing capacity. However, footing with cellular support the effect of overburden pressure is not significant. When the footing is loaded, it settles and the plastic state is developed until the point at which the soil-cell system behave as one unit. Therefore, increasing the embedment affects only the initial part of the behavior until that point after which the ultimate load depends on
the surface area of the cell, which is constant. Hence, it can be concluded that the embedment of a footing in confined granular soil has no effect on the response of the footing-cell system.
6.4. Effect of Fines
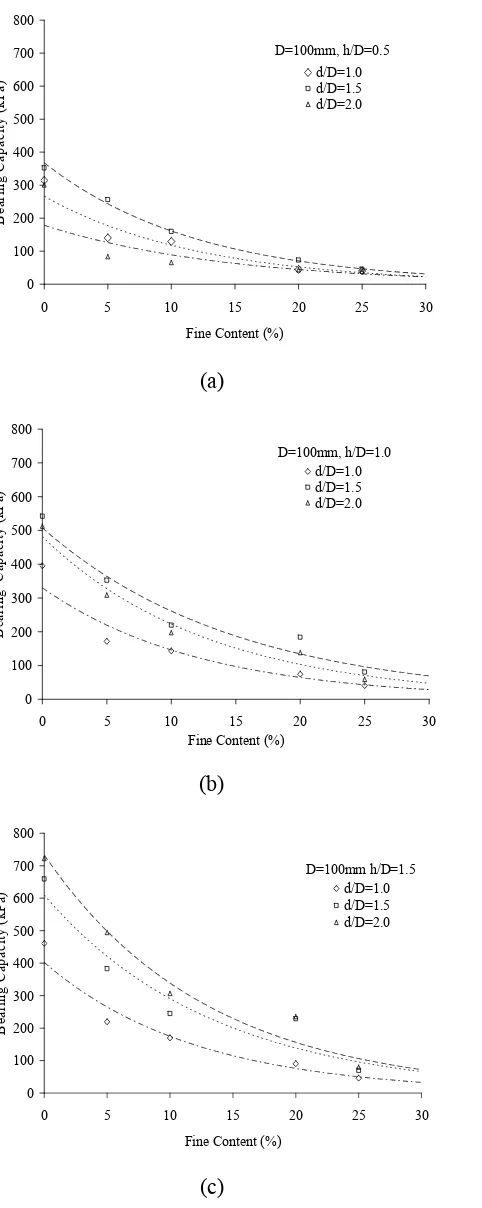
In order to analyze the effect of fines, a series of tests were carried out with all parameters namely diameter of the cylinder, height of the cylinder except the percentage of fines content were kept constant(Figure 12). Tests were conducted for different normalized diameter of the cell to the diameter of footing (d/D) values varied among 1 and 2 as shown in Table 1b. Figure 12 shows the variation of bearing capacity with different percentage of fines content for different cells with d/D of 1, 1.5 and 2 for different h/D ratios. It is clear that increasing the percentage of fines for different values of d/D and h/D ratios, the bearing capacity decreases. It is due to the fact that as we increase the proportions of fine content, the density increases along with the compressibility. The effect of compressibility offsets the effect of increase in density. In other words, with the addition of fines, settlement increases and the ultimate bearing carrying capacity decrease. Hence, in the presence of fines, the failure criterion is governed by allowable settlement and the bearing capacity of the footing decreases.6.5. Effect of the Soil Pressure on the Cell
One of the parameters to be investigated was the thickness of the cell wall to study the effect of the cell rigidity on the footing-cell system behavior and to study the hoop tension in the cell wall due to the pressure under the footing. The cell, which was used in the present study 100 mm in diameter and is made up of mild steel sheet of 0.94 mm thickness. The internal pressure, which the cell can withstand, is estimated to be 4700 MPa. In the model tests, the maximum pressure applied on the cell was 762 kPa. The horizontal pressure acting on the sidewalls of the cell is approximated by the vertical pressure and the coefficient of lateral earth pressure. It can be seen that the maximum estimated horizontal earth pressure on the sidewalls of the cell is relatively insignificant in comparison to the allowable internal pressure. The given allowable value is the net inside pressure while the cell in the model is
D=100mm, FC=10%, RD=51.98%
0 1 2 3 4 5
0 0.2 0.4 0.6 0.8 1
z/h
If
d/D=1.0 d/D=2.0
D=100mm, h/D=0.5
0 100 200 300 400 500 600 700 800
0 5 10 15 20 25 30
Fine Content (%)
B
ear
ing C
apaci
ty
(
kP
a) d/D=1.0d/D=1.5
d/D=2.0
(a)
D=100mm, h/D=1.0
0 100 200 300 400 500 600 700 800
0 5 10 15 20 25 30
Fine Content (%)
B
ear
in
g C
apa
ci
ty
(
kP
a)
d/D=1.0 d/D=1.5 d/D=2.0
(b)
D=100mm h/D=1.5
0 100 200 300 400 500 600 700 800
0 5 10 15 20 25 30
Fine Content (%)
Be
ar
in
g Ca
pa
ci
ty
(
kP
a) d/D=1.0d/D=1.5
d/D=2.0
(c)
Figure 12. Variation of bearing capacity with different proportions of fines for different values of (h/D) ratios: (a) 0.5, (b) 1.0 and ( c) 1.5.
subjected to both internal and external pressures. The checks were performed after each test to observe if any deformation in the cell wall features and measurements were made to check the internal diameter as well as the thickness of the cell wall. No change was noticed in the cell features or its dimension. Therefore, for the given model and dimensions, the footing pressure have no effect on the cell wall. Therefore, the same cellular support was used for all the varied model test setups.
7. CONCLUSIONS
Based on experimental study, the following conclusions are drawn.
1. Soil confinement has a significant influence on the behavior of circular footings leading to bearing capacity enhancement for systems supported on granular soils.
2. For small diameter of cells relative to footing size (d/D≤1.0), the cell-soil-footing system acts as one unit i.e. the cell, soil, and footing settle all together.
3. For large diameter cells relative to footing size (d/D>1.0), the cell-soil-footing system behaves initially as one unit but as the failure approaches, the footing only settles while the cell remains unaffected.
4. The improvement in the ultimate bearing capacity depends on the d/D (cell diameter/ footing diameter) and h/D ratio (cell height/ footing diameter). The optimum ratio is 1.5 beyond which the improvement decreases as the h/D ratio increases from 0.5 to 1. Whereas if d/D = 2, the improvement factor (If)
increases for all the values of h/D.
5. Increase in the height of the confining cell transfers footing loads to the deeper locations and increases the improvement factor due to an increase in the surface area of the cell-model footing.
6. The embedded depth of the footing relative to the top of confining cell has no significant effect on the response of footing-cell systems. 7. Bearing capacity of circular footings decreases
8. ACKNOWLEDGMENTS
The tests were performed in the Geotechnical Engineering Laboratory of Civil Engineering department, Thapar University, Patiala, India. The authors are thankful to Prof. V.K. Sud for his valuable suggestions on conceptualization of this problem. The first author appreciates the support provided by Prof. M. Kumar HOD and the staff of the Department of Civil Engineering, Thapar University, and Patiala.
9. APPENDIX
The following symbols are used in this paper: Cc Coefficient of curvature for the sand;
Cu Uniformity coefficient;
D Footing diameter;
d cell diameter;
D10 Effective size;
D50 Mean size(mm);
emax Maximum void ratio;
emin Minimum void Ratio;
enat Natural void ratio;
esk Skeleton void ratio
FC Fines content; G Specific gravity;
h Cell height;
If Improvement factor;
Nc, Nq, NγThe bearing capacity factors qult Ultimate bearing capacity;
S Footing settlement; SD Settlement ratio = S/D;
Sγ Shape factor; WC Without cellular support;
z Embedded depth for cases when the foundation level is lower than the cell top γmax Maximum unit weight;
γmin Minimum unit weight;
γnat Natural unit weight;
φ
Angle of internal friction; RD Relative density10. REFERENCES
1. Trivedi, A., Pathak, R. and Gupta, R., “Soil Investigation
Report for the Construction of Church”, TIET, Patiala, India, (1999).
2. Trivedi, A. and Sud, V.K., “Grain Characteristics and
Engineering Properties of Coal Ash”, Granular Matter,
Vol. 4, No. 3, (2002), 93-101.
3. Feda, J., “Research on Bearing Capacity of Loose Soil”,
Procs. 5th Int. Conf. Soil Mech and Found. Eng.,Paris,
France, Vol. 1, (1961), 635-642.
4. DeBeer, E.E., “Bearing Capacity and Settlement of
Shallow Foundations on Sand”, Symposium on Bearing Capacity and Settlement of Foundations, Duke University, Durham, NC , U.S.A., (1965), 15-33.
5. Meyerhof, G.G., “Shallow Foundations”, J. Soil Mech.
Found. Div., ASCE, Vol. 91, No. 2, (1965), 21-31.
6. Brinch Hasen, J., “Revised and Extended Formula for
Bearing Capacity”, Danish Tech. Inst., Copenhagen,
Denmark, Bulletin No. 28, (1970), 5-11.
7. Vesic,A.S.“AnalysisofLoadsofShallow Foundations”,
J. Soil Mech. Found. Div., ASCE, Vol.99, No. 1, (1973),
45-73.
8. Pitman, T.D., Robertson, P.K. and Sego, D.C., “Influence
of Fines on Collapse of Loose Sands”, Can. Geotech. J.,
Vol. 31, (1994), 728-739.
9. Vaid, Y.P. “Liquefaction of Silty Soils”, ASCE, Geotech.
Special Publication, Vol. 44, (1994), 1-16.
10. Zlatovic, S. and Ishihara, K., “On the Influence of
Non-Plastic Fines on Residual Strength”, Proceedings of
IS-Tokyo-95, First International Conference on Earthquake
Geotechnical Engineering (Ed. Ishihara, K.), Rotterdam,
Netherland, (1995), 239-244.
11. Thevanayagam, S., Ravishankar, K. and Mohan, S., “Steady State Strength, Relative Density and Fines
Content Relationship for Sands”, Trans. Res. Record,
Vol. 1547, (1996a), 61-67.
12. Thevanyagam, S., Wang, C.C. and Ravishankar, K.,
“Determination Post Liquefaction Strength of Sands:
Steady State Versus Residual Strength”, ASCE,
Geotech. Spec. Publ., Vol. 58, No. 2, (1996b), 1210-1224.
13. Sawwaf, M. EI. and Nazer, A., “Behavior of Circular
Footings on Confined Granular Soil”, J. of Geotech and
Geoenviron. Eng., ASCE, Vol. 131, No. 3, (2005),
359-366.
14. Kuerbis, R., Nagussey, D. and Vaid, Y.P., “Effect of Gradation and Fines Content on the Undrained
Response of Sand”, Proc. Hyd. Fill Struc. Geotech.
Spec. Publ., ASCE, New York, U.S.A., Vol. 21, (1988),
330-345.
15. Lade, P.V. and Yamannuro, J.A., “Effects of
Non-Plastic Fines on Static Liquefaction of Sands”, Can.
Geotech. J., Ottawa, Canada, Vol. 34, (1997), 905-917.
16. Rajagopal, K., Krishnaswamy, N. and Latha, G., “Behavior of Sand Confined with Single and Multiple
Geocells”, Geotext. Geomembr., Vol. 17, (1999), 171-184.
17 Rea, C. and Mitchell, J.K., “Sand Reinforcement using
Paper Grid Cells”, Reprint 3130, ASCE Spring Convention and Exhibit, Pittsburgh, PA, U.S.A., (1978), 24-28.
18. Dash, S., Krishnaswamy, N. and Rajagopal, K., “Bearing Capacity of Strip Footing Supported on
Geocell-Reinforced Sand”, Geotext. Geomembr., Vol. 19, (2001a),
19. Dash, S.K., Sireesh, S. and Sitharam, T.G., “Behavior of Geocell Reinforced Sand Beds under Circular Footing”,
Ground Improvement, Vol. 7, (2003b), 111-115.
20. IS: 2720 (Part3/Sec2), “Methods of Tests for Soils”, Part 3 Determination of Specific Gravity, Section 2 Fine, Medium and Coarse Grained Soils, (1980). 21. IS: 2720 (Part 4), “Methods of Test for Soils”, Part 4
Grain size Analysis, (1985).
22. IS: 2720 (Part 14), “Methods of Test for Soils”, Part 14 Determination of Density Index (Relative Density) of cohesionless soils, (1983).
23. IS: 2720 (Part 39/Sec 1), “Methods of Test for Soils”, Part 39 Direct Shear Test for Soils Containing Gravel, Section I Laboratory Test, (1977).
24. Trivedi, A. and Sud, V.K., “Collapse Behaviour of Coal
Ash”, Journal of Geotechnical and Geo-environmental
Engineering, ASCE, Vol. 130, No. 4, (2004), 403-415.
25. Trivedi, A. and Sud, V.K., “Ultimate Bearing Capacity
of Footings on Coal Ash”, Granular Matter, Vol. 7, No.
4, (2005), 203-212.
26. Lutenegger, A.J. and Adams, M., “Scale Effects of Shallow Foundation Bearing Capacity on Granular Material”,
ASCE, Vol. 133, No. 10, (2007), 1192-1202.
27. DeBeer, E.E., “Experimental Determination of the Shape Factor and the Bearing Capacity Factors of Sand”,
Geotechnique, Vol. 20, (1970), 387-411.