A Methodology for Product Performance Analysis under Effects of Multi-physical
Phenomena
N. Dinh Son *
Danang University of Technology, The University of Danang, 54 Nguyen Luong Bang, Danang, Vietnam
P A P E R I N F O
Paper history: Received 9 Junuary 2012
Received in revised form 21 May 2012 Accepted 30 August 2012
Keywords: Performance Analysis Product Life Cycle Geometric Deviation Model Manufacturing Simulation
A B S T R A C T
Due to the development of science and technology, the computer has become a useful tool for supporting engineering activities in product design. Many computer aided tools such as Computer Aided Design/Manufacturing (CAD/CAM), product data management (PDM), product life cycle assessment (PLA), etc., have been popularly used in industry for reducing product development lead-time and increasing total product quality. As a result, product designers can easily create the numerical model of product based on these tools. However, it can only represent nominal information of the product. It is not able to deal with various kinds of multi-physical effect during the whole product life cycle, especially in manufacturing/assembly and product usage stage. Performance analysis of product based on this model gives a result that is different from the real product in practice. It can make the quality of the product designed not to meet fully the requirements of customers and users. Thus, this paper proposes a global methodology that allows integrating the multi-physical effect throughout the product life cycle into the performance simulation. The variation sources throughout product life cycle are taken into account performance analysis of product.
doi:10.5829/idosi.ije.2012.25.04c.09
1. INTRODUCTION1
The satisfaction of a product to the requirements of clients and users such as quality, reliability, sustainability and cost of products becomes an important key in the context of global and concurrent economy. Thus, the robustness of the product performance under various kinds of disturbance during its life cycle plays a decisive factor of the product quality in product-process design.
Today, the computer has become an indispensable tool supporting engineering activities in product-process design. The product designers easily create the numerical model of a product on CAD system. This model only represents the nominal information of the product. Moreover, the simulations to predict the behavior (kinematics, dynamics, failure, etc.) and the performances of the product are carried out on this nominal model. However, a product during its life cycle passes through many stages from conceptual design to use and the end of life. It passes through manufacturing
*Corresponding Author Email: [email protected];
[email protected] (N. Dinh Son)
and assembly stages where geometric deviations can be generated and accumulated by the multi-physical phenomena, such as tooling deformation, wearing, thermal deformation, etc.
In fact, each part making up the product is manufactured from the raw material at the manufacturing stage by manufacturing processes (forging, cutting or grinding). The geometric deviations on each part are generated and accumulated over the successive set-ups of manufacturing processes because of the inherent imperfections of material, tooling and machining Ramesh, et al. [ 1], [ 2]. Then, the parts with these deviations are assembled at the assembly stage by assembly processes. The geometric deviations of the surfaces of each part, generated at manufacturing stage, affect assemblability of the product. The assembly stage also contributes the deviations. Therefore, at the end of these two production stages, the geometry of the product is different from the nominal one. The “real” performance of the product is different from the designed one (nominal performance) that the product designers simulated by using the numerical model of product created on CAD system. The geometric
variability obviously has an influence on the product performance when it arrives in the hand of the users. Thus, the risk is then that the product designed does not meet fully the requirements of the customers and users. In this case, the product-process design has to be considered as not good or at the least not robust.
As a result, a global method that allows integrating multi-physical effect throughout the product life cycle into the performance simulation is proposed in this paper. The method focuses on using the concurrent product modeling technology such as CAD/CAM system, numerical simulators, etc., for integrating the geometric deviations and use conditions into the performance simulations of the product.
2. LITERATURE REVIEWS
The geometric deviations generated and accumulated during the product life cycle affect the performance of the product. It is thus necessary to manage their causes and consequences at the design stage in order to reduce their effect on the product performance all along its life cycle. Parkinson [ 3] proposed to use engineering models for developing robust design in order to reduce the variance of the design under variation of sources, such as manufacturing operations, variation in material properties, and operating environment. Yu, et al. [ 4] addressed the impact of the manufacturing errors on the performance of the product. He defined the Manufacturing Variation Pattern (MVP) to represent the manufacturing characteristics and investigated its effects on the performance of the product.
Zhu, et al. [ 5] presented a theory that offers an analytical and geometric description of the performance sensitivity distribution of a product in the variation space. The theory can be applied to find a robust design that is less sensitive to the dimensional variation due to manufacturing errors or product wear. Liu, et al. [ 6] proposed a new Probabilistic Sensitivity Analysis (PSA) approach for design under uncertainty based on the concept of relative entropy. This approach provides valuable information about the impact of the design variables on the performance of the product and whole range or a partial range of the performance distribution.
Bruyère, et al. [ 7] proposed a statistical approach in order to evaluate the impact of the geometric variations on the angular rotational velocity between two bevel gears. Monte-Carlo simulation method is used to consider the geometric behavior simulation and tooth contact analysis. Yin, et al. [ 8] proposed to integrate material and manufacturing process uncertainties in the design in order to consider their impacts on the performance of the product. They developed a procedure for uncertainty propagation from the material random field to the product performance based on the
product finite-element mesh.
These studies examine the impact of the variation sources or the geometric variations on the product performance variation. Their approaches are, however, based on the nominal model of the product. Moreover, there are many kinds of disturbances during the product life cycle that influence on the total product quality as presented by Kimura [ 9]. In addition, the current product modeling technology, such as CAD/CAM, PLA, etc., is unable to model geometric deviations generated during the product life cycle. Most of the relationship approximations between the performance and the design variables are only based on the nominal model of the product. In order to investigate their effect on the product performance, a global methodology that allows taking them into account the performance simulation of the product is proposed in the paper. The overview of the proposed method is shown in Figure 1. The variation sources effecting on the performance of product throughout its life cycle will be taken into account the performance analysis. Especially, the geometric variations generated and accumulated by the manufacturing and assembly process in this stage of product life cycle are integrated in performance simulation by using geometric deviation model. This model can link all variation sources from manufacturing to assembly stage. That is an advantage compared to the other models as presented above. Further, the conditions of product operation in use stage of product life cycle are also taken into account the simulation of product performance. As a result, product designers have an exact image of performance of product designed and then the product designed can meet fully requirements of customer and users. This is a new contribution of the proposed method.
3. METHOD DESCRIPTION
In the manufacturing and assembly stages, the geometric deviations of each surface of the final product are caused by the effects of multi-physical phenomena, such as tooling deformation, thermal deformation, material property of the part, etc. These deviations are modeled by the geometric deviation model (GDM) that will be detailed in the next session. The Monte-Carlo simulation method is then used to create the image of geometric deviations of the product population.
CAD software. This model is not able to deal with the geometric deviations as presented above. The designer cannot manage the consequences of the effects in the design stage. Thus, it is necessary to integrate them into the performance simulation of the product for obtaining the robust design product. In order to solve the problem, the design of experiment method is proposed to use for integration the effects and establishing the mathematical relation between the product performance and the parameters of variation sources. As a result, an image of performance of the product population is generated for validation of performance of the product designed.
3. 1. Geometric Deviations of Product In the manufacturing and assembly stage, the geometric deviations are generated and accumulated by material property defects, manufacturing and assembly errors, etc. They will obviously have an influence on its performance. The geometric deviation model can model them based on small displacement torsor as presented by Nguyen, et al. [ 10]. A small displacement torsor (SDT) T at a point O in the Cartesian coordinate system (O,X,Y,Z) is described by rotational vector R and translational vector D as shown in Equation (1).
{R D}{OXYZ}
T= , , , , (1)
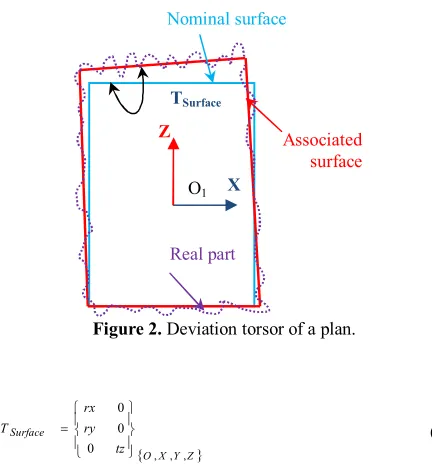
A surface deviation torsor is a small displacement torsor describing the deviation between an associated surface and a nominal surface. The associated surface is an ideal surface associated to the real surface using a minimum distance criterion such as the least square. For example, the deviation torsor of the associated plane relative to its nominal position (see Figure 2) is described by the SDT TSurface at a point O in the local coordinate system (O,X,Y,Z), as shown in Equation (2).
Figure 2. Deviation torsor of a plan.
{O XY Z}
Surface
tz ry rx T
, , , 0
0 0
ï þ ï ý ü
ï î ï í ì
= (2)
Where rx, ry are rotational and tz translational component regarding X, Y, Z axis respectively. The plan, in this case, has three degrees of freedom, so three positioning deviations of the plan are invariant (i.e. cannot be measured due to the surface class) relative to their nominal position and their values are arbitrarily fixed. Thus, the 0 value is chosen in order to hide the notion of invariance.
The GDM for the manufacturing stage is based on the model of manufactured part (MMP) proposed by Vignat, et al. [ 11]. The geometric deviations generated by a machining process are considered to be the result of two independent phenomena: the positioning and the machining deviations accumulated over the successive set-ups. The positioning deviation is the deviation of the
Associated surface
Nominal surface
TSurface
O1 Z
X
nominal part relative to the nominal machine. The positioning operation of the part on the part-holder is realized by a set of hierarchically organized elementary connections. The manufactured deviations of surface relative to its nominal position in MMP are expressed by the parameters of the small displacement torsor TPi, Pji.
i j i i j
iP SjP SjP
P T T
T
, ,
, =- + (3)
TSj, Pji models the positioning deviation of workpiece Pi
in set-up Sj. This deviation is a function of the MMP surfaces deviation generated by the previous set-ups, the holder surfaces deviations and the links part-holder/part surfaces. TSj, Pji models the deviation of the
machined surface j of the part Pi realised in set-up Sj. This deviation is expressed relative to the nominal machine. This torsor merges deviations of the surface swept by the tool and cutting local deformations.
A product is made up of parts assembled by the way of connections. Each part has already passed through the manufacturing stage where geometric deviations have been generated. Then the product passes through assembly stage of its life cycle. Assembly stage of the product life cycle is an essential stage, and it obviously brings its share of deviations to the product. The GDM for the assembly stage is also based on the model of assembled part (MAP) proposed by Nguyen, et al. [ 10]. This model uses the geometric behaviour laws based on the SDT for modelling geometric deviations in the mechanism that are proposed by Bourdet, el al [ 12] and Thiebaut [ 13]. The positioning deviations of the part relative to its nominal position in the global coordinate system of the product are modelled by a small displacement torsor TP, Pi.
i m i i m k n k n k k
i PP P P P P P P
P
P T T T T
T , = , + , + , - , (4)
Where i
m k n P P
T , is the link torsor between surface m of MMP i (part i) and surface n of MMP k (part k). TP, Pk is
the positioning deviation torsor of part k, it models the positioning deviation of the part k (a subassembled part coming from the previous set-up of the assembly process) relative to their nominal position in the global frame of the product. Then a linear system of equations is created from the contribution of each connection among connected parts. The positioning deviations of a part are determined by resolution of the linear system of equations based on Gauss-elimination method. Finally, the geometric deviations of surface j of the part i relative to their nominal positions in the global coordinate system of product can be calculated by the Equation (4) will be collected by SDT TP, Pji.
The GDM establishes the mathematical relation between the deviation sources from the manufacturing and assembly stage and product surfaces deviations. A Monte-Carlo simulation method is then used to create a set of M products with geometric deviations. M is
generally chosen between 10000 and 1 million. It depends on the size of the product produced in practice and the precision of result of the Monte-Carlo simulation.
The population of product is generated by the strategy following:
1. Define the probability distributions and the variation zone of the input variables (quality of the fixture surface, machining tool accuracy).
2. Generate randomly the set of value inputs according to their distributions.
3. Calculate the surface deviations of each manufactured part of the product based on the MMPs.
4. Assemble the manufactured part of the product based on verification of the assembly constraint.
5. Calculate the surface deviations of the product in the product frame.
As a result, the product designers can be aware of distribution and variation of each surface of the product from the simulation result as presented by Nguyen, et al. [ 14].
3. 2. Product Performance Simulation In the case of a simple product system, the existence of the mathematical relation between the product performance and the geometric deviation parameters is available. We can easily calculate the performance of the product and then generate the image of performance of a product population based on the result of Monte-Carlo simulation. However, it is difficult to calculate the performance of the product in the case of a complex product system. We practically use finite element method due to computer-aided based on the numerical model on CAD software to determine the product performance. Thus, we propose to use design of experiment method to integrate geometric deviation parameters into the performance simulation. The aim is to establish an approximate relationship between the product performance and the geometric deviation parameters. As a result, an image of performance of a product population is generated.
3 .2. 1. Geometric Deviation Model of Product in CAD Environment To integrate the geometric deviations into the simulation of the product performance, we need a deviated model that allows representing these deviations. Thus, it is necessary to develop a method that permits to obtain the deviated model of the product based on its nominal model in the CAD software.
P1
Nominal model
P4
Z
Extruded
Deviated model Cut part Deviated P1
z1 y1 x1 o1 X
Y O
P2 P3 P
5
P6
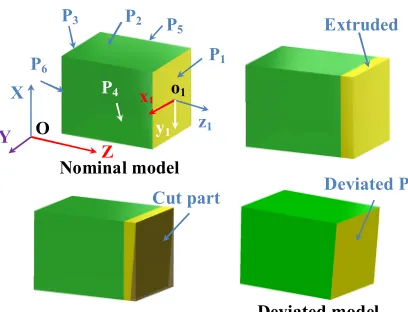
Figure 3. Deviated model of a part in CAD software.
position. The nominal model of the product created in the CAD software is built on a set of elementary surfaces (planes, cylinders, spheres, etc.). Thus, it is possible to create a deviated model of a surface in the CAD software based on the nominal surface and the part deviation torsor.
However, it does not exist the interface that allows acting on the geometry data in commercial CAD software (ProEngineer, Solidworks, Catia, etc.) and thus it is difficult to combine the deviated elementary surfaces of the deviated model of the part or the product. Thus, we propose to use the expert knowledge to filter the unessential surfaces and parameters of the geometric deviations. The aim is to reduce time for creating the deviated model in CAD software. The selected geometric deviations and surfaces must have a strong influence on the product performance according to expert knowledge.
The surface deviation torsor representing the geometric deviations of the plane P1 comes from GDM and Monte-Carlo simulation, as given in Equation (5).
(1 1 11) !
, 1 1 1
0 0
0 o x y z
P
tz ry rx T
ï þ ï ý ü ï
î ï í ì
= (5)
First, the plane P1 is moved alongaxis o1z1 from a
value 1 ( 1 1)
2 rx ry
H tz
l³ + + by the extrusion technique. Then the deviated plane is created by cutting the extruded part by plane rotated around the axes o1x1 and o1y1 of rx1 and ry1, respectively. Finally, we obtain the deviated part in PTC ProEngineer, as shown in Figure 3.
3. 2. 2. Design of Experiment Firstly, it is necessary to select the strategy of design of experiment (DOE) method in order to create an experimental table, called design matrix, which includes design factors and their levels and corresponding experimental runs results
(called response vector). We propose to use three different approaches (Factorial design, Taguchi design and Random design) depending on the number of the geometric deviation parameters (factors). To reduce the number of factors, key geometric deviation parameters are defined based on expert knowledge. These key parameters are measured on the virtual product and are functions of the elementary deviation parameters. The value of these factors can be calculated for the M products based on Monte-Carlo simulation. Then the number of levels for these factors has to be defined depending on a compromise between the desired precision and the calculation time. The value of each level of each factor is calculated according to its range of variation. The values of each level of the n selected parameters {pij}i=1.N,j=1..n are then gathered in a design matrix P={ pij}Nxn.
Two cases are encountered to determine the performance of the N products. In the simple case, the function performance is known, and the performance value is obtained by the value of each parameter pij of each row of the design matrix into the analytical formula. In the complicated case, simulation tools as Finite Element Analysis (FEA), Computational Fluid Dynamics (CFD), etc. is used to calculate the performance of the product. Thus, a set of the N deviated models of the product, corresponding to the parameters value of each row of the design matrix, has to be created in the CAD system. Each model is used to simulate the performance of the product in order to determine the performance of N products that are called response vector R. The response vector R corresponding to the design matrix P can then be filled.
The relationship between the performance of the product and the selected factors
{
p1,p2,p3,..,pn}
is established by the design of experiment method. This relationship can be expressed by Equation (6)) ,.., , ,
(p1 p2 p3 pn f
e
Performanc = (6)
For example, the linear least square fit model Rao, et al. [ 15] is used to establish the relationship in the case of n factors at two levels. From the result of 2n simulations, the relationship is expressed by the function as shown in Equation (7).
e
b +
= p
f ˆ. (7)
Where { }T
n p p p p
p= 1, 2, 3,.., is a vector of the n factors. bˆ is a coefficient vector of the model. It is calculated by Equation (8).
( )
PT.P .PT.Rˆ= -1
b (8)
{
}
TN r r r r
ε is a residual vector describing the . It is calculated by Equation (9).
å
= = = N i i r N R E 1 1 ) ( e (9)The performance population of the product (for example, a million of products) will be generated by replacing the value of the selected factors
{
p1,p2,p3,..,pn}
based on the collected data of the Monte-Carlo simulation into Equation (6).4. A CASE STUDY: HARD DISK DESIGN
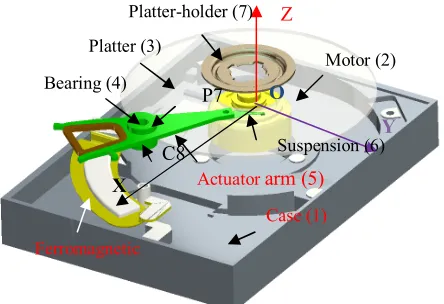
In order to illustrate the proposed method for integration of multi-physical effects into the simulation of product performance, we propose in this paper an example of hard disk design. The components of the hard disk are shown in Figure 4.
The quality of the hard disk depends on the clearance between the read-and-write head and the platter. Thus, we need to assure that the read-and-write head must not touch the platters, and the clearance among them has to be several micrometers. Therefore, the performance of hard disk investigated in this case is the clearance between the suspension tip carrying the read-and-write head and the platter of the hard disk.
4. 1. Geometric Deviation Model of the Hard Disk in Production Stage In order to manufacture the hard disk, the manufacturing process, the assembly process and the associated resources are selected suitable to the cost and the requirements of the customers and the users as well. As the result, the geometric deviation model of this hard disk during the manufacturing and assembly stages of its life cycle is generated by the GDM as presented above.
Figure 4. Model of hard disk components in CAD software.
Figure 5. Manufacturing process for actuator arm.
For example, the actuator arm (part 5) of the hard disk is realized by a manufacturing process as shown in Figure 5. The set-up 0 is to manufacture the raw piece for the set-up 1 where the cylinder C4 will be manufactured.
Basing on the geometric deviation model The cylindrical surface deviations of the cylinder C4 of the actuator arm (part 5) relative to its nominal position in the local coordinate system (O5,X5Y5Z5) are described by torsor as given in Equation (10). This torsor is determined by the geometric deviation model. All calculations are presented clearly by Nguyen, et al. [ 10]. In this torsor, the parameters rx5,4, rx5,7, ry5,4 and ry5,7 represent the machining accuracy. The parameters rx5,7S1, ry5,7S1, tx5,7S1, ty5,7S1 and tz5,5S1 represent the quality of the fixture surfaces in set-up 1. The parameters lrx5,7S1, lry5,7S1, ltx5,7S1, lty5,7S1 and lty5,5S1 represent the link between the fixture surfaces and the surfaces of workpiece in the set-up 1.
( 5 55 5)
5 4 5 , 5,5S1 5,5 5,5S1 5,7S1 5,7 5,2 5,7S1 5,7 5,7S1 5,7 5,7S1 5,7S1 5,2 5,7S1 5,7S1 5,7 5,2 5,7S1 5,7 5,7S1 5,7 5,7S1 5,7S1 5,2 5,7S1 , tz -tz ltz -0 ty -ty ty rx rx -ry -ry lty -lrx ry lry -tx -tx tx ry -ry rx -rx ltx -lry -rx lrx -Z Y X O P P T ï ï ï ï ï ï þ ï ï ï ï ï ï ý ü ï ï ï ï ï ï î ï ï ï ï ï ï í ì + + + + + + + + + + + = (10)
The manufactured parts of the hard disk are then assembled according to the selected assembly process as shown in Figure 6. The geometric deviations of all surfaces of the hard disk are described by the torsor in the model of assembled part. The principal connections between two surfaces of two parts are shown in the continuous line. The auxiliary connections between two surfaces of two parts are represented by the hidden line.
The slipping link in this case explains that two surfaces of two parts are contacted or merged together. It means that there is no gap between two surfaces. The floating link shows that two surfaces of two parts can be contacted or not. The gap can be existed between two
Set-up 0 Set-up 1 X5 Y5 Z5 O C C P5 C P2 Y Z O Platter (3) Motor (2)
connection surfaces. For example, hand arm (MMP 5) and bearing (MMP 4) are connected by two connections: principal and auxiliary connection. The principal connection is a slipping link between outer cylinder (C8) of the bearing and a cylinder (C4) of the hand arm. The auxiliary connection is a floating link between the plan (P7) of the bearing and the plan (P2) of the hand arm.
In conclusion, the geometric deviations of all surfaces of the hard disk relative to its nominal position in the product frame can be modelled according to the selected manufacturing process and the associated resources.
4. 2. Monte-carlo Simulation The Monte-Carlo simulation method is applied to simulate the geometric deviations of the hard disk based on the GDM of the hard disk during the manufacturing and assembly stages.
Firstly, it is necessary to determine the input variables of the model. In this case, the input variables are the parameters of the surface deviations torsor of the hard disk. The torsor parameters that represent the machining accuracy and the quality of the fixture surface, such as rxi,j, ryi,j, txi,j, tyi,j, tzi,j of the surface j of the part i and rxi,jSk, ryi,jSk, txi,jSk, tyi,jSk, tzi,jSk of the surface j of the fixture in the set-up k are the input variables. We propose, in this case, that input variables are the independent variables.
Figure 6. Assembly graph of the hard disk
TABLE 1.Variation range of the input variables.
Set-up 1
Fixture
Plane 5,5S1
rx5,5S1, ry5,5S1 variation range [-10-4, 10-4]
tz5,5S1 variation range [-5.10-3, 5.10-3]
Cylinder 5,7S1
rx5,7S1, ry5,7S1 variation range [-10-4, 10-4]
tx5,7S1, ty5,7S1 variation range [-5.10-3, 5.10-3]
radius ra5,7S1 variation range [-5.10-3, 5.10-3]
Machining
Cylinder 5,2
rx5,2, ry5,2 variation range [-10-4, 10-4]
tx5,2, ty5,2 variation range [-5.10-3, 5.10-3]
ra5,2 variation range [3.10-3, 8.10-3]
Plane 5,1
rx5,1, ry5, 1 variation range [-10-4, 10-4]
tz1 variation range [-5.10-3, 5.10-3]
… …
The probability distributions and the variation range of the input variables also need to be determined. The uniform distribution is used in this case. The determined variation ranges are suitable to the associated resources.
For example, the variation ranges of the input parameters to manufacture the actuator arm are shown in Table 1.
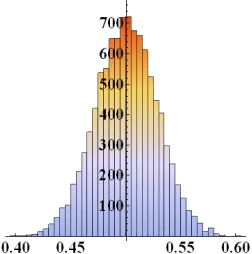
The Monte Carlo simulation is realized by the algorithm presented by Nguyen, et al. [ 16] according to the selected probability distribution and variation ranges of the input parameters. Then the product designer can use the result to verify any geometric requirements and to check the assemblability of the hard disk. For example, the designer can estimate the distribution of the clearance between the suspension tip carrying the read-and-write head and the platter of the hard disk. This clearance influences directly the quality of the hard disk. The distribution of clearance of 10000 simulations is shown in the Figure 7 (mean m = 0.5 mm, standard deviation s = 0.00277 mm).
Figure 7. Monte-Carlo simulation result of clearance
MMP5
4 2
3 1 5 6
MMP6 1
2
3 4
MMP2
1 2 3 4 5 6 7 8
9
MMP4
1 2
3
4 5 6 7
8
4
5 6
1 2 3
MMP7
MMP3
3 2
1 8
7
6
5 4
3 2 1
MMP1
Floating
Floating
Floating
Floating
Floating Floating
Slipping
Slipping
Slipping
Slipping Slipping
Slipping
MMP1: Case MMP2: Motor
MMP3: Platter MMP4: Bearing
MMP5: Hand arm
MMP6: Suspension
4. 2. Use Stage As presented in the session 4.1, the hard disk is produced in the manufacturing and assembly stage where the geometric deviations of each surface of each part are generated and accumulated on the hard disk. Basing on the GDM of the hard disk and the input data, Monte-Carlo simulation method is used to create a virtual production of the 10000 hard disks. As a result, the designer can evaluate the effects of multi-physical phenomena in production stage on the quality of the hard disk. Moreover, when hard disks produced arrive in hand of users, the quality of hard disks also depends on the effects of multi-physical phenomena in the use stage, such as thermal, aerodynamic, deformation, etc.
In this example, we focus on considering the factors that influence on the clearance between the suspension tip carrying the read-and-write head and the platter of the hard disk. Thus, we propose to use DOE method to evaluate the quality of the hard disk under the aerodynamic effects on the suspension.
4. 2. 1. Factorial Design There is only one factor (clearance) that needs to be considered in this case. Thus, we propose to use factorial design, one of the strategies of DOE method as presented by Nguyen, et al. [ 16], to integrate the geometric deviations and multi-physical phenomena into the clearance simulation of the hard disk. Two factors selected in this case are the clearance and the angle of the hand actuator relative axis OX of the global coordinate system OXYZ. · The design of experiment method used in this case is
a full factorial design 2-factors and 3-levels. The levels of each selected parameter are chosen in the following:
· High level at +3s (1)
· Medium level at m (0) (average value of the parameter)
· Low level at -3s (-1)
From the result of Monte-Carlo simulation, the value of clearance varies in a range 6s from [0.417, 0.584].
The variation range of angle of the hand arm is chosen based on workspace of hand arm. In this case, the hand arm of the hard disk works from 30° to 66° according to axis OX in the Figure 4.
4. 2. 2. FEM and CFD Simulation Based on the 9 results of FEM simulation, the mathematic relationship between the deformation of the suspension tip and clearance, rotation angle of the suspension tip can be established by linear regression model. From this relationship, the product designers can know how the clearance will be changed in the use stage by effect of aerodynamic and thermal phenomena. As a result, they can verify the “real” performance of the hard disk designed satisfying the requirement of the clients.
From the selected parameters, we will create the deviated model of the hard disk with value of the selected deviation parameters in the Table 2. There are 32 = 9 deviated models that are created by the CAD software. Then we will use them for simulating the effect of aerodynamic on the clearance by using Computational Fluid Dynamics software. The simulation results of 9 deviated models are shown in Figure 8.
In order to take into the effect of aerodynamic phenomena on the suspension tip of hard disk, we use finite element method (FEM) to calculate the deformation of the suspension tip. In this case, we use ANSYS software to calculate the deformation of the suspension tip of the hard disk. The results of FEM simulation are shown in Figure 9.
TABLE 2.The value of the selected factors.
Clearance (mm) Angle (deg)
High level (1) 0.584 66
Medium level (0) 0.5 48
Low level (-1) 0.417 30
In
cr
ea
se
o
f
ro
ta
tio
n
de
gr
ee
Figure 8. Results of CFD simulation on aerodynamic effect
5. CONCLUSION
The paper proposes a new methodology for integration of geometric deviations of product and effects of multi-physical phenomena into the analysis of product performance. Basing on the geometric deviation model and Monte-Carlo simulation method, the product designer can determine the relationship between the performance of product and the parameters of variation sources during the product life cycle. From the result of the Monte Carlo simulation, using the established relationship, an image of the performance of the population of products virtually manufactured is calculated. Then, the product designer can identify and classify the effect of each parameter of variation source on the product performance based on the result of the Monte-Carlo simulation and the corresponding performance for each virtual product.
In future, the variance of the performance of the complex product will be considered to calculate under effects of multi-physical phenomena throughout its life cycle. Further, it could lead to the optimization of the design in order to obtain reach robust design.
6. REFERENCES
1. Ramesh, R., Mannan, M. A. and Poo, A. N., “Error
compensation in machine tools - a review - Part I: geometric,
cutting-force induced and fixture-dependent errors”,
International Journal of Machine Tools & Manufacture, Vol. 40, (2000), 1235-1256.
2. Ramesh, R., Mannan, M. A. and Poo, A. N., “Error
compensation in machine tools — a review: Part II: thermal
errors”, International Journal of Machine Tools &
Manufacture, Vol. 40, (2000), 1257-1284.
3. Parkinson, A., “Robust Mechanical Design Using Engineering
Models”, Journal of Mechanical Design, Vol. 117 (1995), No.
B, pp. 48-54.
4. Yu, J.-C., and Ishii, K., “Design for Robustness Based on
Manufacturing Variation Patterns”, Journal of Mechanical
Design, Vol. 120, (1998) No. 2, 196-202,
5. Zhu, J., and Ting, K., “Performance Distribution Analysis and
Robust Design”, Journal of Mechanical Design, Vol. 123,
(2001) No. 1, 11-17.
6. Liu, H., and Chen, W., “Relative Entropy Based Method for
Probabilistic Sensitivity Analysis in Engineering Design”,
Journal of Mechanical Design, Vol. 128, (2006), No. 2, 326-337.
7. Bruyère, J., Dantan, J.-Y., Bigot, R., and Martin, P., “Statistical
tolerance analysis of bevel gear by tooth contact analysis and
Monte Carlo simulation”, Mechanism and Machine Theory,
Vol. 42, (2007), 1326–1351.
8. Yin, X., Lee, S., Chen, W., Liu, W. K., and Horstemeyer,
M. F., “Efficient Random Field Uncertainty Propagation in
Design Using Multiscale Analysis”, Journal of Mechanical
Design, Vol. 131, (2009), No. 2, 021006-10.
9. Kimura, F., “Modeling, Evaluation and Design of Product
Quality under Disturbances throughout the Total Product Life
Cycle”. In: HEIDELBERG, SPRINGER BERLIN (ed.) The
Future of Product Development, (2007), 675-684.
10. Nguyen, D.S, Vignat, F., and Brissaud, D., “Geometric deviation
model of product throughout its life cycle”, International
Journal of Manufacturing Research, Vol. 6, (2011), No.3, 236-255.
11. Vignat, F., and Villeneuve, F., “Simulation of the Manufacturing
Process, Generation of a Model of the Manufactured Parts”,
Digital Enterprise Technology, US, Springer, ed., (2007),
545-552.
12. Bourdet, P., Mathieu, L., Lartigue, C., and Ballu, A., “The
concept of the small displacement tosor in metrology”.
Advanced Mathematical Tools in Metrology II, Edited by World Scientific Publishing Company, Series Advances in Mathematics
for Applied Sciences, Vol. 40, (1996), 110-122.
13. Thiebaut, F., “Contribution à la définition d’un moyen unifié de
gestion de la géométrie réaliste basée sur le calcul des lois de
comportement des mécanismes”, PhD thesis, ENS de Cachan,
France, (2001).
14. Nguyen, D.S, Vignat, F., and Brissaud, D., “Taking into account
geometric variation effect on product performance”,
International Journal of Product Life cycle Management, Vol. 5, (2011), No. 2/3/4, 102-121.
15. Rao, C.R., and Toutenburg, H., “Linear Models: Least Squares
and Alternatives”. Springer series in Statistics, Springer, (1995).
16. Nguyen, D.S, Vignat, F., and Brissaud, D., “Integration of
geometrical deviations thougout product life cycle into
performance simulation”, Proceedings of the 10th Global
A Methodology for Product Performance Analysis under Effects of Multi-physical
Phenomena
N. Dinh Son
Danang University of Technology, The University of Danang, 54 Nguyen Luong Bang, Danang, Vietnam
P A P E R I N F O
Paper history: Received 9 Junuary 2012
Received in revised form 21 May 2012 Accepted 30 August 2012
Keywords: Performance Analysis Product Life Cycle Geometric Deviation Model Manufacturing Simulation هﺪﯿﮑﭼ ﻪﻌﺳﻮﺗ ﻢﻠﻋ و ﻦﻓ ،يروآ ﺮﺗﻮﯿﭙﻣﺎﮐ ار ﻪﺑ ﮏﯾ راﺰﺑا ﺪﯿﻔﻣ ياﺮﺑ ﺖﯾﺎﻤﺣ زا ﺖﯿﻟﺎﻌﻓ يﺎﻫ ﯽﺳﺪﻨﻬﻣ رد ﯽﺣاﺮﻃ ﻻﻮﺼﺤﻣ ت ، ﻞﯾﺪﺒﺗ هدﺮﮐ ﺖﺳا . يرﺎﯿﺴﺑ زا يﺎﻫراﺰﺑا ﯽﺒﻧﺎﺟ ﺮﺗﻮﯿﭙﻣﺎﮐ ﻫ ﺪﻨﻧﺎﻤ : ﯽﺣاﺮﻃ / ﺖﺧﺎﺳ ﺑ ﻪ ﮏﻤﮐ ﺮﺗﻮﯿﭙﻣﺎﮐ )
CAD / CAM
( ، ﻞﺻﺎﺣ ﺖﯾﺮﯾﺪﻣ هداد ﺎﻫ ) PDM ( ، ﯽﺑﺎﯾزرا ﻪﺧﺮﭼ ﺮﻤﻋ لﻮﺼﺤﻣ ) PLA ( ، و ،هﺮﯿﻏ
ﯽﺠﯾارترﻮﺻﻪﺑ
رد ﺖﻌﻨﺻ ، ياﺮﺑ ﺶﻫﺎﮐ نﺎﻣز ﻪﻌﺳﻮﺗ لﻮﺼﺤﻣ و ﺶﯾاﺰﻓا ﺖﯿﻔﯿﮐ لﻮﺼﺤﻣ هدﺎﻔﺘﺳا ﯽﻣ دﻮﺷ . رد ،ﻪﺠﯿﺘﻧ نﺎﺣاﺮﻃ لﻮﺼﺤﻣ ﻪﺑ ﯽﺘﺣار ﯽﻣ ﻧاﻮﺗ ﻨﺪ لﺪﻣ يﺎﻫ يدﺪﻋ زا لﻮﺼﺤﻣ ار ﺮﺑ سﺎﺳا ﻦﯾا ﺎﻫراﺰﺑا دﺎﺠﯾا ﻨﻨﮐ ﺪ . ﺎﺑ ﻦﯾا ،لﺎﺣ ﻧآ ﺎﻬ ﺎﻬﻨﺗ ﯽﻣ ﻧاﻮﺗ ﻨﺪ تﺎﻋﻼﻃا يرﻮﺳ زا لﻮﺼﺤﻣ ﻪﺘﺷاد ﺷﺎﺑ ﻨﺪ . ﻦﯾا ﺖﺳا ﻪﮐ ردﺎﻗ ﻪﺑ ،ﯽﺑﺎﯾزرا عاﻮﻧا ﻒﻠﺘﺨﻣ ﺮﺛا تا ﯽﮑﯾﺰﯿﻓ ﻪﮐ لﻮﺼﺤﻣ رد لﻮﻃ ﻞﮐ ﻪﺧﺮﭼ ﺮﻤﻋ ، ﻪﺑ هﮋﯾو رد نﺎﻣز ﺪﯿﻟﻮﺗ و ژﺎﺘﻧﻮﻣ و رد ﻪﻠﺣﺮﻣ هدﺎﻔﺘﺳا زا
ارددﺮﮔﯽﻣﻞﻤﺤﺘﻣ،نا
ﺪﻨﺷﺎﺑﯽﻤﻧ . دﺮﮑﻠﻤﻋ ﺰﯿﻟﺎﻧا لﻮﺼﺤﻣ ﺮﺑ سﺎﺳا ﻦﯾا لﺪﻣ ﯽﺠﯾﺎﺘﻧ را ﺖﺳدﻪﺑ ﯽﻣ ﺪﻫد ﻪﮐ دﺮﮑﻠﻤﻋﺎﺑ لﻮﺼﺤﻣ ﯽﻌﻗاو توﺎﻔﺘﻣ ﺖﺳا . ﻪﺑ ا ﻦﯾ ،ﻞﯿﻟد ﺖﯿﻔﯿﮐ لﻮﺼﺤﻣ ﯽﺣاﺮﻃ هﺪﺷ ﺪﻧاﻮﺗﯽﻤﻧ ﻪﺑ رﻮﻃ ﻞﻣﺎﮐ يﺎﻫزﺎﯿﻧ نﺎﯾﺮﺘﺸﻣ و ناﺮﺑرﺎﮐ ار ﻦﯿﻣﺎﺗ ﺪﻨﮐ . ،ﻦﯾاﺮﺑﺎﻨﺑ رد ﻦﯾا ﻪﻟﺎﻘﻣ ﮏﯾ شور ﻊﻣﺎﺟ دﺎﻬﻨﺸﯿﭘ هﺪﺷ ﺖﺳا ﻪﮐ ﻪﯿﺒﺷ يزﺎﺳ دﺮﮑﻠﻤﻋ ﺪﻨﭼ ﺮﺛا ﯽﮑﯾﺰﯿﻓ رد ﺮﺳاﺮﺳ ﻪﺧﺮﭼ ﺮﻤﻋ لﻮﺼﺤﻣ
نﺎﻣﺰﻤﻫترﻮﺻﻪﺑار
هزﺎﺟا ﯽﻣ ﺪﻫد . زا ﻊﺑﺎﻨﻣ ﯽﺗوﺎﻔﺘﻣ رد لﻮﻃ ﻪﺧﺮﭼ ﺮﻤﻋ لﻮﺼﺤﻣ
ناﺰﯿﻟﺎﻧادﺮﮑﻠﻤﻋياﺮﺑو