International Journal of Engineering
J o u r n a l H o m e p a g e : w w w . i j e . i rMapping CRC Card into Stochastic Petri Net for Analyzing and Evaluating Quality
Parameter of Security
a Department of ComputerEngineeringr,Islamic Azad Univresity , Sari Branch,Iran
b
P A P E R I N F O
Paper history: Received 20 May 2013
Received in revised form 23 September 2013 Accepted 07 November 2013
Keywords: CRC Cards Mapping Stochastic Petri Net Security Evaluation
A B S T R A C T
CRC cards are unconventional methods for identifying and describing classes, behavior and their responsibilities and collaborators of class. Representation of three categories of class, responsibilities and collaborators can give proper image of the scenario. These cards are effective method for analyzing scenarios. With all positive features of CRC cards, these cards have some weaknesses such as failure to show details of operations and failure to evaluate them. These weaknesses guide us to model and evaluate these cards using petri nets. Basis of petri nets is on graph. In addition, these petri nets have mathematical structure and definitions, they have graphics. One of the other important characteristics of petri nets is their applicability which can be used for evaluating behavior and efficiency of a system. Therefore, our goal in this paper is to map CRC cards into stochastic petri net for evaluating and analyzing quality parameter of security.
doi: 10.5829/idosi.ije.2014.27.05b.03
1. INTRODUCTION1
CRC cards were introduced in 1989 by Kent Beck and Ward Cunnigham. CRC cards are in fact a laboratory for developing collaboration and reviewing an object-oriented design [1]. Amber describes CRC cards as follows: CRC cards are in fact a set of index cards which show classes. These cards are divided into three parts. On top of the card, name of the class is written. On the left side of the card body, a list of class responsibilities is written and on the right side, participants are written [2]. CRC cards are unconventional method for identifying and describing classes, their behavior and responsibilities and collaborators (other classes) with which they perform their tasks. Each CRC card is comprised of three parts. The first part is class name and responsibilities and collaborators are its next parts. Responsibilities are the tasks which an object should perform and collaborators help object to perform some tasks. Figure 1 shows a CRC card.
*Corresponding Author Email: [email protected] (M. Nemati)
Class Name:
Collaborators Responsibilities
Figure 1. An example of a CRC card
Representation of three categories of class, responsibilities and collaborators can give suitable image of scenario. These cards are effective method for analyzing scenarios. With all positive features of CRC cards, of weaknesses of these cards are failure to show details of operations and failure to evaluate them. These weaknesses guide us to model and evaluate these cards using petri nets. petri nets are regarded as suitable instruments for mathematical and graphic modeling. These instruments can be used for modeling, describing and analyzing the systems which have synchronous, asynchronous, distributed, parallel, indefinite and stochastic.
TECHNICAL NOTE
a b*
H. Motameni , M. Nemati
2. REFINING CRC CARDS
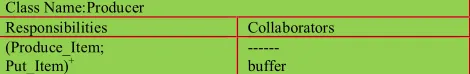
CRC cards are changeable and flexible; therefore, one can make changes in it for increasing their application [3]. One of the refinements of these cards is addition of path expression to them [4]. The path expression was introduced by Campbell and Habermann as a method for specifying all processes [5]. CRC cards are refined by limiting applicability order of responsibilities and using the path expressions. In these cards, applicability order of responsibilities is based on sequential, conditional, iterative and synchronous structure of responsibilities for which special marks have been used. Figure 2 shows a refined card with the path expression. As shown in the figure, operator “+” iteration shows iterative responsibilities or behavior of a role, the parenthesis is set of the responsibilities which should be iterated and shows applicability order of responsibilities [5]. Table 1 shows operators used for refining CRC cards.
Class Name:Producer
Collaborators Responsibilities
--- buffer (Produce_Item;
Put_Item)+
Figure 2. A refined card with the path expression
TABLE 1. Operators used for refining CRC cards. Operator Task
+ Shows at least one iterative responsibilities
* Shows zero or more iterative responsibilities
: Parallel execute for responsibilities
; Sequence execute for responsibilities
() Set of the responsibilities
Figure 3. A stochastic petri net
3. STOCHASTIC PETRI NET
Petri net is a quintuple as N=(P,T,F,W,M0) in which P
is a finite set of arcs (shown with circle) , T is a finite set of transforms (shown with rectangle) , F is set of
arcs. N arc connects a transform to a location or a location to transform. : →{1,2,… } is a set of weight functions. : →{1,2, … } is primary mark. ∩ = ø and ∪ ≠ ∅ [6]. A transform is active if and only if each one of its input locations include at least one token. Firing each transform excludes one mark from each one of the input locations and includes it in each one of the output locations. Stochastic petri nets are a kind of petri nets with timed transforms, each having a stochastic variable with negative exponential distribution as firing rate. Stochastic petri net is as SPN=(P,T,F,W,M0,λ)
where P,T,F,W,M0 is similar to the cases mentioned for
the petri net and λ= { , , … , | |} is set of mean transforms firing rates. In fact, stochastic petri net is obtained by attributing a stochastic variable with exponential distribution to transforms. Malvi showed that stochastic petri net was isomorphic to Markovapproach modeling considering memoryless exponential distribution. In this regard, one can use theory of Markov’s analysis techniques for analyzing petri nets. In fact, stochastic petri nets combine power of petri nets and Markov’s processes. Figure 3 shows a stochastic petri net with four transforms and firing rate of each one of them [7].
4. MAPPING CRC CARDS INTO PETRI NET
For mapping CRC cards into petri net, first, each card is individually converted to its equivalent petri net and finally petri nets created from these cards will be combined. When converting each card into petri net, it is assumed that, transitions are activity of a responsibility inside the card, and places show precondition for a transition to be triggered. So, for mapping CRC cards into petri net, for each task inside the card, a place is drawn which shows the operation inside the card. Then the places are connected to each other, in the order of calling operations inside the card. If interactions between cards are synchronous, operation that is related to another card (need an operation in another card), connected to next operation with dotted line, until in next stage, this relationship is completed. Arcs between places and transitions in a card show cards transition from one state to another. According to variant types of path expressions between operations, final petri net, for each path expression is defined as follows and grapghical view are shown in Table 2:
executed. In fact, one sequential path, with two responsibilities, exactly act like a petri net with two transitions connected to each other with one place.
4. 2. Selection Structure While operator “,” is used between two operations of one card, means one of these operations must be selected and executed. The third row in Tables 2 and 3 show selection of one of the operations A1 and A2 in petri net. According to Figure 3, one of the two operations must be selected and executed. In equivalent petri net, operation selection condition, are added to the related arcs and transitions.
4. 3. Parallel Structure The forth row in Tables 2 and 3 show parallel execution of two operations and equivalent petri net. In this net, A1 is executed first and then when its transition being triggered, two operations A1 and A2 will be executed parallel.After A1 and A2 executions end, A4 transition starts.
4. 4. Repeat Structure In this structure, one or more operations are repeated several times or under some conditions. The fifth row in Tables 2 and 3 show selection structure (while) and its equivalent operations. In Figure 3, after A1 transition being triggered, A2 transition will be triggered until condition is established and if conditions are not established, A3 transition will be triggered. Condition related to selection of A2 and A3, is determined on their related entrance arc and transition.The sixth row in Tables 2 and 3, show repeat structure (Repeat-until) of A2 operation and its related petri net. In figure 3, after A1 transition being triggered , A2 transition will be triggered suddenly and if condition is established, that transition will be triggered several times, if not, A3 transition will be triggered. In summary, stages of algorithm for mapping CRC cards into petri net are as follows:
A. Identifying CRC cards for the desired system B. Refining CRC cards using the path expression C. Mapping each card into its equivalent petri net
separately
D. Combining petri nets resulting from stage C
5. EVALUATING AND ANALYZING SECURITY QUALITY PARAMETER
Software is available in most parts of our society. Unsecure software can allow the intruder to control the program. When lives and opportunities depend on software, it is important to ensure security of a problem. Modeling and prediction of software security in software design phase allow research and comparison of different solutions for the final system before real implementation. Sensitivity analysis of parameters enables the model to identify security constraints. In the literature [6], security evaluation has been studied based
on stochastic petri nets. Assume that each software component includes the vulnerability which can be at risk. An unsuccessful component can be repaired with some methods. A software system includes several hierarchical, sequential, parallel, loop components and selective styles. Figure 4 shows a simple model of a component with a stochastic petri net. For easy description, ci is used as representative of the model.
Transform tieshows normal behavior of the component
whose execution rate is . Attacking the component by a burglar has been shown with transform . Attack transform rate is . A token which has emerged in place is called failure place which indicates that component of has been exposed. After being exposed, a recovery action should be done. Transform shows recovery action after being exposed. Probability distribution rate allocated to is . A token which emerges in place is called success place which indicates that the component has been successfully executed. is input place and is output place[6]. Model of Figure 4 can be applied for quantitative evaluation of security of a component and sensitivity analysis affected by different rates of ، and .
6. CASE STUDY
In this paper, we convert the CRC cards of the studied system and refinement after identifying them. Considering memoryless property of the exponential distribution, delay in firing of transforms, stochastic petri net is isomorphic to continuous time Markov approach modeling. In this paper, the method presented in the literature [8] has been used to evaluate distribution of accessible steady states probability. For this purpose, first we obtain Markov approach modeling equivalent to stochastic petri net and then we analyze effect of each one of transform rates according to the literature [6]. General trend of the case study of this paper is as the following flowchart. For example, we consider an ATM system located in bank and follow stages of mapping. ATM performs bank operations for the applicant for service. ATM is used at any time only by one person [4]. Main even flow of ATM is such that first the customer puts his card inside ATM system.
TABLE 2. Mapping CRC card into petri net table
Equivalent in petri net
CRC card Responsibility Sequential structure Selection structure
Equivalent in petri net
CRC card Parallel structure Repeat structure of while loop Repeat structure of repeat-until loop
Figure 5. General trend of mapping stages
Figure 6. Refined CRC cards with path expression of an ATM system
Figure 7. Conversion of each ATM system cards into its equivalent petri net
Figure 8. Petri net obtained from mapping of CRC cards of ATM System
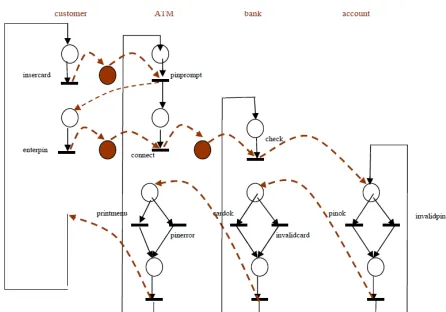
After obtaining petri net equivalent to the refined CRC cards, it is time to obtain stochastic petri net for evaluating security. In this stage, we obtain stochastic petri net model for evaluating security as mentioned in section 5 of the paper. In case of the widespread and complex system to be studied, hierarchical stochastic petri net can be also used. In stochastic petri net, possibility of separation and hierarchical structure for creating structure is used to study and correct the model more easily. Figure 9 shows stochastic petri net resulting from the previous stage. As observed, we have
11 components among which components
, , , , have been placed next to each other as sequential model and components , and , and
, are placed next to each other as selective model.
Now, it is necessary to obtain transform matrix of each component to evaluate sensitivity analysis and security of each component to obtain probability distribution of each place by solving Markov steady state equations. For example, states transform matrix is obtained according to Equations (1) to (3) considering the first component (component of inserting card) and we reach relation 4 by solving this equation:
= −( + ) − 0
0 − (1)
= ( ), ( ), ( ) (2)
= 0
( ) + ( ) + ( ) = 1 (3)
⎩ ⎪ ⎨ ⎪
⎧ ( ) = ( ) =
( ) =
(4)
Considering that indicated that ATM system was exposed at time of inserting card, then, the exposed probability of component 1 I equals to relation 5.
= ( ) =
(5)
The way of obtaining exposed probability of other components is similar to way of calculating exposed probability of the first component. In summary, the paper has avoided mentioning details of obtaining them and we only mention the final formula of each component in relations 6 to 16.
= ( ) =
(6)
= ( ) =
(7)
= ( ) =
(8)
= ( ) =
(9)
= ( ) =
(10)
= ( ) =
(11)
= ( ) =
(12)
= ( ) =
(13)
= ( ) =
(14)
= ( ) = (15)
= ( ) = (16) After calculating expose probability of each component, we should calculate total expose probability. Considering that components of , , , are placed next to each other sequentially, components , and , and , are placed next to each other selectively and there is only one choice between two components. Now, one can write general formula of expose probability according to relation 17 considering specifying how to place the components next to each other:
= ∗ ∗ ∗ ∗ ∗
( | )∗( | )∗( | ) (17)
Figure 9. ATM system stochastic petri net model to evaluate and analyze quality parameter of security
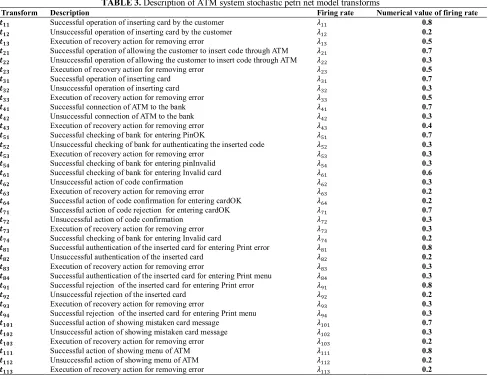
TABLE 3. Description of ATM system stochastic petri net model transforms
Numerical value of firing rate Firing rate
Description Transform
0.8
Successful operation of inserting card by the customer
0.2
Unsuccessful operation of inserting card by the customer
0.5
Execution of recovery action for removing error
0.7
Successful operation of allowing the customer to insert code through ATM
0.3
Unsuccessful operation of allowing the customer to insert code through ATM
0.5
Execution of recovery action for removing error
0.7
Successful operation of inserting card
0.3
Unsuccessful operation of inserting card
0.5
Execution of recovery action for removing error
0.7
Successful connection of ATM to the bank
0.3
Unsuccessful connection of ATM to the bank
0.4
Execution of recovery action for removing error
0.7
Successful checking of bank for entering PinOK
0.3
Unsuccessful checking of bank for authenticating the inserted code
0.3
Execution of recovery action for removing error
0.3
Successful checking of bank for entering pinInvalid
0.6
Successful checking of bank for entering Invalid card
0.3
Unsuccessful action of code confirmation
0.2
Execution of recovery action for removing error
0.2
Successful action of code confirmation for entering cardOK
0.7
Successful action of code rejection for entering cardOK
0.3
Unsuccessful action of code confirmation
0.3
Execution of recovery action for removing error
0.2
Successful checking of bank for entering Invalid card
0.8
Successful authentication of the inserted card for entering Print error
0.2
Unsuccessful authentication of the inserted card
0.3
Execution of recovery action for removing error
0.3
Successful authentication of the inserted card for entering Print menu
0.8
Successful rejection of the inserted card for entering Print error
0.2
Unsuccessful rejection of the inserted card
0.3
Execution of recovery action for removing error
0.3
Successful rejection of the inserted card for entering Print menu
0.7
Successful action of showing mistaken card message
0.3
Unsuccessful action of showing mistaken card message
0.2
Execution of recovery action for removing error
0.8
Successful action of showing menu of ATM
0.2
Unsuccessful action of showing menu of ATM
0.2
Execution of recovery action for removing error
TABLE 4. Expose probability of components Value of SAP Name of component
0.181 Insert Card
0.260 Pin Promt
0.260 Enter Pin
0.306 Connect
0.337 Check
0.454 Pin OK
0.344 Invalid Pin
0.240 Card OK
0.240 Invalid Pin
0.468 Print Error
0.357 Print Menu
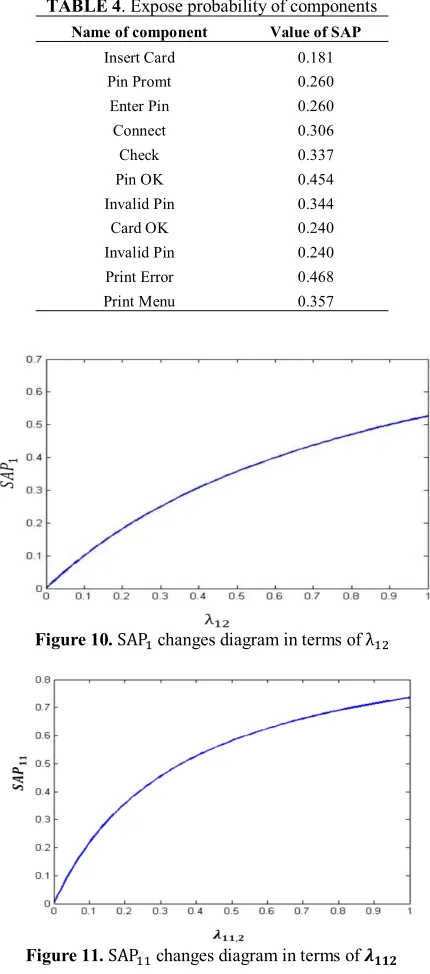
Figure 10.SAP changes diagram in terms of λ
Figure 11.SAP changes diagram in terms of
Figure 12- SAP1 changes rate diagram in terms of 12
To observe effect of transforms rates which result in failure mode in each component, rates of which are = 1,2, … 11 , one can draw SAP diagram in terms of and we do this work for the first and last component i.e. insertion of card and component of showing ATM menu. For this purpose, we consider rates of ، ، و as 0.8, 0.5, 0.8 and 0.2 in terms of Table 1 and values of 0≤ و ≤1 and
draw diagram of relation 5 which relates to SAP as well as relation 16 relating to SAP . These diagrams are
observed in Figures 10 and 11.
To observe effect of changes in transforms rates which result in failure mode in each component, one can derive SAP functions in terms of λ to observe rate of
changes. For this purpose, we derive SAPfunctions in terms of λ and SAP in terms of λ . Relation 18 and
19 show derivative of two functions. We consider rates of λ ،λ ،λ وλ as 0.8, 0.5, 0.8 and 0.2 in terms
of Table 1 and values of 0≤λ & λ ≤1 and draw
diagram of relation 5 which relates to SAP as well as relation 16 relating to SAP . These diagrams are observed in Figures 12 and 13.
( )
=
( ) (18)
( )
=
( ) (19)
As shown in Figures 10 and 11, when values of λ and
λ are reduced to zero, values of SAPand SAP will
be also reduced. Figures 12 and 13 show that when
λ changes increase, SAPchanges value will also
decrease. We can find that we can focus on λ s rate to
make this component more secure and include the actions which lead to reduction of this value on top of the list. One can observe effect of λ s rate on SAPby
doing so for other components. Now, we consider a successful execution of scenario considered in this thesis leading to successful execution and finally showing of ATM menu. Expose probability can be calculated.
Figure 14. Execution of a successful scenario
Successful execution tend of scenario is shown in Figure 14. As shown in this figure, the customer having inserted card is able to insert code, he inserts the code and waits for connection of ATM with customer account database to authenticate the inserted code and in case the inserted card code is valid, the menu which ATM is able to perform the action is shown to the customer. Considering execution of the general scenario, expose probability is calculated as follows:
= ∗ ∗ ∗ ∗ ∗
∗ ∗ (20)
By putting numerical values in Table 2, SAP = 3.47 × 10 is obtained for expose probability. After obtaining
total expose probability, we can focus on reduction of the expose probability of each component to reduce this value and for this purpose; we should reduce λ rates
which are transform rates of failure mode. For this purpose, we reduced values of λ and λ from 0.2 to
0.1 and as a result, value of SAP was equal to 0.100 and value of SAP was equal to 0.217. Now, if we calculate expose probability value with new values, SAP = 1.917 × 10 will be obtained. It is found that we could
reduce total expose probability by focusing on reduction of exposed states transform rates.
7. DISCUSSION
As observed in Table 2, we could calculate expose probability of each component considering formula of each component. As shown in Figures 10 and 11, one can focus on reduction of λ rate to reduce expose
probability of each component. In fact, it can be mentioned that considering that λ s are transforms
activation rate leading to inclusion of the component in failure mode, main way of reducing expose probability of each component is to reduce rate of transforms which are in failure mode. For example, if rate of λ is
reduced from 0.2 to 0.1 in Table 1, then, expose probability value will be reduced from 0.181 to 0.100. Another point which should be mentioned as in Figures 10 and 11 is that it answers this question that if this is logical or doesn’t consider the representation of relation between λ and SAP. With expose probability of each
component, we considered the desired scenario in execution of ATM and obtained its total expose formula from formula 17 by substituting its numerical value and
we did so, considering possible scenario of total scenario and we could obtain total expose probability for the desired scenario in Figure 14. In fact, it is necessary to note that formula 17 is a general formula for calculating total expose probability and cores any trend which may occur in ATM. To reduce the number obtained for total expose probability, it is necessary to reduce firing rate of transforms leading to failure mode in each component.
8. CONCLUSION
In this paper, a method was introduced for mapping CRC cards into petri net to evaluate quality parameter of security and the proposed method was studied with bank ATM system. Considering ATM system available in a bank and using the method presented for it, we can reach the following results:
1. ATM system components were described using CRC cards and duties of each component were specified by refining cards with the path expression. 2. Extraction of petri net from CRC cards was
described for ATM system.
3. Stochastic petri net model was obtained for evaluating quality parameter of security.
4. For each component available in ATM system, expose probability was calculated and finally, total expose formula was calculated.
5. The presented model is changeable and flexible. For example, if components of the system increase, the desired changes in general formula can be easily calculated considering location of the new component relative to the previous components (sequential and parallel state).
6. The proposed method can be utilized to fulfill qualitative needs because one of the concerns of software engineers is development of the appropriate products so that it fulfills functionality and non-functionality needs of the system and is supplied to the customers with low expense. Unfortunately, fulfillment of the qualitative needs of software engineering is in its primitive stage while qualitative needs have considerable effect on success of software success. In one hand, if the designer prepares a software system and the analyst assesses security need therein; the system may require essential changes while spending time, cost and even it should be set aside and developed again. Therefore, to solve this problem, qualitative needs such as security should be evaluated and analyzed in development process to make changes at the beginning of the development process in case it is not fulfilled.
parameters on each other and particularly on quality parameter of security.
9. REFERENCES
1. Börstler, J., "Classes or objects? crc-cards considered harmful", in 1st Scandinavian Pedagogy of Programming Workshop, Citeseer, (2004)
2. Pressman, R. S. and Jawadekar, W. S., "Software engineering",
New York, (1987).
3. Aliee, F. S., "Modelling the behaviour of processes using collaborating objects", The University of Manchester, (1996)
4. Emadi, S. and Shams, F., "From UML component diagram to an executable model based on petri nets", in Information
Technology .ITSim. International Symposium on, IEEE. Vol. 4, (2008), 1-8.
5. Campbell, R. H. and Habermann, A. N., "The specification of process synchronization by path expressions, Springer, (1974)
6. Yang, N., Yu, H., Qian, Z. and Sun, H" ,.Modeling and quantitatively predicting software security based on stochastic Petri nets", Mathematical and Computer Modelling, Vol. 55, No. 1, (2012), 102-112.
7. Motameni, H., Movaghar, A. and Amiri, M. F., "Mapping activity diagram to petri net: Application of markov theory for analyzing non-functional parameters", International Journal of Engineering Transactions B Applications, Vol. 20, No. 1, (2007), 65.
Mapping CRC Card into Stochastic Petri Net for Analyzing and
Evaluating Quality Parameter of Security
TECHNICAL NOTE
a Department of ComputerEngineeringr,Islamic Azad Univresity , Sari Branch,Iran
b
P A P E R I N F O
Paper history: Received 20 May 2013
Received in revised form 23 September 2013 Accepted 07 November 2013
Keywords: CRC Cards, Mapping, Stochastic Petri Net, Security Evaluation.
هﺪﯿﮑﭼ
يﺎﻫترﺎﮐ
CRC
سﻼﮐنارﺎﮑﻤﻫوﺎﻫنآيﺎﻫﺖﯿﻟﻮﺌﺴﻣورﺎﺘﻓر،ﺎﻫسﻼﮐﻒﯿﺻﻮﺗوﯽﯾﺎﺳﺎﻨﺷياﺮﺑﯽﻤﺳرﺮﯿﻏﯽﺷور
ﺖﺳا
.
ﺪﻫدﻪﺋاراارﻮﯾرﺎﻨﺳزاﯽﺒﺳﺎﻨﻣيﺎﻤﻧﺪﻧاﻮﺗﯽﻣﻢﻫرﺎﻨﮐردنارﺎﮑﻤﻫوﺎﻫﺖﯿﻟﻮﺌﺴﻣ،سﻼﮐﻪﻟﻮﻘﻣﻪﺳﺶﯾﺎﻤﻧ
.
ترﺎﮐﻦﯾا
يﺮﺛﻮﻣشورﺎﻫ
ﺪﻨﺘﺴﻫﺎﻫﻮﯾرﺎﻨﺳﻞﯿﻠﺤﺗياﺮﺑ
.
يﺎﻫترﺎﮐﺖﺒﺜﻣيﺎﻫﯽﮔﮋﯾومﺎﻤﺗﺎﺑ
CRC
ﺎﻫترﺎﮐﻦﯾاﻒﻌﺿطﺎﻘﻧزا
دﺮﮐهرﺎﺷاﺎﻫنآﯽﺑﺎﯾزرامﺪﻋوتﺎﯿﻠﻤﻋتﺎﯿﺋﺰﺟﺶﯾﺎﻤﻧنﺎﮑﻣامﺪﻋﻪﺑناﻮﺗﯽﻣ
.
يﻮﺳوﺖﻤﺳﻪﺑارﺎﻣﻒﻌﺿطﺎﻘﻧﻦﯾا
نﻮﻤﻨﻫريﺮﺘﭘيﺎﻫﻪﮑﺒﺷزاهدﺎﻔﺘﺳاﺎﺑﺎﻫترﺎﮐﻦﯾاﯽﺑﺎﯾزراويزﺎﺴﻟﺪﻣ ﺪﯿﺋﺎﻤﻧﯽﻣ
.
ﻪﮑﺒﺷسﺎﺳا
ﺎﻨﺑ،فاﺮﮔﻪﯾﺎﭘﺮﺑيﺮﺘﭘيﺎﻫ
ﺖﺳاهﺪﺷهدﺎﻬﻧ
.
رادﻮﺧﺮﺑﺰﯿﻧﯽﮕﯿﻓاﺮﮔﺶﯾﺎﻤﻧزاﺪﻨﺘﺴﻫﯽﺿﺎﯾرﻒﯾرﺎﻌﺗورﺎﺘﺧﺎﺳيارادﻪﮑﻧآﺮﺑهوﻼﻋيﺮﺘﭘيﺎﻫﻪﮑﺒﺷ
ﺪﻨﺷﺎﺑﯽﻣ
. .
ياﺮﺑناﻮﺗﯽﻣﺖﯿﺻﺎﺧﻦﯿﻤﻫزاﻪﮐﺖﺳاﺎﻫنآندﻮﺑاﺮﺟاﻞﺑﺎﻗيﺮﺘﭘﻪﮑﺒﺷﻢﻬﻣتﺎﯿﺻﻮﺼﺧزاﺮﮕﯾدﯽﮑﯾ
ا دﺮﺑهﺮﻬﺑﻢﺘﺴﯿﺳﮏﯾﯽﯾارﺎﮐورﺎﺘﻓرﯽﺑﺎﯾزر
.
يﺎﻫترﺎﮐﺖﺷﺎﮕﻧﻪﻟﺎﻘﻣﻦﯾاردﺎﻣفﺪﻫاﺬﻟ
CRC
ﺎﺑﯽﻓدﺎﺼﺗيﺮﺘﭘﻪﮑﺒﺷﻪﺑ
ﺪﺷﺎﺑﯽﻣﺖﯿﻨﻣاﯽﻔﯿﮐﺮﺘﻣارﺎﭘﻞﯿﻠﺤﺗوﯽﺑﺎﯾزرافﺪﻫ
.
doi: 10.5829/idosi.ije.2014.27.05b.03
a b
H. Motameni , M. Nemati

![Figure 4. Stochastic petri net for evaluating security of a component ( ) [6]](https://thumb-us.123doks.com/thumbv2/123dok_us/232773.2017883/3.595.376.479.650.731/figure-stochastic-petri-net-evaluating-security-component.webp)