*Corresponding author:Rittu Dhir ISSN: 0976-3031
Research Article
ACADEMIC ACHIEVEMENT AND NUTRITIONAL STATUS – A STUDY ON SECONDARY SCHOOL
STUDENTS IN LUDHIANA DISTRICT
Rittu Dhir
Department of Home Science, Master Tara Singh Memorial College for Women,
Ludhiana, Punjab, India
ARTICLE INFO ABSTRACT
For accomplishment of any task in an individual’s life; one’s physical health is very important. The important role of nutrition in the aspect of academic achievement cannot be ignored. The present study was undertaken to investigate that how the nutritional status affects the academic achievement of secondary school students. A total of 200 secondary school students were randomly selected from 6 different schools of Ludhiana district, Punjab. Data on dietary intake was calculated by using 3 days dietary recall method. Heights and weights were measured; marks obtained in annual examination of matriculation were used as measurement of academic achievement. The study showed that male secondary school students have more intake of proteins, carbohydrates, iron and calcium, and have more height and weight as compared to the female secondary school students. And also the study reported that the female secondary school students have higher mean scores in academic achievement as compared to their male counterparts. The coefficient of correlation between academic achievement and various nutrients were negative and not significant except for only two nutrients i.e. vitamins and calcium which were found to be significantly related to academic achievement of secondary school students. A partial relationship existed between nutritional status and academic achievement of secondary school students as concluded from the study.
INTRODUCTION
The development of any nation or community depends largely on the quality of education of the nation. Academic achievement has always been a crucial area and the most eminent goal of education. It is the level of learning in a particular area of subject in terms of knowledge, understanding, skills and application, usually designed by test scores or marks assigned by the teacher or both (Sullivan, 2001). The important role of nutrition in the aspect of academic achievement cannot be ignored. Nutritional status is a global term that encompasses a number of specific components (August et al, 2002). It can be assessed by measuring four parameters ABCD i.e., Anthropometric measurements, Biochemical analysis, Clinical examination and Dietary survey. It has been suggested that the health of the children is dependent upon food intake that provides sufficient energy and nutrients to promote optimal physical, social, cognitive growth and development. Inadequate energy and nutrients have a variety of poor outcomes including retardation, iron deficiency anemia, poor academic performance and development of psychosocial difficulties. It has been argued that health is an important factor for academic
achievement at school. Nutritional deficiencies and poor health are among the causes of poor classroom performance.
Moreover, school children constitute one of the important segment of any nation, they account for over 20% of the Indian population. Also school age is a dynamic period of growth and development as children undergo physical, mental, emotional and social changes. Nutritional status during this period retards the growth and hampers the brain development, which leads to poor cognitive development, impaired learning abilities and results in poor scholastic achievements. Hence, the possible role of nutrition in school performance, school attendance, attention span and cognitive abilities cannot be overlooked. The nutritional status of school students, the future of the nation; contributes significantly to the development of any nation. Therefore, it becomes very important to study that how nutritional status affects the academic achievement of secondary school students and hence the present study was carried out in Ludhiana district with the following
objectives-1. To study the nutritional status and academic achievement of secondary school students.
International Journal of
Recent Scientific
Research
International Journal of Recent Scientific Research
Vol. 7, Issue, 12, pp. 14713-14718, December, 2016
Copyright © Rittu Dhir., 2016, this is an open-access article distributed under the terms of the Creative Commons Attribution
License, which permits unrestricted use, distribution and reproduction in any medium, provided the original work is properly cited.
Article History:
Received 15thSeptember, 2016 Received in revised form 25th October, 2016
Accepted 23rdNovember, 2016 Published online 28thDecember, 2016
Key Words:
2. To find out the relationship between nutritional status and academic achievement of secondary school students.
The important role of nutrition in the aspect of academic achievement cannot be ignored. Insufficient daily consumptions of foods have been found to affect the health status; and poor health status and nutritional status may hinder
a child’s ability to learn. Malnourished children have been
shown to have decreased physical activity and endurance, and poorer cognitive function and school performance. It was summarized from the study that the effects of impaired nutritional status during childhood may have long-standing consequences for the health and performance of children during their adult years (Fanjiang and Kleinman, 2007). Malnutrition was negatively and significantly related with the academic performance (Essein et al, 2012). It was also concluded that both short term and long term malnutrition have a detrimental effect on knowledge acquisition (Aubery, 2012). Malnutrition and infectious diseases in infancy and early childhood have an impact on the cognitive development of children in developing countries. A number of studies relate early malnutrition, iron deficiency, and malaria infection to poor cognitive abilities in the school-age years. It was also suggested that improving the health and nutrition of young children can improve their subsequent chances of attending school, the gender equity of education access, and performance of children once at school (Jukes, 2005).
Food-insufficient teenagers were more likely to have seen a psychologist, have been suspended from school, and have had difficulty getting along with other children. Negative academic and psychosocial outcomes are associated with family-level food insufficiency (Katherine et al, 2001). Food shortage and disease incidence also affect school programme negatively. There is also a relationship between wasting and school performance (Atiamuga, 2012). Children who were at nutritional risk had significantly poorer attendance, punctuality, and grades at school, more behavior problems, and were less likely to eat breakfast at school than children who were not at nutritional risk. The participation in a school breakfast program enhanced daily nutrient intake and improvements in nutrient intake were associated with significant improvements in student academic performance and psychosocial functioning and decreases in hunger (Kleinman et al, 2002). Studies also concluded that a significant association existed between academic achievement and breakfast and midday meal consumption (Acham et al, 2012) and the availability of School Breakfast Program (SBP) increased student achievement (Frisvold, 2012). Rampersaud et al (2005) summarized the results of 47 studies examining the association of breakfast consumption with nutritional adequacy (9 studies), body weight (16 studies), and academic performance (22 studies) in children and adolescents. Evidence suggested that breakfast consumption may improve cognitive function related to memory, test grades, and school attendance. The research indicated that school breakfast programs seem to improve attendance rates and decrease tardiness. Among severely undernourished populations, school breakfast programs seem to improve academic performance and cognitive functioning (Taras, 2005). Another study has shown relation between hemoglobin level and nutritional status of the children
(Abidoye et al, 1991). The students with decreased overall diet quality were significantly more likely to perform poorly on the assessment (Florence et al, 2008).
Children with a greater number of unhealthful eating patterns were more at risk for unfavorable overall performance in school. A potential relationship between eating patterns and unfavorable overall school performance is supported by a positive relationship between frequency of food intake and food preferences in the study (Fu et al, 2007). It was also indicated that family nutritional environment itself exerts
significant effects on children’s school performance (Yu and Hannum, 2007). It is also reported that schools with high percentages of students who engage in moderate physical activity, eat nutritious food and eat breakfast daily, and feel safe and secure at school have higher Academic Performance Index (API) scores than other schools (Hanson et al, 2003). Many studies have exhibited a significant relation between academic performance, and nutritional status of the children (Abidoye et al 1991, Luzi 2010, Abudayya et al 2011, Belachew et al 2011, Hamid et al 2011, Tayebi et al 2014) and with a wide range of weight and health related behaviors (Deliens et al, 2013). Moreover, a positive relation between early childhood nutrition and subsequent academic achievement was also reported and it, thus, supported a causal link between nutrition and academic success (Glewwe et al, 1991). It was also suggested that good regular dietary habits are the best way to ensure optimal mental and behavioral performance at all times (Bellisle, 2004).
The research illustrated the need to aid children in maintaining a nutritious lifestyle. Whether at home or at school, there is a responsibility of the community; locally, regionally or governmentally, to afford each child an equal chance to succeed academically (Rausch, 2013). The students who consume balanced, nutrient dense food and drink perform better in areas of participation, behavior, attendance and get their assigned tasks done more completely than students who do not eat well. This study showed that better nutrition leads to better behavior and this make the entire schooling experience better for teachers, administrators, parents, and students alike (Dodsworth, 2010). Body mass index, breakfast consumption, eating three square meals and regular intake of fruits and vegetables all had significant effects on the academic performance of adolescents (Ogunsile, 2012). The education policy makers must consider nutrition as a key factor in the design of educational interventions to improve the participation and academic performance of school age children (Galal and Hulett, 2003).
METHODOLOGY
Materials and Methods
Anthropometric survey
For assessing the nutritional status of the subjects, recording the anthropometric measurements is one of the methods. It was assessed by measuring body height (cm) and weight (kg). Height of each subject was assessed in a standing position to the nearest of 0.1 cm using anthropometric rod. For recording the weight of the students, a personal weighing machine was used to the nearest of 0.1 kg. The individuals were weighed with minimum clothing and without shoes. Derived anthropometric measurements i.e. Body Mass Index (BMI) was calculated using the formula given by Garrow, 1981:
Body Mass Index (kg/m2) = Weight/Height2; where weight was in kilograms and height was in meters.
Dietary Survey
For conducting the dietary survey, the daily dietary recall for three consecutive days was taken and was averaged out for one day. The food consumption frequency was recorded in terms of cereals, pulses, milk and milk products, green leafy vegetables, roots and tubers, fruits, meat and poultry, fats and oils, and sugar. The average daily nutrient intake was calculated with the help of the MSU Nutriguide Computer Program. The daily nutrient intake for protein, carbohydrates, fats, vitamins, iron and calcium were also calculated. A self-made questionnaire was used in the collection of data.
Assessment of Academic Performance
Academic performance of the secondary school students were assessed by the percentage of marks scored by the students in the annual examination of matriculation.
RESULTS
Data obtained was analyzed to find out the relationship between nutritional status and academic achievement of secondary school students of Ludhiana district, Punjab. 200 students were surveyed out of which 49% (98) were male and 51% (102) were female. And the sample was equally distributed on the variable of locale i.e. rural and urban. (Fig 1)
Food Consumption Frequency of Secondary School Students
For the consumption of cereals, pulses, fats and oils, sugar and jaggery; 100% (200) of the subjects consumed them daily. Milk and milk products were consumed maximum by rural boys i.e. 94.12% (48) whereas minimum consumption was seen in urban girls i.e. 43.40% (23) only, as clear from Fig 2 and Fig 3 respectively. Regarding the consumption of green leafy vegetables it was found that 66.66% (34) of the rural boys (Fig
4) consumed it 4-6 t/wk which was maximum in their locale. But in the urban locale, the maximum consumption frequency of green leafy vegetables for the boys was found to be 2-3 t/wk i.e. 48.93% (23) (Fig 5) whereas the maximum frequency was 1-2 t/wk in the case of girls i.e. 35.85% (19). The survey showed regarding the consumption frequency of roots and tubers; it was maximum for rural boys, i.e. 62.74% (32) with 4-6 t/wk; for rural girls it was 53.04-6% (24-6) with 2-4 t/wk; for urban boys it was 48.94% (23) with 4-6 t/wk (Table 3) and for urban girls it was 43.40% (23) with 2-4 t/wk. Urban subjects had better consumption frequency of fruits than their rural counterparts. The data clearly revealed that the girls irrespective of their locale had lower consumption of meat and poultry than their male counterparts.
Figure 1 Percentage Distribution of Sample according to Gender (Male
and Female) and Locale (Rural and Urban) Gender Locale 49 51 50 50 Male Female Rural Urban
Figure 2 Food Consumption Frequency of Rural Boys of Secondary
School Students
Figure 3 Food Consumption Frequency of Urban Girls of Secondary
School Students
Figure 4 Food Consumption Frequency of Rural Girls of Secondary School
Students
Anthropometric survey
For assessing the nutritional status of the subjects, recording the anthropometric measurements is one of the methods. It was assessed by measuring body height (cm) and weight (kg). Height of each subject was assessed in a standing position to the nearest of 0.1 cm using anthropometric rod. For recording the weight of the students, a personal weighing machine was used to the nearest of 0.1 kg. The individuals were weighed with minimum clothing and without shoes. Derived anthropometric measurements i.e. Body Mass Index (BMI) was calculated using the formula given by Garrow, 1981:
Body Mass Index (kg/m2) = Weight/Height2; where weight was in kilograms and height was in meters.
Dietary Survey
For conducting the dietary survey, the daily dietary recall for three consecutive days was taken and was averaged out for one day. The food consumption frequency was recorded in terms of cereals, pulses, milk and milk products, green leafy vegetables, roots and tubers, fruits, meat and poultry, fats and oils, and sugar. The average daily nutrient intake was calculated with the help of the MSU Nutriguide Computer Program. The daily nutrient intake for protein, carbohydrates, fats, vitamins, iron and calcium were also calculated. A self-made questionnaire was used in the collection of data.
Assessment of Academic Performance
Academic performance of the secondary school students were assessed by the percentage of marks scored by the students in the annual examination of matriculation.
RESULTS
Data obtained was analyzed to find out the relationship between nutritional status and academic achievement of secondary school students of Ludhiana district, Punjab. 200 students were surveyed out of which 49% (98) were male and 51% (102) were female. And the sample was equally distributed on the variable of locale i.e. rural and urban. (Fig 1)
Food Consumption Frequency of Secondary School Students
For the consumption of cereals, pulses, fats and oils, sugar and jaggery; 100% (200) of the subjects consumed them daily. Milk and milk products were consumed maximum by rural boys i.e. 94.12% (48) whereas minimum consumption was seen in urban girls i.e. 43.40% (23) only, as clear from Fig 2 and Fig 3 respectively. Regarding the consumption of green leafy vegetables it was found that 66.66% (34) of the rural boys (Fig
4) consumed it 4-6 t/wk which was maximum in their locale. But in the urban locale, the maximum consumption frequency of green leafy vegetables for the boys was found to be 2-3 t/wk i.e. 48.93% (23) (Fig 5) whereas the maximum frequency was 1-2 t/wk in the case of girls i.e. 35.85% (19). The survey showed regarding the consumption frequency of roots and tubers; it was maximum for rural boys, i.e. 62.74% (32) with 4-6 t/wk; for rural girls it was 53.04-6% (24-6) with 2-4 t/wk; for urban boys it was 48.94% (23) with 4-6 t/wk (Table 3) and for urban girls it was 43.40% (23) with 2-4 t/wk. Urban subjects had better consumption frequency of fruits than their rural counterparts. The data clearly revealed that the girls irrespective of their locale had lower consumption of meat and poultry than their male counterparts.
Figure 1 Percentage Distribution of Sample according to Gender (Male
and Female) and Locale (Rural and Urban) Urban
Figure 2 Food Consumption Frequency of Rural Boys of Secondary
School Students
Figure 3 Food Consumption Frequency of Urban Girls of Secondary
School Students
Figure 4 Food Consumption Frequency of Rural Girls of Secondary School
Students 100 100 94.12
7.84 5.88 66.66 62.74 25.49 31.37 76.47 5.88 13.72 0% 10% 20% 30% 40% 50% 60% 70% 80% 90% 100% % 100 100 43.4 13.21 5.66 20.75 62.26 9.43 32.07 43.4 22.64 11.32 35.85 33.96 15.09 11.32 20.75 11.32 5.66 0% 10% 20% 30% 40% 50% 60% 70% 80% 90% 100% % 100 100 83.67 2.04 12.24 63.26 34.69 18.37 4.08 18.37 53.06 46.94 14.2810.2 34.69 4.08 0% 10% 20% 30% 40% 50% 60% 70% 80% 90% 100% % Anthropometric survey
For assessing the nutritional status of the subjects, recording the anthropometric measurements is one of the methods. It was assessed by measuring body height (cm) and weight (kg). Height of each subject was assessed in a standing position to the nearest of 0.1 cm using anthropometric rod. For recording the weight of the students, a personal weighing machine was used to the nearest of 0.1 kg. The individuals were weighed with minimum clothing and without shoes. Derived anthropometric measurements i.e. Body Mass Index (BMI) was calculated using the formula given by Garrow, 1981:
Body Mass Index (kg/m2) = Weight/Height2; where weight was in kilograms and height was in meters.
Dietary Survey
For conducting the dietary survey, the daily dietary recall for three consecutive days was taken and was averaged out for one day. The food consumption frequency was recorded in terms of cereals, pulses, milk and milk products, green leafy vegetables, roots and tubers, fruits, meat and poultry, fats and oils, and sugar. The average daily nutrient intake was calculated with the help of the MSU Nutriguide Computer Program. The daily nutrient intake for protein, carbohydrates, fats, vitamins, iron and calcium were also calculated. A self-made questionnaire was used in the collection of data.
Assessment of Academic Performance
Academic performance of the secondary school students were assessed by the percentage of marks scored by the students in the annual examination of matriculation.
RESULTS
Data obtained was analyzed to find out the relationship between nutritional status and academic achievement of secondary school students of Ludhiana district, Punjab. 200 students were surveyed out of which 49% (98) were male and 51% (102) were female. And the sample was equally distributed on the variable of locale i.e. rural and urban. (Fig 1)
Food Consumption Frequency of Secondary School Students
For the consumption of cereals, pulses, fats and oils, sugar and jaggery; 100% (200) of the subjects consumed them daily. Milk and milk products were consumed maximum by rural boys i.e. 94.12% (48) whereas minimum consumption was seen in urban girls i.e. 43.40% (23) only, as clear from Fig 2 and Fig 3 respectively. Regarding the consumption of green leafy vegetables it was found that 66.66% (34) of the rural boys (Fig
4) consumed it 4-6 t/wk which was maximum in their locale. But in the urban locale, the maximum consumption frequency of green leafy vegetables for the boys was found to be 2-3 t/wk i.e. 48.93% (23) (Fig 5) whereas the maximum frequency was 1-2 t/wk in the case of girls i.e. 35.85% (19). The survey showed regarding the consumption frequency of roots and tubers; it was maximum for rural boys, i.e. 62.74% (32) with 4-6 t/wk; for rural girls it was 53.04-6% (24-6) with 2-4 t/wk; for urban boys it was 48.94% (23) with 4-6 t/wk (Table 3) and for urban girls it was 43.40% (23) with 2-4 t/wk. Urban subjects had better consumption frequency of fruits than their rural counterparts. The data clearly revealed that the girls irrespective of their locale had lower consumption of meat and poultry than their male counterparts.
Figure 1 Percentage Distribution of Sample according to Gender (Male
and Female) and Locale (Rural and Urban)
Figure 2 Food Consumption Frequency of Rural Boys of Secondary
School Students
Figure 3 Food Consumption Frequency of Urban Girls of Secondary
School Students
Figure 4 Food Consumption Frequency of Rural Girls of Secondary School
Nutrient Intake of Secondary School Students
Intakes of 6 nutrients viz. protein, carbohydrate, fat, vitamins, iron and calcium were calculated from the collected data and t-scores were calculated to observe the difference between mean scores of nutrients among rural and urban secondary school students. The urban secondary school students had higher mean scores for protein (39.48), carbohydrates (159.73), fat (41.54), vitamins (43.83), iron (16.16) and calcium (720.87) as
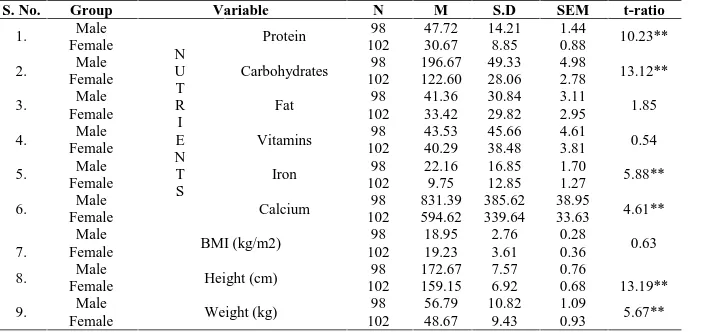
compared to their rural secondary school students. But there existed no significant difference between mean scores of calculated nutrients among rural and urban secondary school students, as revealed by the calculated t-ratios (Table 1). The mean scores of different nutrients showed higher consumption of protein (47.72), carbohydrates (196.67), fat (41.36), vitamins (43.53), iron (22.16) and calcium (831.39) by males than their female counterparts. The t-ratios, thus calculated, revealed that a significant difference existed between mean scores of protein, carbohydrate, iron and calcium but no significant difference existed between mean scores of fats and vitamins among male and female secondary school students (Table 2).
Anthropometric Measurements of Secondary School Students
All the subjects were measured for their heights and weights; and BMI were calculated. The data clearly revealed the mean scores for height (cm) were higher in the case of rural secondary school students (166.17) but the mean scores for weight (kg) were higher for urban secondary school students (54.00) as depicted in Table 1. The data also revealed that the mean scores for BMI (kg/m2) were more for urban secondary school students i.e. 19.67. The data revealed that no significant difference existed between the mean scores of height and weight but a significant difference existed between mean scores of BMI among rural and urban secondary school students.
Figure 5 Food Consumption Frequency of Urban Boys of Secondary
School Students 100 100
53.2
27.66
100 100 23.4
6.38 48.9442.55
14.89 19.15
48.93 42.55
31.91 36.17 4.25
44.68 8.51
25.53 17.02
12.76 4.25
40.43 46.81
0% 10% 20% 30% 40% 50% 60% 70% 80% 90% 100%
%
Never
Occasionally
1-2t/wk
2-4t/wk
4-6t/wk
Daily
Table 1 Significance of the Difference in Nutritional Status of Rural and Urban Secondary School Students
S. No. Group Variable N M S.D SEM t-ratio
1. Rural
N U T R I E N T S
Protein 100 38.57 14.21 1.42 0.44
Urban 100 39.48 14.91 1.49
2. Rural Carbohydrates 100 158.06 52.95 5.29 0.22
Urban 100 159.73 56.15 5.61
3. Rural Fat 100 33.08 24.63 2.46 1.98
Urban 100 41.54 35.04 3.50
4. Rural Vitamins 100 39.93 46.80 4.68 0.65
Urban 100 43.83 36.89 3.69
5. UrbanRural Iron 100100 15.5016.16 16.0016.38 1.601.64 0.29
6. Rural Calcium 100 700.40 411.88 41.19 0.38
Urban 100 720.87 349.04 34.90
7.
Rural
BMI (kg/m2) 100 18.52 2.70 0.27 2.57*
Urban 100 19.67 3.58 0.36
8. Rural Height (cm) 100 166.17 9.81 0.98 0.56
Urban 100 165.38 10.04 1.00
9. Rural Weight (kg) 100 51.30 9.79 0.98 1.76
Urban 100 54.00 11.80 1.18
*Significant at .05 level **Significant at .01 level
Table 2 Significance of the Difference in Nutritional Status of Male and Female Secondary School Students
S. No. Group Variable N M S.D SEM t-ratio
1. Male
N U T R I E N T S
Protein 98 47.72 14.21 1.44 10.23**
Female 102 30.67 8.85 0.88
2. Male Carbohydrates 98 196.67 49.33 4.98 13.12**
Female 102 122.60 28.06 2.78
3. Male Fat 98 41.36 30.84 3.11 1.85
Female 102 33.42 29.82 2.95
4. Male Vitamins 98 43.53 45.66 4.61 0.54
Female 102 40.29 38.48 3.81
5. Male Iron 98 22.16 16.85 1.70 5.88**
Female 102 9.75 12.85 1.27
6. Male Calcium 98 831.39 385.62 38.95 4.61**
Female 102 594.62 339.64 33.63
7.
Male
BMI (kg/m2) 98 18.95 2.76 0.28 0.63
Female 102 19.23 3.61 0.36
8. Male Height (cm) 98 172.67 7.57 0.76
Female 102 159.15 6.92 0.68 13.19**
9. Male Weight (kg) 98 56.79 10.82 1.09 5.67**
Female 102 48.67 9.43 0.93
The mean scores of height (cm) and weight (kg) calculated for male and female secondary school students showed that male subjects had higher mean scores 172.67 and 56.79 respectively compared to their female counterparts as depicted in Table 2. It was also revealed that female subjects had higher mean scores for BMI (kg/m2) i.e. 19.23 than male subjects who had mean scores of 18.95. Thus, the t-ratios were calculated to see any difference between mean scores of male and female secondary school students. It was revealed that a significant difference exists between mean scores of height and weight among male and female secondary school students but no significant difference existed between mean scores of BMI among male and female secondary school students.
Academic Achievement of Secondary School Students
All the secondary school students were assessed for their academic achievement by recording the marks obtained in the annual examination of matriculation. It was revealed clearly from the data that the mean scores for academic achievement were higher in case of urban secondary school students (70.88) as compared to the rural secondary school students (68.82) as clear from Table 3. But the t-ratios calculated; revealed that no significant difference existed between mean scores of academic achievement of rural and urban secondary school students. The mean scores of academic achievement of male and female secondary school students (71.92) had higher mean scores than male secondary school students (67.69) as depicted in Table 4. The t-ratios, thus, calculated revealed that a significant difference existed between mean scores of academic achievement of male and female secondary school students.
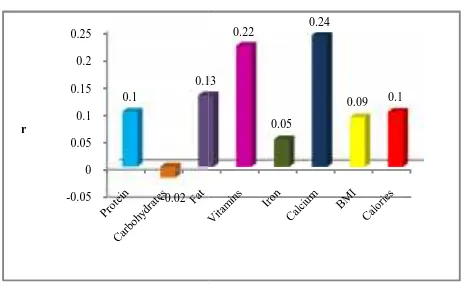
Relationship between Nutrient Intake and Academic Achievement of Secondary School Students
The data was analyzed with Pearson’s Product Moment
Correlation technique to find out the relationship between nutritional status and academic achievement of secondary school students. The coefficient of correlation between academic achievement and intake of proteins, carbohydrates, fats, vitamins, iron and calcium were calculated. And the data revealed that out of all these nutrients, only two nutrients i.e. vitamins (0.22) and calcium (0.24) are found to be significantly related to academic achievement of secondary school students (Fig 6).
CONCLUSION
The rural secondary school students take in more of green leafy vegetables, and milk and milk products which may be due to easier availability of these food groups in their area. But their consumption of other vegetables, fruits, meat and poultry is less and it may be due to lesser availability and high cost of these food groups. The study also revealed that urban subjects had higher mean scores of all nutrients which may be due to overall better availability of variety of food groups. It was also concluded that urban secondary school students had higher BMI values than their counterparts which may be due to dietary differences – rural students have less access to convenience foods and have less consumption of empty calorie containing foods.
The dietary survey showed that the female secondary school students had lower intakes of all nutrients as compared to male secondary school students which may be due to male dominance pattern in our Indian society. The female secondary school students had higher BMI mean scores as compared to their male counterparts. This difference is clearly because of the height-weight ratios, thus, concluded by the study. It was revealed from the study that out of six nutrients studied; only two nutrients viz. vitamins and calcium are found to be significantly related to academic achievement of students. This correlation may be because, the vitamins are particularly important for neuronal development, neuronal connectivity and signal processing and transmission. The correlation between calcium and academic achievement existed as calcium play a role in message transmission and the thinking process.
Thus, from the above study and analysis of the data, it can be concluded that nutritional statuses of secondary school students have a partial relation with their academic performance.
References
1. Abidoye, R.O., George, T.A. and Akitoye, C.O. (1991) Effect of nutritional status on intellectual performance of Nigerian children. Early Child Development and Care. 67(1):87-94.
2. Abudayya, A., Shi, Z., Abed, Y., and Holmboe-Ottesen, G. (2011) Diet, nutritional status and school performance among adolescents in Gaza Strip. Eastern
Mediterranean Health Journal. 17(3).
3. Acham, H., Kikafunda, J.K., Malde, M.K., Oldewage-Theron, W.H. and Ega, A.A. (2012) Breakfast, midday
Table 3 Significance of the Difference between Means of
Academic Achievement of Rural and Urban Secondary School Students
Group Variable N M S.D SEM t-ratio
Rural Academic Achievement
100 68.82 12.46 1.25 1.42
Urban 100 70.88 7.37 0.74
*Significant at .05 level **Significant at .01 level
Table 4 Significance of the Difference between Means of
Academic Achievement of Male and Female Secondary School Students
Group Variable N M S.D SEM t-ratio
Male Academic Achievement
98 67.69 10.13 1.02 2.97**
Female 102 71.92 10.01 0.99
*Significant at .05 level **Significant at .01 level
Figure 6 Coefficient of Correlation between Nutritional Status and
Academic Achievement of Secondary School Students (N=200) The mean scores of height (cm) and weight (kg) calculated for
male and female secondary school students showed that male subjects had higher mean scores 172.67 and 56.79 respectively compared to their female counterparts as depicted in Table 2. It was also revealed that female subjects had higher mean scores for BMI (kg/m2) i.e. 19.23 than male subjects who had mean scores of 18.95. Thus, the t-ratios were calculated to see any difference between mean scores of male and female secondary school students. It was revealed that a significant difference exists between mean scores of height and weight among male and female secondary school students but no significant difference existed between mean scores of BMI among male and female secondary school students.
Academic Achievement of Secondary School Students
All the secondary school students were assessed for their academic achievement by recording the marks obtained in the annual examination of matriculation. It was revealed clearly from the data that the mean scores for academic achievement were higher in case of urban secondary school students (70.88) as compared to the rural secondary school students (68.82) as clear from Table 3. But the t-ratios calculated; revealed that no significant difference existed between mean scores of academic achievement of rural and urban secondary school students. The mean scores of academic achievement of male and female secondary school students (71.92) had higher mean scores than male secondary school students (67.69) as depicted in Table 4. The t-ratios, thus, calculated revealed that a significant difference existed between mean scores of academic achievement of male and female secondary school students.
Relationship between Nutrient Intake and Academic Achievement of Secondary School Students
The data was analyzed with Pearson’s Product Moment
Correlation technique to find out the relationship between nutritional status and academic achievement of secondary school students. The coefficient of correlation between academic achievement and intake of proteins, carbohydrates, fats, vitamins, iron and calcium were calculated. And the data revealed that out of all these nutrients, only two nutrients i.e. vitamins (0.22) and calcium (0.24) are found to be significantly related to academic achievement of secondary school students (Fig 6).
CONCLUSION
The rural secondary school students take in more of green leafy vegetables, and milk and milk products which may be due to easier availability of these food groups in their area. But their consumption of other vegetables, fruits, meat and poultry is less and it may be due to lesser availability and high cost of these food groups. The study also revealed that urban subjects had higher mean scores of all nutrients which may be due to overall better availability of variety of food groups. It was also concluded that urban secondary school students had higher BMI values than their counterparts which may be due to dietary differences – rural students have less access to convenience foods and have less consumption of empty calorie containing foods.
The dietary survey showed that the female secondary school students had lower intakes of all nutrients as compared to male secondary school students which may be due to male dominance pattern in our Indian society. The female secondary school students had higher BMI mean scores as compared to their male counterparts. This difference is clearly because of the height-weight ratios, thus, concluded by the study. It was revealed from the study that out of six nutrients studied; only two nutrients viz. vitamins and calcium are found to be significantly related to academic achievement of students. This correlation may be because, the vitamins are particularly important for neuronal development, neuronal connectivity and signal processing and transmission. The correlation between calcium and academic achievement existed as calcium play a role in message transmission and the thinking process.
Thus, from the above study and analysis of the data, it can be concluded that nutritional statuses of secondary school students have a partial relation with their academic performance.
References
1. Abidoye, R.O., George, T.A. and Akitoye, C.O. (1991) Effect of nutritional status on intellectual performance of Nigerian children. Early Child Development and Care. 67(1):87-94.
2. Abudayya, A., Shi, Z., Abed, Y., and Holmboe-Ottesen, G. (2011) Diet, nutritional status and school performance among adolescents in Gaza Strip. Eastern
Mediterranean Health Journal. 17(3).
3. Acham, H., Kikafunda, J.K., Malde, M.K., Oldewage-Theron, W.H. and Ega, A.A. (2012) Breakfast, midday
Table 3 Significance of the Difference between Means of
Academic Achievement of Rural and Urban Secondary School Students
Group Variable N M S.D SEM t-ratio
Rural Academic Achievement
100 68.82 12.46 1.25 1.42
Urban 100 70.88 7.37 0.74
*Significant at .05 level **Significant at .01 level
Table 4 Significance of the Difference between Means of
Academic Achievement of Male and Female Secondary School Students
Group Variable N M S.D SEM t-ratio
Male Academic Achievement
98 67.69 10.13 1.02 2.97**
Female 102 71.92 10.01 0.99
*Significant at .05 level **Significant at .01 level
Figure 6 Coefficient of Correlation between Nutritional Status and
Academic Achievement of Secondary School Students (N=200) -0.05 0 0.05 0.1 0.15 0.2 0.25 0.1 -0.02 0.13 r The mean scores of height (cm) and weight (kg) calculated for
male and female secondary school students showed that male subjects had higher mean scores 172.67 and 56.79 respectively compared to their female counterparts as depicted in Table 2. It was also revealed that female subjects had higher mean scores for BMI (kg/m2) i.e. 19.23 than male subjects who had mean scores of 18.95. Thus, the t-ratios were calculated to see any difference between mean scores of male and female secondary school students. It was revealed that a significant difference exists between mean scores of height and weight among male and female secondary school students but no significant difference existed between mean scores of BMI among male and female secondary school students.
Academic Achievement of Secondary School Students
All the secondary school students were assessed for their academic achievement by recording the marks obtained in the annual examination of matriculation. It was revealed clearly from the data that the mean scores for academic achievement were higher in case of urban secondary school students (70.88) as compared to the rural secondary school students (68.82) as clear from Table 3. But the t-ratios calculated; revealed that no significant difference existed between mean scores of academic achievement of rural and urban secondary school students. The mean scores of academic achievement of male and female secondary school students (71.92) had higher mean scores than male secondary school students (67.69) as depicted in Table 4. The t-ratios, thus, calculated revealed that a significant difference existed between mean scores of academic achievement of male and female secondary school students.
Relationship between Nutrient Intake and Academic Achievement of Secondary School Students
The data was analyzed with Pearson’s Product Moment
Correlation technique to find out the relationship between nutritional status and academic achievement of secondary school students. The coefficient of correlation between academic achievement and intake of proteins, carbohydrates, fats, vitamins, iron and calcium were calculated. And the data revealed that out of all these nutrients, only two nutrients i.e. vitamins (0.22) and calcium (0.24) are found to be significantly related to academic achievement of secondary school students (Fig 6).
CONCLUSION
The rural secondary school students take in more of green leafy vegetables, and milk and milk products which may be due to easier availability of these food groups in their area. But their consumption of other vegetables, fruits, meat and poultry is less and it may be due to lesser availability and high cost of these food groups. The study also revealed that urban subjects had higher mean scores of all nutrients which may be due to overall better availability of variety of food groups. It was also concluded that urban secondary school students had higher BMI values than their counterparts which may be due to dietary differences – rural students have less access to convenience foods and have less consumption of empty calorie containing foods.
The dietary survey showed that the female secondary school students had lower intakes of all nutrients as compared to male secondary school students which may be due to male dominance pattern in our Indian society. The female secondary school students had higher BMI mean scores as compared to their male counterparts. This difference is clearly because of the height-weight ratios, thus, concluded by the study. It was revealed from the study that out of six nutrients studied; only two nutrients viz. vitamins and calcium are found to be significantly related to academic achievement of students. This correlation may be because, the vitamins are particularly important for neuronal development, neuronal connectivity and signal processing and transmission. The correlation between calcium and academic achievement existed as calcium play a role in message transmission and the thinking process.
Thus, from the above study and analysis of the data, it can be concluded that nutritional statuses of secondary school students have a partial relation with their academic performance.
References
1. Abidoye, R.O., George, T.A. and Akitoye, C.O. (1991) Effect of nutritional status on intellectual performance of Nigerian children. Early Child Development and Care. 67(1):87-94.
2. Abudayya, A., Shi, Z., Abed, Y., and Holmboe-Ottesen, G. (2011) Diet, nutritional status and school performance among adolescents in Gaza Strip. Eastern
Mediterranean Health Journal. 17(3).
3. Acham, H., Kikafunda, J.K., Malde, M.K., Oldewage-Theron, W.H. and Ega, A.A. (2012) Breakfast, midday
Table 3 Significance of the Difference between Means of
Academic Achievement of Rural and Urban Secondary School Students
Group Variable N M S.D SEM t-ratio
Rural Academic Achievement
100 68.82 12.46 1.25 1.42
Urban 100 70.88 7.37 0.74
*Significant at .05 level **Significant at .01 level
Table 4 Significance of the Difference between Means of
Academic Achievement of Male and Female Secondary School Students
Group Variable N M S.D SEM t-ratio
Male Academic Achievement
98 67.69 10.13 1.02 2.97**
Female 102 71.92 10.01 0.99
*Significant at .05 level **Significant at .01 level
Figure 6 Coefficient of Correlation between Nutritional Status and
Academic Achievement of Secondary School Students (N=200) 0.13
0.22
0.05 0.24
meals and academic achievement in rural primary schools in Uganda: implications for education and school health policy. Food & Nutrition Research. (56).
4. Atiamuga, M.D. (2012) Nutritional status among low and high academic achievers in selected primary schools
in Vihiga division, Kenya.
http://ir-library.ku.ac.ke/handle/123456789/2524
5. Aubery, F. (2012) The detrimental effect of malnutrition on school achievement. JEL codes: I25, O12.
6. August, D.A., Teitelbaum, D., Albina, J., Bothe, A., Guenter, P. and Heitkemper, M. (2002) Guidelines for the use of parentral and enteral nutrition in adult and pediatric patients. Journal of Parentral and Enteral
Nutrition. 26(1, Suppl):2SA.
7. Belachew, T., Hadley, C., Lindstrom, D., Gebremariam, A., Lachat, C., and Kolsteren, P. (2011) Food insecurity, school absenteeism and educational attainment of adolescents in Jimma Zone Southwest Ethiopia: a longitudinal study. Nutrition Journal. (10)29.
8. Bellisle, F. (2004) Effects of diet on behaviour and cognition in children. British Journal of Nutrition. (92)2:S227–S232.
9. Deliens, T., Clarys, P., Bourdeaudhuij, I.D. and Deforche, B. (2013) Weight, socio-demographics, and health behaviour related correlates of academic performance in first year university students. Nutrition
Journal. (12)162.
10. Dodsworth, L.M. (2010) Student Nutrition and Academic Achievement. Mathematical and Computing
Sciences Masters. Paper 96.
11. Essien, E., Haruna, M.J. and Emebu, P.K. (2012) Prevalence of malnutrition and its effects on the academic performance of students in some selected secondary schools in Sokoto Metropolis. Pakistan
Journal of Nutrition. 11(7):511-515.
12. Fanjiang, G. and Kleinman, R.E. (2007) Nutrition and performance in children. Paediatrics. 10(3):342-347. 13. Florence, M.D., Asbridge, M. and Veugelers, P.J. (2008)
Diet quality and academic performance. Journal of
School Health. (78):209-215.
14. Frisvold, D.E. (2012) Nutrition and cognitive achievement: an evaluation of the school breakfast program. JEL Classification: I28, H51, I18, H52, H75. 15. Fu, M., Cheng, L., Tu, S. and Pan, W. (2007)
Association between unhealthful eating patterns and unfavorable overall school performance in children.
Journal of the American Dietetic Association.
107(11):1935-43.
16. Galal, O. and Hulett, J. (2003) The relationship between nutrition and children's educational performance: a focus on the United Arab Emirates. Nutrition Bulletin. 28(1):11-20.
17. Garrow J S (1981) Treat obesity seriously. A Clinical
Manual. Chutchill Livingstone, London.
18. Glewwe, P., Jacoby, H. and King, E. (1999) Early childhood nutrition and academic achievement: a longitudinal analysis. Food Consumption and Nutrition
Division. Discussion paper no. 68.
19. Hamid, J.J.M., Mitra, A.K., Hasmiza H., Pim C.D., Ng L.O. and Wan Manan W.M. (2011) Effect of gender and nutritional status on academic achievement and cognitive function among primary school children in a rural district in Malaysia. Malaysian Journal of Nutrition. 17(2)1:189-200.
20. Hanson, T.L., Austin, G. and Lee-Bayha, J. (2003) Student health risks, resilience, and academic performance: Year-1 report. CA: WestEd., Los
Alimatos.
21. Jukes, M. (2005) The long-term impact of preschool health and nutrition on education. Food and Nutrition
Bulletin. (26)2:S193-S201.
22. Katherine, A., Christine, O. and Edward, F. (2001) Food insufficiency and American school-aged children's cognitive, academic, and psychosocial development.
Pediatrics. 108(1):44-51.
23. Kleinman, R.E., Hall, S., Green, H., Korzec-Ramirez, D., Patton, K., Pagano, M.E. and Murphy, J.M. (2002) Diet, breakfast, and academic performance in children.
Annals of Nutrition and Metabolism. 46(suppl 1):24–30.
24. Luzi, L. (2010) Long-term impact of health and nutrition
status on education outcomes for children in rural Tanzania. JEL Classification Code: I0.
25. Ogunsile, S.E. (2012) The effect of dietary pattern and body mass index on the academic performance of in-school adolescents. International Education Studies. (5)6:65-72.
26. Rampersaud, G.C., Pereira, M.A., Girard, B.L., Adams, J. and Metzl, J.D. (2005) Breakfast habits, nutritional status, body weight, and academic performance in children and adolescents. Journal of American Dietetic
Association. 105:743-760.
27. Rausch, R. (2013) Nutrition and academic performance in school-age children the relation to obesity and food insufficiency. Journal of Nutrition and Food Science. 3:190.
28. Sullivan, J.M. (2001) A study of the effect of an inter-disciplinary study improvement programme so academic achievement and class room behavior among Xth grade student. DAI61/11, p-4331-A.
29. Taras, H. (2005) Nutrition and Student Performance at School. Journal of School Health. August (75)6:199-213.
30. Tayebi, S., Pourabbasi, A., Shirvani, M.E. (2014) The effects of dietary habits on Iranian students-school performance, a pilot cross-sectional study. Journal of
Pakistan Medical Association. (64)20.
31. Yu, S. and Hannum, E. (2007) Food for thought: poverty, family nutritional environment, and children’s
educational performance in rural China. Sociological
Perspectives. (50)4:53–77.
*******
How to cite this article:Rittu Dhir.2016, Academic Achievement and Nutritional Status– A Study on Secondary School Students In Ludhiana District.