Falls prevention in NSW: a big issue requiring
sustained research, policy and practice initiatives
GUEST EDITORS
Andrew J. Milat
A,Cand Stephen R. Lord
B AThe Sax Institute (formerly Centre for Health Advancement, NSW Department of Health)
B
Falls and Balance Research Group, Neuroscience Research Australia, The University of New South Wales
C
Corresponding author. Email: [email protected]
The NSW Public Health Bulletin published its first falls
prevention edition,The Big Falls Issue, in 2002.1Almost a
decade on, falls prevention remains a ‘big issue’; the current estimate of treatment costs in New South Wales (NSW) for
2006–07 is $558.5 million,2which is 2.5 times the previous
estimate for 1998–99.3 However, there have also been
concerted efforts over the past 10 years by policy makers, researchers and the non-government sector to address the
issue with the implementation of the NSW Management
Policy to Reduce Fall Injury Among Older People, 2003–
20074 and the creation of a falls prevention co-ordinator
workforce in NSW.
Vol. 22(3–4) March–April 2011
ISSN 1034 7674
NSW PUBLIC HEALTH
BULLETIN
1. Problem definition
2. Solution generation
Formative evaluation
Epidemiology and demography
Community needs analysis
What is the problem?
How might it be solved?
Was the solution effective?
Can the program be replicated?
Can the program be disseminated?
Can the program be sustained? Performance management and monitoring Literature searching;
theory development; pretesting methods and materials Social,
behavioural and
organisational research
Key research questions
Process evaluation Impact and outcome
assessment Program planning
and development
Program implementation and evaluation
Program maintenance 3. Innovation
testing
4. Intervention demonstration
5. Intervention dissemination
6. Program monitoring
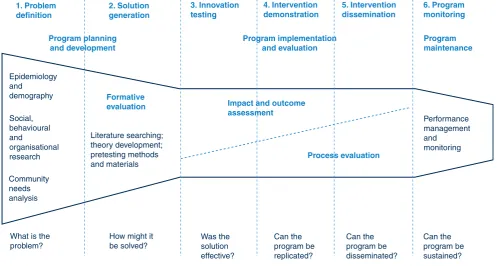
Figure 1. Stages of research and evaluation in public health.
Source: Nutbeam D and Bauman A. Evaluation in a Nutshell – A practical guide to the evaluation of health promotion programs. Sydney: McGraw-Hill; 2006.
CONTENTS – See back page w w w . p u b l i s h . c s i r o . a u / j o u r n a l s / p h b
10.1071/NB11008
The papers in this issue are:
• Prevalence, circumstances and consequences of falls among community-dwelling older people: results of the 2009 NSW Falls Prevention Baseline Survey
• Characteristics of fall-related injuries attended by an ambulance in Sydney, Australia: a surveillance summary
• The cost of fall-related injuries among older people in NSW, 2006–07
• An economic evaluation of community and residential aged care falls prevention strategies in NSW
• Evaluation of theNSW Management Policy to Reduce
Fall Injury Among Older People, 2003–2007: implica-tions for policy development
• The strategic development of theNSW Health Plan for
Prevention of Falls and Harm from Falls Among Older People: 2011–2015; translating research into policy and practice
• Exercise to prevent falls in older adults: an updated meta-analysis and best practice recommendations • Implementing falls prevention research into policy and
practice: an overview of a new National Health and Medical Research Council Partnership Grant.
The papers span the full range of the ‘Stages of research and evaluation in public health’ continuum (Figure 1). This is crucial as advances at each level are important for informing direction at the next and indicate that the research, implementation, dissemination and evaluation projects recently completed and planned for the future are in line with best practice principles.
These papers demonstrate that we cannot afford to neglect the potential epidemic of falls. As treatment costs continue
to rise, it will be even more difficult to find resources for prevention and the cycle of increased demand will be accelerated.
Over the past year, the NSW Department of Health has
been working on developing a newNSW Health Plan for
Prevention of Falls and Harm from Falls Among Older People: 2011–2015,5which is expected to influence health investment as well as policy and practice in the acute, residential care and community-based environments. There remain challenges but it is heartening to see how far falls prevention policy and practice has evolved over the past decade, to a place where more strategic and evidence-based practice is the norm rather than the excep-tion. There is great determination amongst the field to halt and hopefully reverse what could be a public health crisis by the middle of this century.
References
1. Elkington J. The big falls issue.N S W Public Health Bull2002; 13(1–2): 2–3. doi:10.1071/NB02002
2. Watson W, Clapperton A, Mitchell R. The incidence and cost of falls injury among older people in New South Wales 2006/07. North Sydney: NSW Department of Health; 2010.
3. Potter-Forbes M, Aisbett C. Injury Costs: A Valuation of the Burden of Injury in New South Wales 1998–1999. Sydney: NSW Injury Risk Management Research Centre; 2003.
4. NSW Department of Health. NSW Management Policy to Reduce Fall Injury Among Older People, 2003–2007. Available from: http://www.health.nsw.gov.au/policies/PD/2005/pdf/ PD2005_353.pdf (Cited 13 January 2011.)
Prevalence, circumstances and consequences of
falls among community-dwelling older people:
results of the 2009 NSW Falls Prevention
Baseline Survey
Andrew J. Milat
A,E, Wendy L. Watson
B,
Claire Monger
C, Margo Barr
D, Michael Giffin
Dand Michael Reid
CA
The Sax Institute (formerlyC) B
NSW Injury Risk Management Centre, The University of New South Wales
C
Centre for Health Advancement, NSW Department of Health D
Centre for Epidemiology and Research, NSW Department of Health
E
Corresponding author. Email: [email protected]
Abstract: Aim:To describe the prevalence, cir-cumstances and consequences of falls among community-dwelling older people in NSW using data from the 2009 NSW Falls Prevention
Base-line Survey.Methods:Telephone interviews with
a random sample of 5681 NSW residents aged
65 years and over were conducted in 2009.Results:
Of those surveyed, 25.6% reported falling in the last year. Of those who fell, 61.2% fell once, 21.4% fell twice, 7.8% fell three times, and 9.5% fell four or more times in the last year. Sixty-six percent of those who fell in the last year were injured and 20.0% visited a hospital as a result of a fall. The most common injuries were cuts, grazes or bruises (71.0%) and sprains or strains (9.9%). Conclusion:The findings of this survey are con-sistent with previous findings in the published fall injury prevention literature. The results from the survey will assist in the design of community oriented fall injury prevention strategies and will form the baseline measure for the evaluation of the impact of these strategies in NSW.
With an ageing population, falls among older people are a
significant public health issue.1–5 No other single injury
cause, including road trauma, costs the New South Wales
(NSW) health system more.2 Even non-injurious falls
can have negative impacts such as loss of confidence and
activity restriction.3Retrospective community-based
stud-ies and surveys consistently report that approximately 30%
of older people experience one or more falls each year.6–11
In addition, the prevalence of falls increases with age and older people who have suffered a fall are at increased risk
of falling again.12
Previous studies in NSW and elsewhere have shown that about 50–60% of falls among community-dwelling older people occur within their own home and yard, with most falls occurring on level surfaces in commonly used rooms
such as the bedroom, lounge and kitchen.13–15Depending
on the population studied and the definition of injury used, 22–60% of older people suffer injuries from falls, 10–15% suffer serious injuries, 2–6% suffer fractures, and
0.2–1.5% suffer hip fractures.12 The most commonly
reported injuries are superficial cuts and abrasions, bruises
and sprains.12,14–18
Although previous population health surveys have
described the epidemiology of falls,9–11they have not been
conducted with as large a sample and have not provided the breadth of data on falls history, circumstances surrounding falls, consequences, health status, falls risk and protective factors, contact with health professionals, falls prevention knowledge and exposure to preventative measures. Conse-quently the 2009 NSW Falls Prevention Baseline Survey (the Survey) was conducted to provide current and com-prehensive data to assist in the evaluation of the impact of the NSW Health Plan for Prevention of Falls and Harm from Falls Among Older People: 2011–2015.19
The full results of the Survey are reported elsewhere.20
This paper focuses specifically on falls prevalence and the circumstances and consequences of falls.
Methods
Survey instrument
The Survey instrument was developed by the Centre for Health Advancement (NSW Department of Health) and
the NSW Injury Risk Management Research Centre (University of NSW). Questions were field-tested prior to inclusion in the Survey. The Survey defined a fall as: ‘an unexpected event in which the participant comes to rest on
the ground or floor or a lower level’.12Multiple responses
were allowed for questions pertaining to injuries suffered from the most recent fall and perceived causes of the most recent fall.
The instrument was translated into five languages: Arabic, Chinese, Greek, Italian and Vietnamese. A shorter version of the instrument was administered to the main carers of 361 participants unable to answer on their own behalf.
The target population for the Survey was all NSW residents aged 65 years and over living in households with private telephones. The target sample comprised a random sample of approximately 625 people in each of the eight former NSW area health services for a total sample of 5681.
The sampling frame was developed using records from the
Australia on Disk21electronic white pages (phone book)
which were geocoded using MapInfo22mapping software.
The geocoded telephone numbers were assigned to statis-tical local areas and former area health services. The proportion of numbers for each telephone prefix by former area health service was calculated. All prefixes were expanded with suffixes ranging from 0000 to 9999. The resulting list was then matched back to the electronic phone book. All numbers that matched numbers in the electronic phone book were flagged and the number was assigned to the relevant geocoded former area health service. Unlisted numbers were assigned to the former area health service containing the greatest proportion of numbers with that prefix. Numbers were then filtered to eliminate contiguous unused blocks of greater than 10 numbers. The remaining numbers were checked against the business numbers in the electronic phone book to eliminate business numbers. Finally, numbers were randomly sorted.
Households were contacted using random digit dialling and one eligible person from the household was selected for inclusion in the Survey. Interviews were carried out continuously between March and July 2009 by trained interviewers at the NSW Health Survey Program computer-assisted telephone interviewing (CATI) facility and the McNair Ingenuity Research Ltd CATI facility.
Up to seven calls were made to establish initial contact with a household, and five calls were made in order to contact a selected respondent. A more detailed description
of the Survey methods is available in the full report.20
The conduct of the Survey was approved by NSW Health’s Population and Health Services Research Ethics Committee.
Data analysis
Call and interview data were analysed using SAS software (version 9.1.3, SAS Institute, Cary, NC, USA). The SURVEYFREQ procedure in SAS was used to analyse the data and calculate point estimates and 95% confidence intervals for the estimates. The SURVEYFREQ procedure calculates standard errors adjusted for the design effect factor (the variance for a non-random sample divided by the variance for a simple random sample). Comparisons against the overall statewide prevalence were made for each factor under investigation by gender, age group and urban versus rural health areas. For the purposes of the Survey, ‘urban’ meant that the respondent lived in one of the four former area health services designated as metro-politan: Northern Sydney Central Coast, South Eastern Sydney Illawarra, Sydney South West or Sydney West. ‘Rural’ meant that the respondent lived in one of the four former area health services designated as rural: Greater Southern, Greater Western, Hunter New England or North Coast.
Prevalence measures were calculated using weighted data. Further information on the weighting and data analysis
process is provided elsewhere.20,23
Response rate
In total, 5681 interviews were conducted with NSW residents aged 65 years and over, with at least 675 inter-views in each former area health service. The overall response rate was 60.8%, with 4.9% of interviews con-ducted in a language other than English. The majority of participants answered questions on their own behalf. However, proxy respondents were required for 361 parti-cipants (6.4%) unable to answer on their own behalf due to communication difficulties or cognitive impairment.
Results
Falls in the last 12 months
In 2009, 25.6% of older people in NSW reported falling at least once in the last 12 months (Table 1). There was no significant difference in falls prevalence in the last 12 months between males and females. A significantly lower proportion of older adults aged 65–69 years (21.5%,
p¼0.000004), and a significantly higher proportion of
older adults aged 85–89 years (34.0%,p¼0.000743) and
90 years and over (35.9%, p¼0.024429) had fallen in
the last 12 months, compared with the overall older adult population.
Number of falls in the last 12 months
age from 1.78 among those aged 65–69 years to 2.67 among those aged 90 years and over.
Persons injured as a result of falls
Of those persons who fell in the last 12 months, 66.1% sustained an injury as a result of a fall (Table 1). There was no significant difference between age groups; however,
a significantly lower proportion (p¼0.000111) of males
(60.0%) than females (71%), and a significantly higher
proportion of adults (p¼0.020515) in metropolitan health
areas (68.5%) than rural health areas (62.1%) experienced an injury as a result.
When asked about their most recent fall, the most common injuries reported were cuts, grazes or bruises (71%) and
sprains or strains (9.9%) (Table 2). Respondents could report more than one type of injury.
Persons requiring a visit to hospital as a result of falls Among older adults who had fallen in the last 12 months, 20% required a visit to hospital as a result of a fall (Table 1). There was no significant difference between males and females. Among those who fell, a significantly higher proportion of older adults aged 85–89 years (31.5%,
p¼0.006096) required a visit to hospital, compared with
the overall older adult population.
Persons admitted to hospital as a result of falls
Among older adults who had fallen in the last 12 months, 10.7% required admission to hospital as a result of a fall Table 2. Injuries reported from most recent fall, adults aged 65 years and over who were injured in a fall in the last
12 months, NSW, 2009
Response Males
% (95% CI)
Females % (95% CI)
Persons % (95% CI)
Head injury (including eyes and teeth) 3.5 (1.2–5.9) 3.2 (1.6–4.8) 3.3 (2.0–4.7)
Spinal injury 1.6 (0.0–3.2) 0.6 (0.0–1.1) 1.0 (0.2–1.7)
Fractured arms or hands 1.6 (0.0–3.2) 0.6 (0.0–1.1) 1.0 (0.2–1.7)
Fractured ribs or sternum 2.2 (0.6–3.7) 3.1 (1.5–4.7) 2.7 (1.6–3.9)
Fractured hip, femur or pelvis 1.8 (0.1–3.5) 2.0 (0.8–3.3) 1.9 (0.9–2.9)
Fractured lower leg, knees or feet 2.9 (0.9–4.9) 3.7 (2.0–5.4) 3.4 (2.1–4.7)
Sprain or strain 12.1 (8.2–16.1) 8.4 (5.8–11.0) 9.9 (7.7–12.1)
Dislocation 1.2 (0.0–2.6) 1.1 (0.2–2.0) 1.2 (0.4–1.9)
Cuts, grazes or bruises 69.8 (64.2–75.5) 71.8 (67.5–76.1) 71.0 (67.6–74.5)
Other 13.2 (9.1–17.3) 14.9 (11.7–18.2) 14.2 (11.7–16.8)
Respondents could provide more than one response. Estimates are based on 915 respondents.
Source: NSW Falls Prevention Baseline Survey (HOIST). Centre for Epidemiology and Research and Centre for Health Advancement, NSW Department of Health.
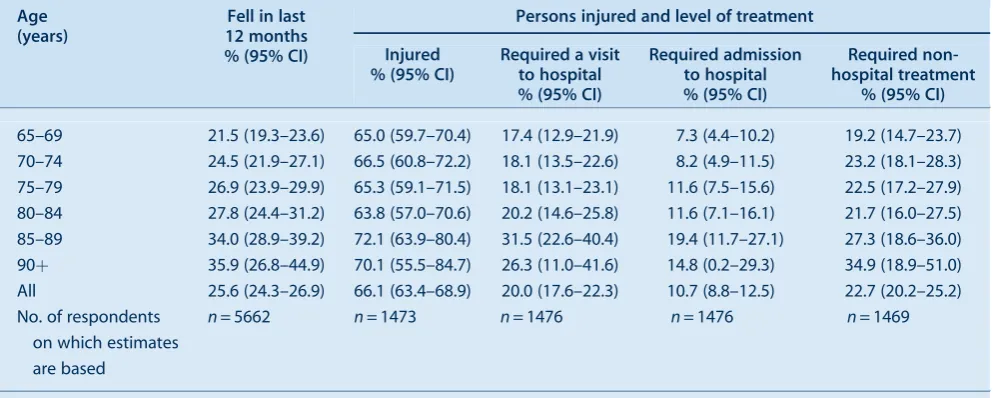
Table 1. Prevalence of falls, fall-related injury and level of treatment in the last 12 months, adults aged 65 years and over, NSW, 2009
Age (years)
Fell in last 12 months % (95% CI)
Persons injured and level of treatment
Injured % (95% CI)
Required a visit to hospital % (95% CI)
Required admission to hospital % (95% CI)
Required non-hospital treatment
% (95% CI)
65–69 21.5 (19.3–23.6) 65.0 (59.7–70.4) 17.4 (12.9–21.9) 7.3 (4.4–10.2) 19.2 (14.7–23.7)
70–74 24.5 (21.9–27.1) 66.5 (60.8–72.2) 18.1 (13.5–22.6) 8.2 (4.9–11.5) 23.2 (18.1–28.3)
75–79 26.9 (23.9–29.9) 65.3 (59.1–71.5) 18.1 (13.1–23.1) 11.6 (7.5–15.6) 22.5 (17.2–27.9)
80–84 27.8 (24.4–31.2) 63.8 (57.0–70.6) 20.2 (14.6–25.8) 11.6 (7.1–16.1) 21.7 (16.0–27.5)
85–89 34.0 (28.9–39.2) 72.1 (63.9–80.4) 31.5 (22.6–40.4) 19.4 (11.7–27.1) 27.3 (18.6–36.0)
90þ 35.9 (26.8–44.9) 70.1 (55.5–84.7) 26.3 (11.0–41.6) 14.8 (0.2–29.3) 34.9 (18.9–51.0)
All 25.6 (24.3–26.9) 66.1 (63.4–68.9) 20.0 (17.6–22.3) 10.7 (8.8–12.5) 22.7 (20.2–25.2)
No. of respondents on which estimates are based
n= 5662 n= 1473 n= 1476 n= 1476 n= 1469
Denominator is persons who fell at least once.
Source: NSW Falls Prevention Baseline Survey (HOIST). Centre for Epidemiology and Research and Centre for Health Advancement, NSW Department of Health.
Falls among community-dwelling older people
(Table 1). There was no significant difference between males and females. Among those who fell, a significantly lower proportion of older adults aged 65–69 years (7.3%,
p¼0.011001), and a significantly higher proportion of
older adults aged 85–89 years (19.4%, p¼0.016115),
required admission to hospital, compared with the overall older adult population. Among those who fell, a
signifi-cantly higher proportion (p¼0.011548) of older adults in
metropolitan health areas (12.2%) than rural health areas (7.9%) required admission to hospital as a result of a fall.
Persons requiring other non-hospital medical treatment as a result of falls
Among older adults who had fallen in the last 12 months, 22.7% required medical treatment without hospitalisation as a result of a fall. A significantly lower proportion
(p¼0.033542) of males (19.7%) than females (25.1%)
required medical treatment without hospitalisation as a result of a fall. There was no significant difference among age groups or between metropolitan and rural health areas.
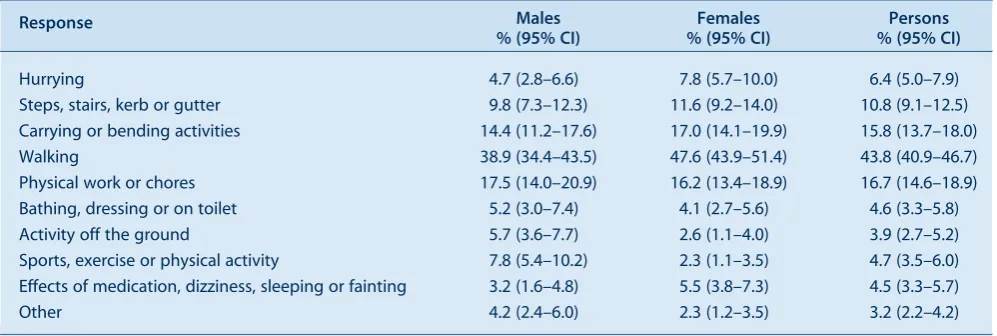
Activities undertaken when most recent fall occurred The most common activities undertaken when the most recent fall occurred were: walking (43.8%); physical work or chores (16.7%); carrying or bending activities (15.8%); and negotiating steps, stairs, kerbs or gutters (10.8%) (Table 3).
Perceived causes of most recent fall
The most common perceived causes of the most recent fall were: tripped or slipped (27.4%); surrounding hazards, for example wet or uneven floor (21.8%); misjudged, over-balanced, or over-reached (17.8%); and fainting, dizziness, illness, or legs gave way (17.7%). Respondents could report more than one cause.
Discussion
The results of the 2009 NSW Falls Prevention Baseline
Survey20 are consistent with findings reported in the
Australian and international literature. For example, in NSW in 2009, 25.6% of older adults reported falling in the last 12 months compared with approximately 30%
in the published literature.6–11The Survey also confirmed
that many older people living in the community fall more than once and that the frequency of falls experienced by
older people increases with age.10,11 The most common
injuries reported in the Survey by older people who had fallen were similar to those reported in the literature (relatively minor cuts, grazes or bruises). Fractured hips were a relatively uncommon outcome with only 1.9% of persons in the Survey injured as the result of a fall reporting a fractured hip, femur or pelvis compared to a range of
0.2–1.5% for hip fractures in the literature.12However, it is
possible that the Survey underestimated the frequency of these serious injuries as older people who had moved to residential care or died as a result of such injuries would not be included in the data. Consistent with the literature, most
falls occurred in the home environment.13–15
There were, however, some exceptions to the homogeneity of these results. Of those who fell, 66.1% reported experiencing an injury compared to estimates in the
literature ranging between 22% and 60%.12 While the
prevalence of injury may vary depending on the population under study, the definition of an injury also varies consid-erably between studies. In this case, minor injuries such as bruises, cuts and abrasions were included and this may account for the higher prevalence of injury reported here.
These findings on the prevalence, type and place of injury can assist in falls prevention program design and imple-mentation. Importantly, the Survey also provides a Table 3. Activities reported being undertaken when most recent fall occurred, adults aged 65 years and over who had a fall in the last 12 months, NSW, 2009
Response Males
% (95% CI)
Females % (95% CI)
Persons % (95% CI)
Hurrying 4.7 (2.8–6.6) 7.8 (5.7–10.0) 6.4 (5.0–7.9)
Steps, stairs, kerb or gutter 9.8 (7.3–12.3) 11.6 (9.2–14.0) 10.8 (9.1–12.5)
Carrying or bending activities 14.4 (11.2–17.6) 17.0 (14.1–19.9) 15.8 (13.7–18.0)
Walking 38.9 (34.4–43.5) 47.6 (43.9–51.4) 43.8 (40.9–46.7)
Physical work or chores 17.5 (14.0–20.9) 16.2 (13.4–18.9) 16.7 (14.6–18.9)
Bathing, dressing or on toilet 5.2 (3.0–7.4) 4.1 (2.7–5.6) 4.6 (3.3–5.8)
Activity off the ground 5.7 (3.6–7.7) 2.6 (1.1–4.0) 3.9 (2.7–5.2)
Sports, exercise or physical activity 7.8 (5.4–10.2) 2.3 (1.1–3.5) 4.7 (3.5–6.0)
Effects of medication, dizziness, sleeping or fainting 3.2 (1.6–4.8) 5.5 (3.8–7.3) 4.5 (3.3–5.7)
Other 4.2 (2.4–6.0) 2.3 (1.2–3.5) 3.2 (2.2–4.2)
Respondents could provide more than one response. Estimates are based on 1465 respondents.
baseline for the evaluation of the impact ofNSW Health Plan for Prevention of Falls and Harm from Falls Among Older People: 2011–201519by providing not only much needed data on falls prevalence, but state and area mea-sures of risk and protective factors, contact with health professionals, falls prevention knowledge and exposure to preventative interventions. Together these measures are a central part of the NSW Falls Plan Evaluation Framework. This framework will also include the ongoing monitoring of a subset of fall-related questions in the continuous NSW Population Health Survey and a follow-up survey in 2015.
Despite the representative nature of the Survey sample, there are a number of limitations which should be noted. The falls status data from the Survey may be subject to recall bias as respondents were asked to report on falls and treatment for fall-related injuries in the previous 12 months. However, a review of cohort studies by Ganz
et al24showed that, in three studies for which data were
available, recall of any fall in the previous year is relatively specific (91–95%), but somewhat less sensitive (80–89%) than intensive prospective data collection involving post-cards or diaries. One study conducted in Australia also showed that individuals who suffered an injurious fall were significantly more likely to recall their falls than those who
were not injured.25
Despite the large sample size, caution should be used in interpreting results where wide confidence intervals are reported. As the Survey relied on self-reporting, age-related cognitive deficits may have compromised accurate reporting in some respondents. To minimise this risk interviewers were trained in the delivery of surveys to older people and proxy respondents were allowed when eligible participants were unable to complete interviews themselves.
Despite these limitations it is encouraging that the 2009 Survey results, for the most part, are consistent with the literature. The consistency in findings may suggest that the aetiology of falls in community-dwelling older people in developed countries remain relatively stable over time, as evidenced by the fact that some of the data in the literature was generated over three decades.
Conclusion
Despite the different methodologies described in the liter-ature to ascertain fall prevalence, circumstances and the consequences of falls, the findings from this large, repre-sentative, population level survey of community-dwelling older people are similar to the body of evidence in this area. The results of this Survey provide information relevant to the design of falls prevention programs and an important set of measures of the impact of falls prevention policy implementation in NSW.
TheNew South Wales Falls Prevention Baseline Survey: 2009 Reportis available in both HTML and PDF versions from the NSW Department of Health website at: www.health.nsw.gov.au.
Acknowledgments
The authors would like to acknowledge the important contri-bution of Frances Garden, Matthew Gorringe, Lara Harvey, Naomi Jackson, Ming Lin, Don Bryson-Taylor, Ray Ferguson and Lindy Fritsche to the development, data collection and analysis of the Survey.
References
1. National Ageing Research Institute. An analysis of research on preventing falls and falls injuries in older people: Community, residential care and hospital settings. Canberra: Commonwealth of Australia; 2004.
2. NSW Department of Health. Management Policy to Reduce Fall Injury Among Older People – Detailed strategies and performance requirements 2003–2007. North Sydney: NSW Department of Health; 2003.
3. Tinetti ME, Williams CS. The effect of falls and fall injury on functioning in community-dwelling older persons.J Gerontol A Biol Sci Med Sci1998; 53(2): M112–9.
4. American Geriatrics Society. British Geriatrics Society and American Academy of Orthopaedic Surgeons Panel on Falls Prevention Guideline for the prevention of falls in older persons.
J Am Geriatr Soc2001; 49(5): 664–72.
5. Treasury of the Commonwealth of Australia. Intergenerational Report 2010: Australia to 2050, Future Challenges. Canberra: Commonwealth of Australia; 2010. Available from:
www.treasury.gov.au/igr/igr2010 (Cited 9 July 2010.)
6. Campbell AJ, Reinken J, Allan BC, Martinez GS. Falls in old age: a study of frequency and related clinical factors.Age Ageing
1981; 10(4): 264–70. doi:10.1093/ageing/10.4.264
7. Prudham D, Grimley-Evans J. Factors associated with falls in the elderly: a community study.Age Ageing1981; 10(3): 141–6.
8. Blake A, Morgan K, Bendall MJ, Dallosso H, Ebrahim SB, Arie TH et al. Falls by elderly people at home: prevalence and associated factors.Age Ageing1988; 17(6): 365–72. doi:10.1093/ageing/17.6.365
9. Steven JA, Ryan G, Kresnow M. Fatalities and injuries from falls among older adults – United States, 1993–2003 and 2001–2005.
MMWR2006; 55(45): 1221–4.
10. NSW Department of Health. The epidemiology of falls in older people in NSW. North Sydney: NSW Department of Health; 1994.
11. Gill T, Taylor AW, Pengelly A. A population-based survey of factors relating to the prevalence of falls in older people.
Gerontology2005; 51(5): 340–5. doi:10.1159/000086372
12. Lord S, Sherrington C, Menz H, Close J. Falls in older people: risk factors and strategies for prevention. Cambridge: Cambridge University Press; 2008.
13. Luukinen H, Koski K, Laippala P, Kivela¨ SL. Predictors for recurrent falls among the home-dwelling elderly.Scand J Prim Health Care1995; 13(4): 294–9. doi:10.3109/
02813439508996778
14. Campbell AJ, Borrie MJ, Spears GF, Jackson SL, Brown JS, Fitzgerald JL. Circumstances and consequences of falls
Falls among community-dwelling older people
experienced by a community population 70 years and over during a prospective study.Age Ageing1990; 19(2): 136–41. doi:10.1093/ageing/19.2.136
15. Gibson MJ, Andres RO, Isaacs B, Radebaugh T, Worm-Petersen J. The prevention of falls in later life. A report of the Kellogg International Work Group on the Prevention of Falls by the Elderly.Dan Med Bull1987; 34(Suppl. 4): 1–24.
16. Centers for Disease Control and Prevention. Falls among older Americans: CDC prevention efforts. CDC: Atlanta; 2002.
17. Resnick B, Junlapeeya P. Falls in a community of older adults: findings and implications for practice.Appl Nurs Res2004; 17(2): 81–91.
18. Cripps R, Carman J. Falls by the elderly in Australia: trends and data for 1998. Injury Research and Statistics Series (AIHW cat. No. INJCAT 35). Adelaide: Australian Institute of Health and Welfare; 2001.
19. NSW Department of Health. NSW Health Plan for Prevention of Falls and Harm from Falls Among Older People: 2011–2015. North Sydney: NSW Department of Health; 2011.
20. Centre for Health Advancement and Centre for Epidemiology and Research. New South Wales Falls Prevention Baseline Survey: 2009 Report. North Sydney: NSW Department of Health; 2010. Available from: www.health.nsw.gov.au (Cited 10 March 2011.)
21. Australia on Disk [software]. Sydney: Australia on Disk; 2004.
22. MapInfo [software]. Troy, NY: MapInfo Corporation; 1997.
23. Steel D. New South Wales Population Health Survey: Review of weighting procedures. North Sydney: NSW Department of Health; 2006. Available from: www.health.nsw.gov.au/pubs/ 2006/review_weighting.html (Cited 6 July 2010.)
24. Ganz D, Higashi T, Rubenstein LZ. Monitoring falls in cohort ctudies of community-dwelling older people: effect of the recall interval.J Am Geriatr Soc2005; 53(12): 2190–4. doi:10.1111/ j.1532-5415.2005.00509.x
Characteristics of fall-related injuries attended
by an ambulance in Sydney, Australia:
a surveillance summary
Susan L. Thomas
A,D, David J. Muscatello
B,
Paul M. Middleton
Cand Wei Zheng
B ANSW Public Health Officer Training Program, NSW Department of Health
B
Centre for Epidemiology and Research, NSW Department of Health
C
Ambulance Research Institute, Ambulance Service of NSW D
Corresponding author. Email: [email protected]
Abstract: In NSW, fall-related injury costs the health system more than any other single cause of injury. A public health surveillance database containing information routinely recorded by the Ambulance Service of NSW was used to define the epidemiology and characteristics of fall-related calls in the Sydney metropolitan area in 2008. The dataset contained 37 488 fall-related calls, representing a crude rate of ambulance call-outs for falls of 843 per 100 000 population. Females accounted for 57% of all fall-related calls, and the female rate of injury to the ‘hip to foot’ region increased with age. Males in all age groups reported ‘head and neck’ injury most often. In an analysis of a random sample of 1200 calls, 70% of ambulance dispatches were to a home or residen-tial institution. The findings of this study on the risks for fall-related injury can be used to guide policy for ambulance service delivery. Expansion of data linkage to emergency department and admitted patient databases would provide infor-mation to further describe the epidemiology of falls in NSW.
Falls account for approximately one-third of all
injury-related hospitalisations and one-fifth of all fatal injuries1
and contribute substantially to the burden on health ser-vices in Australia. Each year, one in three older people will experience a fall and will then be at risk of experiencing
further falls.2 In the period 2003–2004, falls in older
Australians that required hospitalisation were estimated to cost $566 million. Indirect costs such as lost productivity and costs borne by the patient, family and community were
estimated to exceed $1 billion annually.1
In 2005–2006, the number of new cases of fall injuries in people aged 65 years and over that resulted in hospitali-sation was more than 66 800, which represents a 10% increase since 2003–2004. Age-standardised rates of fall injuries for older people have also risen since 2003–2004,
despite screening and prevention programs.3
In New South Wales (NSW), fall-related injury costs the
health system more than any other single cause of injury.4
Falls accounted for 38% of injury-related hospitalisations in NSW in the period 2004–2005 to 2006–2007. In 2006–2007, there were 43 762 hospitalisations and an age-standardised rate of 587 per 100 000 population. More than half of those hospitalised were aged over 65 years (a rate of 2747 per 100 000). In this age group, the rate of hospitalisation was higher for females (3073 per 100 000)
than males (2275 per 100 000).4
Falls are the second most common reason for emergency
ambulance calls in Sydney5 however there is limited
published information on ambulance call-outs for falls in NSW. We used a public health surveillance database containing information routinely recorded by the Ambu-lance Service of NSW to describe the epidemiology and characteristics of fall-related ambulance calls in the Sydney metropolitan area in 2008.
Methods Data source
The Ambulance Service of NSW uses Medical Priority
Dispatch SystemTM (MPDS) software to gather data
systematically from 000 callers to prioritise responses. Details of computer-aided ambulance dispatches are recorded in a database at the regional ambulance head-quarters. The NSW Department of Health receives hourly updates of these data from the Sydney Ambulance Opera-tions Region, which are used to supplement near-real-time emergency department surveillance of communicable and
non-communicable conditions.6
For this study, we extracted the records of all emergency ambulance calls assigned a problem category of ‘fall’ in 2008. After 1218 exclusions for cancellations, transfers to other regions, duplicates and hoaxes, we were left with a dataset of 37 488 calls for which an ambulance was dispatched. Age and gender were known for 93% of calls.
The variables used in the analysis were: age, gender, time of call, local government area, call priority (1 or 2), the person’s consciousness and breathing status at the time of the call and the description of the location of the patient. The comment text field, which contains a description of the problem by the caller, was also included to permit analysis of the body region of the injury. The time of the call was categorised as ‘daytime’ (0800–1800 inclusively) or ‘out of hours’.
Manual categorisation of a random sample of records To categorise the place of the fall and reported injuries sustained, a random sample of 1200 (3.2%) call records was selected from the complete data set with the SAS RANUNI function. Descriptions of the patients’ location
and comment texts were reviewed and manually cate-gorised. To be consistent with reports on hospitalisations
for falls injuries,3 we based our categorisation of place
of fall on the external cause of morbidity and mortality rubrics of the International Classification of Diseases,
Revision 10, Australian Modification (ICD-10-AM).7
We grouped the body locations of injury into ‘head and neck’, ‘hip to foot’, ‘shoulder to hand’, ‘trunk/back/ pelvis’, ‘multiple body regions’, ‘no injury’ or ‘unspecified’. ‘No injury’ was based on comments that the person had no injuries. We also classified whether the call was to request a ‘lift only’, where assistance was required only for getting up after a fall. Information on the type of fall was missing for approximately 40% of calls.
Counts from the random sample were scaled to estimate counts for the Sydney region, and confidence intervals for proportions were calculated by exact binomial methods.
Data analysis
Analysis was performed with SAS statistical software (version 9.2, SAS Institute, Cary, NC, USA). Age-specific
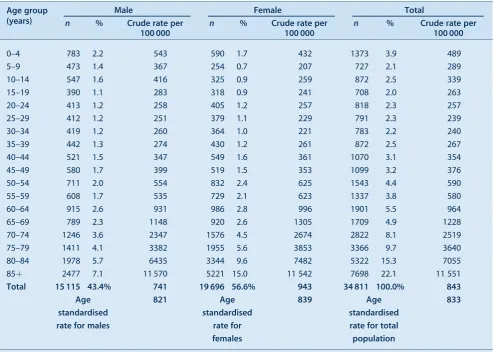
Table 1. Age and gender of patients who had a fall-related ambulance call in the Sydney metropolitan area, 2008
Age group (years)
Male Female Total
n % Crude rate per
100 000
n % Crude rate per
100 000
n % Crude rate per
100 000
0–4 783 2.2 543 590 1.7 432 1373 3.9 489
5–9 473 1.4 367 254 0.7 207 727 2.1 289
10–14 547 1.6 416 325 0.9 259 872 2.5 339
15–19 390 1.1 283 318 0.9 241 708 2.0 263
20–24 413 1.2 258 405 1.2 257 818 2.3 257
25–29 412 1.2 251 379 1.1 229 791 2.3 239
30–34 419 1.2 260 364 1.0 221 783 2.2 240
35–39 442 1.3 274 430 1.2 261 872 2.5 267
40–44 521 1.5 347 549 1.6 361 1070 3.1 354
45–49 580 1.7 399 519 1.5 353 1099 3.2 376
50–54 711 2.0 554 832 2.4 625 1543 4.4 590
55–59 608 1.7 535 729 2.1 623 1337 3.8 580
60–64 915 2.6 931 986 2.8 996 1901 5.5 964
65–69 789 2.3 1148 920 2.6 1305 1709 4.9 1228
70–74 1246 3.6 2347 1576 4.5 2674 2822 8.1 2519
75–79 1411 4.1 3382 1955 5.6 3853 3366 9.7 3640
80–84 1978 5.7 6435 3344 9.6 7482 5322 15.3 7055
85þ 2477 7.1 11 570 5221 15.0 11 542 7698 22.1 11 551
Total 15 115 43.4% 741 19 696 56.6% 943 34 811 100.0% 843
Age standardised rate for males
821 Age
standardised rate for females
839 Age
standardised rate for total population
833
Of a total 37 488 calls, 2677 (7.1%) were excluded from this analysis because of missing age or sex. Australian standard population Census 2001 used to calculate population rates.
rates were calculated from the total age-specific popula-tions of the local government areas included in the Sydney Ambulance Operations region, which includes areas from the Hawkesbury River in the north, to Bowral in the south and Mount Victoria in the west. To compare overall rates in males and females independently of age, direct age-standardised rates were calculated for each gender from the
Australian standard population in the 2001 census.8
Results
The crude rate of call-outs for falls was 843 per 100 000 population. The lowest rates were for people aged 25–34
years, with higher rates for children aged under 5 years. The rates increased dramatically from age 50, from around 585 to 11 551 per 100 000 in people aged 85 years and over (Table 1).
Females accounted for 57% of fall-related calls, and 25% of all calls were for women aged 80 years and over. For people aged under 50 years, the rates were generally higher for males, but women over this age had higher rates, until over 85 years when the rates in the two sexes were similar. The crude rates for females were higher than for males (943 and 741 per 100 000, respectively). After direct age standardisation, the rates were similar, with 839 and 821 per 100 000 for females and males, respectively (Table 1).
Fifty-six percent (21 048) of calls were assigned a priority code 1, requiring an immediate response. The patient was reported as conscious in 92% (34 601) and breathing in 94% (35 116) of calls. Sixty percent (22 420) of calls were received during ‘daytime hours’.
In the random sample, 58% (95% confidence interval (CI), 55–61) of ambulance dispatches were to a home, 14% (95% CI, 12–16) to a trade or service area and 12% (95% CI, 10–13) to a residential institution (Table 2).
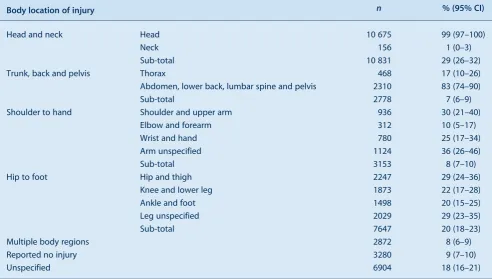
Twenty-nine percent (95% CI, 26–32) of callers reported ‘head and neck’ injuries; 20% (95% CI, 18–23) reported injuries to the ‘hip to foot’ region; and 9% (95% CI, 7–10)
Table 3. Estimated incidence of injury by body region from a random sample of 1200 fall-related ambulance calls in the Sydney metropolitan area, 2008
Body location of injury n % (95% CI)
Head and neck Head 10 675 99 (97–100)
Neck 156 1 (0–3)
Sub-total 10 831 29 (26–32)
Trunk, back and pelvis Thorax 468 17 (10–26)
Abdomen, lower back, lumbar spine and pelvis 2310 83 (74–90)
Sub-total 2778 7 (6–9)
Shoulder to hand Shoulder and upper arm 936 30 (21–40)
Elbow and forearm 312 10 (5–17)
Wrist and hand 780 25 (17–34)
Arm unspecified 1124 36 (26–46)
Sub-total 3153 8 (7–10)
Hip to foot Hip and thigh 2247 29 (24–36)
Knee and lower leg 1873 22 (17–28)
Ankle and foot 1498 20 (15–25)
Leg unspecified 2029 29 (23–35)
Sub-total 7647 20 (18–23)
Multiple body regions 2872 8 (6–9)
Reported no injury 3280 9 (7–10)
Unspecified 6904 18 (16–21)
Table 2. Estimated incidence of falls by location of patient from a random sample of 1200 fall-related ambulance calls in the Sydney metropolitan area, 2008
Location of patient n % (95% CI)
Home 21 694 58 (55–61)
Residential institution 4308 12 (10–13)
School/public administrative area 1654 4 (3–6)
Sports/athletic area 312 1 (0–2)
Street/highway 3246 9 (7–10)
Trade/service area 5306 14 (12–16)
Industrial/construction area 125 0 (0–1)
Other specified 593 2 (1–2)
Unspecified place 250 1 (0–1)
Total 37 488
Characteristics of fall-related injuries attended by an ambulance
reported ‘no injury’ (Table 3). Six percent (2247; 95% CI, 5–7) were calls for a ‘lift only’.
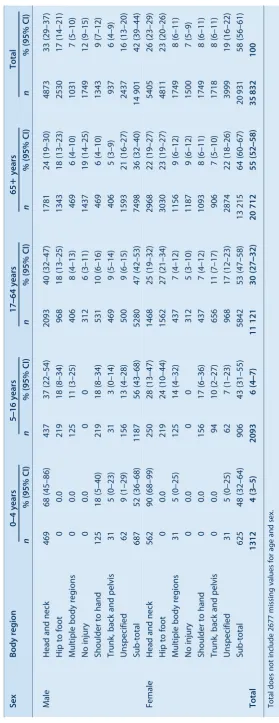
For males, calls reporting injuries to the ‘head and neck’ region dominated all age groups. In females, injuries to the ‘hip to foot’ region were just as common as injuries to the ‘head and neck’ region. Among children aged under 5 years, calls for ‘head and neck’ injuries comprised a far greater proportion than for other age groups, with 68% (95% CI, 45–86) of calls for boys and 90% (95% CI, 68–99) of those for girls relating to the head or neck (Table 4).
Discussion
We found a high rate of fall-related ambulance calls in the Sydney region, particularly for the elderly population, which confirms the high burden of falls injury. The rate of fall-related calls increased from age 50 years onwards. Older women experienced falls requiring an ambulance at a higher rate than men and had higher rates of reported injuries to the ‘hip to foot’ region. Hip injury or hip fracture may account for many of these injuries, and the greater risk of older
women may reflect their higher prevalence of osteoporosis.9
The high rate of fall-related ambulance calls for older persons, particularly older women, is consistent with the
epidemiology of fall-related hospital admissions in NSW.4
Our finding that 70% of fall-related calls among people of all ages occurred at home or in a residential institution is similar to the national figure of 71% of falls by older persons requiring hospitalisation taking place in the home
or in an aged-care facility.3
The high priority assigned to most falls reinforces the fact that falls can be responsible for serious injury and that rapid assistance is often required; nevertheless, many people may experience little or no injury. Some calls were to request a ‘lift only’. The use of ambulance services by people who only require assistance to get up warrants further consideration owing to its resource implications.
Ambulance services are well placed to explore a variety of service options related to falls, such as assessment, screen-ing and treatment, and to direct referrals to general practi-tioners or community health services. Such strategies may meet the needs of patients and prevent unnecessary trips to an emergency department. An ambulance dispatch database could expand the range of information available for public health surveillance of fall-related injuries in the population, and could provide valuable information for guiding the development of a fall-related ambulance service delivery policy.
Once paramedics arrive on the scene, a ‘patient health care record’ is completed which documents the assessment, findings and treatment. This information is transcribed
into a database by Ambulance Service of NSW data coders. These records contain information that could add to the understanding of falls in the community, the response of ambulance services and the overall picture of the burden of falls. Linking these two databases would greatly expand the range of information available to study the character-istics and outcomes of fall injuries. An electronic version of the patient health care record is being developed, which will improve its timeliness. Further linkage to emergency department and admitted patient databases would clearly provide the optimal information for further describing the epidemiology of falls in NSW.
This study has some limitations. The dataset we used had some missing values, perhaps due to the nature of 000 calls, as the callers may be injured, stressed or confused. As a substantial proportion of records lacked information on the circumstance of the fall and whether the patient was transported to hospital, we could not analyse these factors. The time-critical nature of 000 calls may obviate the collection of more detailed information, but consideration should be given to incorporating a simple cause-of-injury classification into call-taking. The lack of information on patient transport may improve with advances in database technology for collecting the information.
Conclusion
As the population ages and both the number and the age-standardised rate of fall injuries increases, falls and fall-related injuries will account for an increasing number of ambulance calls. The findings of this study could be used to guide policy for ambulance service delivery.
Acknowledgments
NSW Public Health Officer Training Program, NSW Department of Health. Scott Deeth, Manager Medical Dispatch Standards, Ambu-lance Service of NSW. Andrew McNamara, Object Craft Pty Ltd, for assistance in developing the ambulance surveillance database.
References
1. Australian Institute of Health and Welfare. Australia’s health 2008. Cat. No. AUS 99. Canberra: AIHW; 2008.
2. National Ageing Research Unit. Report to the Australian Government Department on Health and Ageing, Injury Prevention Section. An analysis of research on preventing falls and falls injury in older people: Community, residential care and hospital settings (2004 update). Canberra:
Commonwealth of Australia; 2004.
3. Bradley C, Pointer S. Hospitalisations due to falls by older people, Australia 2005–2006. Injury research and statistics series number 50. Cat. no. INJCAT 122. Adelaide: AIHW; 2009.
4. Population Health Division, NSW Department of Health. 2008. The health of the people of New South Wales – Report of the Chief Health Officer, Data Book – Injury & Poisoning. Available from: http://www.health.nsw.gov.au/publichealth/chorep/ databooks/inj_databook.asp (Cited 30 June 2010.)
Characteristics of fall-related injuries attended by an ambulance
5. Bower A, Bendall J, Freitas H, Bawden J. Falls screening and intervention: a new approach by ambulance service NSW extended care paramedics. Poster presentation at the Australia and New Zealand Falls Prevention Society 3rd Australian and New Zealand Falls Prevention Conference, 12–14 October 2008.
6. Muscatello DJ, Churches T, Kaldor J, Zheng W, Chiu C, Correll P et al. An automated, broad-based, near real-time public health surveillance system using presentations to hospital emergency departments in New South Wales. Australia.BMC Public Health2005; 5: 141. doi:10.1186/1471-2458-5-141
7. National Centre for Classification in Health. The International Statistical Classification of Diseases and Related Health
Problems, 10th revision, Australian modification (ICD-10-AM). Sydney: National Centre for Classification in Health, Faculty of Health Sciences, University of Sydney; 1998.
8. Australian Bureau of Statistics. Australian Demographic Statistics, Dec 2009. Available from: http://www.abs.gov.au/ AUSSTATS/[email protected]/mf/3101.0/ (Cited 21 July 2009.)
The cost of fall-related injuries among older
people in NSW, 2006
–
07
Wendy L. Watson
A,D, Angela J. Clapperton
Band Rebecca J. Mitchell
A,CA
NSW Injury Risk Management Research Centre, The University of New South Wales
B
Monash University Accident Research Centre ( formerlyA) C
Department of Aviation, The University of New South Wales D
Corresponding author. Email: [email protected]
Abstract:This study aimed to establish compre-hensive estimates of the cost of fall-related injury among older people in NSW. A health service utilisation approach was used to estimate the cost of hospital treatment, residential care and ambu-lance transport. Other costs were estimated by deriving ratios of inpatient costs to other services from the literature. In the 2006–07 financial year, 251 000 (27%) of older people fell at least once and suffered, in total, an estimated 507 000 falls. An estimated 143 000 medically treated fall-related injuries among older people resulted in lifetime treatment costs of $558.5 million. Although only 18% of these injuries resulted in hospital admission, the cost of care associated with these cases accounted for 84.5% of the total cost. The cost of fall-related injury among older people in NSW in 2006–07 is a significant increase over earlier estimates and underscores the urgent need for effective preventive efforts across the state.
Injuries from falls represent a significant public health problem. Around one in three older adults living in the community are estimated to fall each year and many
individuals fall more than once.1–4 An injurious fall can
have significant personal consequences as often
indivi-duals are not able to return to their pre-fall activities.5As
well as the injury, associated pain and disability suffered,
falls can instil a fear of falling,6decrease levels of activity,7
raise levels of anxiety and depression,8and result in
post-traumatic stress disorder,9loss of independence,6
admis-sion to residential care10and sometimes death.
As the New South Wales (NSW) population ages, fall-related injuries among older adults (aged 65 years and over) will place increased demand on the health sys-tem.11–13Fall-related injuries among older people – mainly hip and other fractures – consume a disproportionate share of hospital resources; no other injury cause, including road
trauma, costs the NSW health system more.14
In recent years there have been a number of international studies that have developed comprehensive estimates
of the cost of fall injuries.15–17 Estimates of the cost of
injuries are necessary to guide decision makers in deter-mining funding priorities and to support cost-effectiveness and cost-benefit analyses of the most effective means of preventing injury.
To date, there has been only one population-level study conducted in NSW which estimated the cost of fall-related
injuries.14 However, these costs were established in the
context of a broader all-age, all-injury study which included limited cost components and is now quite dated. Con-sequently, a study was commissioned by NSW Health to provide comprehensive, up-to-date estimates of the costs associated with fall-related injuries to underpin the next iteration of the state falls prevention plan and to provide input for cost-benefit analyses of falls prevention programs.
The aim of this study was to quantify the economic burden of injuries associated with falls in people aged 65 years and over in NSW during the 2006–07 financial year. This paper
summarises the findings from the study report.18
Methods
The methods are outlined briefly here. A detailed
descrip-tion of the methods can be found in the study report.18
Incidence estimation
In order to develop cost estimates it was necessary to establish the incidence of fall-related injuries for which treatment was sought. Estimates of the incidence of medi-cally treated fall-related injuries were developed using data from several sources. These included the:
• NSW Admitted Patients Dataset to estimate the total number of incident hospital admissions due to falls in older people.
• Victorian Admitted Episodes Dataset and Victorian Emergency Minimum Dataset to establish the ratios of
admitted to non-admitted emergency department pre-sentations for each gender and 5-year age-group. These ratios were then applied to the estimated number of fall-related incident hospital admissions to derive an esti-mate of emergency department attendances for NSW. • 2009 NSW Falls Prevention Survey, in combination
with the NSW estimated resident population, at 31 December 2006, by gender and 5-year age group, derived from Australian Bureau of Statistics online
population data19 to estimate the number of people
who fell, the number of falls experienced and the number of fall-related injuries that were treated in a non-hospital setting.
The selection of the cases from these datasets was confined to persons aged 65 years and over and the following three mutually exclusive categories of care were identified for the purpose of this study: hospital admissions; emergency department presentations (not admitted); and non-hospital treatment (including general practitioners and allied health professionals).
Estimates of the number of emergency and non-emergency ambulance trips and the number of older people living in the community who were transferred to residential aged care following a fall-related hospital admission were also developed to facilitate cost estimation.
Cost estimation
Costs were estimated separately for each category of care defined in the previous section. Estimated costs included all relevant treatment and care services such as inpatient care (admitted cases only), ambulance, emergency depart-ment treatdepart-ment, outpatient treatdepart-ment, pharmaceuticals, medical and other health service provision, and residential aged care or home nursing, domestic services and home modifications.
For cost components where there were reasonably solid health service utilisation data available, such as for hospi-tal inpatient care, emergency department treatment, ambu-lance transport and residential aged care, a ‘bottom-up’ health service utilisation approach was used.
Inpatient hospital costs were calculated using the Australian-Refined–Diagnosis-Related Group (AR-DRG) codes. Average AR-DRG Version 5.0 costs were applied
to each episode of care using data from the NSW Cost
of Care Standards 2006/07.20 Individuals who attended the emergency department but were not admitted were assigned an average cost and the average cost of emergency and non-emergency ambulance transport was assigned to the estimated number of trips in each category. The cost of respite and permanent residential aged care was calculated using estimates of the number of community-dwelling older people discharged to aged-care facilities following a fall injury and applying average lengths of stay and
average cost per place-day.21 Costs beyond 1 year were
discounted at 5% per annum in line with current Australian practice. The cost of residential aged care was not included for those already residing in an aged-care facility when they fell.
The cost of other health care services were estimated using ratios developed from the literature of the cost of each service relative to the cost of inpatient care. The ratios for hospital outpatient services, pharmaceuticals, general practitioner, specialist and allied health consultations were derived from falls-specific costs using Australian health
expenditures for 1993–94.22 The ratios for community
nursing and domiciliary services were calculated from
Hall and Hendrie.23
Results Incidence
In 2006–07, the NSW population aged 65 years and over was estimated to be just over 931 000 people. It was estimated that around 251 000 (27%) older people fell at least once and suffered, in total, an estimated 507 000 falls. Almost 28% (143 000) of these falls resulted in an injury requiring some form of medical treatment and, of these, 18% were serious enough to warrant admission to hospital (Table 1).
While women accounted for 55% of the population, they accounted for 58% of all falls. Overall, women were
Table 1. Estimated resident population, number of people who fell and number of medically treated fall injuries by gender, persons aged 65 years and over, NSW, 2006]07
Men Women Persons
n % n % n %
Estimated resident population 417 027 44.8 514 305 55.2 931 332 100.0
Number of people who fell 105 088 41.8 146 365 58.2 251 453 100.0
Total number of falls 218 156 43.0 289 051 57.0 507 207 100.0
All medically treated fall injuries 51 558 36.0 91 415 64.0 142 973 100.0
slightly more likely to fall than men (28.5% of older women fell compared to 25% of older men).
Women accounted for 64% of all medically treated fall-related injuries (Table 2). They were also more likely than men to suffer an injury requiring medical treatment as a result of a fall (62.5% of women who fell compared to 49% of men who fell) and to be hospitalised following a fall (12% of women who fell compared to 7% of men who fell).
Direct health care costs
The total direct cost of health care associated with fall-related injuries in older adults was estimated at $558.5 million (Table 3). Although only 18% of medically treated injuries resulted in hospital admission, the cost of care associated with these cases accounted for 84.5% of the total cost. Treatment costs associated with emergency department presentations accounted for 9% of the total cost and other non-hospital attendances, which accounted for the 69% of all medically treated falls, accounted for an estimated 6.5% of treatment costs.
While women accounted for 64% of all medically treated fall-related injuries (Table 2), they accounted for 69% of total treatment costs (Table 3). Total health care costs for women were 2.2 times higher than for men.
Table 4 presents the total treatment and care costs of fall-related injuries among older people in NSW by cost component and level of treatment. The majority of total
costs (57.9%) were associated with hospital treatment and care (inpatient, emergency department and outpatient) followed by residential aged care (22.9%) and non-hospital medical (general practitioner and specialist) treatment (6.1%).
The total cost of treatment and care associated with falls among community-dwelling older people in the current study (excluding the cost of any subsequent residential aged care) was compared against that derived by scaling up the costs obtained in a prospective NSW study by Tiedemann
et al.24The total estimate derived from this small study was
only 5.7% higher than that of the current study.
Discussion
This study highlights the significant cost of fall-related injuries among older people in NSW. Although these costs are not all borne by NSW Health, the estimated lifetime cost of treating fall-related injuries among older people in NSW in 2006–07 was equivalent to almost 5% of the NSW
health budget in that year.25In order to reduce the impact
on the health system of fall-related injuries among older people, significant resources need to be directed towards the promotion of evidence-based fall-related injury pre-vention programs at the local level across the state.
At $558.5 million, the current estimate of treatment costs for 2006–07 is 2.5 times the previous estimate for 1998–99
of $224.7 million.14This is due in part to inflation in health
care costs (total health price index) which increased by
Table 2. Estimated number of falls requiring medical treatment by gender and level of treatment, persons aged 65 years and over, NSW, 2006]07
Level of treatment Men Women Persons
n % n % n %
Hospital admissions 7798 15.1 17 763 19.4 25 561 17.9
Emergency department attendances 5732 11.1 12 734 13.9 18 466 12.9
Non-hospital treatments 38 028 73.8 60 918 66.7 98 946 69.2
All medically treated fall injuries 51 558 100.0 91 415 100.0 142 973 100.0
Table 3. Estimated health care costs for all medically treated fall-related injuries by gender and level of treatment, persons aged 65 years and over, NSW, 2006]07
Level of treatment Men Women Persons
($ millions) % of total ($ millions) % of total ($ millions) % of total
Hospital admissions 141.17 81.4 330.43 85.8 471.60 84.4
Emergency department attendances 21.76 12.5 28.38 7.4 50.16 9.0
Non-hospital treatments 10.59 6.1 26.12 6.8 36.71 6.6
Total NSW 173.52 100.0 384.93 100.0 558.46 100.0
Average cost ($) 3336 4211 3906
NB: All values correct to two decimal places but rounding may result in components not adding up exactly to totals.
Cost of fall-related injuries among older people
28% over that period,26the impact of the ageing population (the number of people aged 65 years and over in NSW
increased by 14.5%19) and an increase in the
age-standardised rate of falls hospitalisations by a similar
magnitude over the same period.27The earlier study also
did not include all episodes of hospital care (only the index admission), the cost of residential aged care, outpatient costs, community nursing, domiciliary services or the costs associated with people who did not attend the hospital system for treatment.
The main limitation of this study lies in the lack of health service utilisation data in which falls and other conditions can be comprehensively identified. Where data was unavailable, particularly for more minor injuries, research-ers had to rely on data from various sources or the literature, some of which is quite dated. Where there were inadequacies in existing data, assumptions had to be made.
The limitations of this study highlight the inadequacies in current NSW population health data and several recom-mendations are made to address these shortcomings. These include: the introduction of a unique patient identifier and the date of injury in the hospital discharge dataset to facilitate the identification of incident cases of fall-related hospitalisations in the NSW Admitted Patients Dataset; and the standardisation of the NSW emergency department data collections across all hospitals in terms of the coding of injury causes and diagnoses to facilitate the quantifica-tion of the number of falls resulting in emergency department attendance and their associated costs.
The study also highlighted the limitations in our under-standing of the patient journey, beyond the hospital,
following a fall. While there has been some research into the costs associated with falls in small samples of the
population,23,24 there is an urgent need for research at
the population level to establish the utilisation of services beyond the hospital door.
Despite these limitations, the study represents the most comprehensive estimate of the cost of falls in NSW to date as it includes the majority of cost components associated with medical treatment and care following a fall-related injury. The estimates derived in this study were also validated against those derived by scaling up from a small, community-based study.
Conclusion
This study demonstrates the high economic cost of falls in older people and underscores the need for a strategically focused falls prevention strategy for NSW and for the support of cost-effective falls prevention in this popula-tion. It also highlights the need for improvements in population health data in NSW to facilitate the estimation of incidence and costs for the different levels of care provided.
The full report,The Incidence and Cost of Falls Injury
Among Older People in New South Wales 2006/07, is available at: http://www.health.nsw.gov.au/pubs/2010/ costoffall.html
Acknowledgments
W Watson and A Clapperton were supported by the NSW Depart-ment of Health. R Mitchell was partially supported by the NSW
Table 4. Estimated health care costs for all medically treated fall-related injuries by level of treatment and cost component, persons aged 65 years and over, NSW, 2006]07
Cost component Total cost
Admissions ($ millions)
Emergency department attendances
($ millions)
Non-hospital treatments ($ millions)
Total
Hospital inpatienta 262.68 – – 262.68
Emergency department and outpatientb 35.16 25.73 – 60.89
Total hospital sector 297.84 25.73 – 323.57
Residential aged care 127.90 – – 127.90
Medical treatments 10.96 7.14 16.06 34.16
Pharmaceuticals 2.92 2.01 4.26 9.19
Allied health 6.16 4.04 8.86 19.06
Ambulance 14.56 7.50 – 22.04
Community nursing 4.56 1.51 3.05 9.12
Domiciliary services 6.71 2.23 4.49 13.42
Total 471.60 50.16 36.71 558.46
aIncludes emergency department costs associated with admitted patients. bOutpatient costs only for admitted patients.
Department of Health and by an Australian Research Council-linkage post-doctoral fellowship (LP0990057).
The authors wish to thank the Centre for Epidemiology and Research at the NSW Department of Health for providing access to the Health Outcomes and Information Statistical Toolkit (HOIST) to obtain the hospital data analysed in this study. The HOIST system refers to a data access, analysis and reporting facility established and operated by the Centre for Epidemiology and Research, NSW Department of Health.
The authors would also like to acknowledge the contribution of: the Monash University Accident Research Centre for providing aggregated hospital and Emergency Department data; the NSW Population Health Survey team for the provision of preliminary data from the 2009 Falls Prevention Survey; and the Ambulance Service of NSW for the provision of average unit cost data.
References
1. Campbell AJ, Borrie MJ, Spears GF. Risk factors for falls in a community-based prospective study of people 70 years and older.J Gerontol1989; 44(4): M112–7.
2. Morris M, Osborne D, Hill K, Kendig H, Lundgren-Linquist B, Browning C. Predisposing factors for occasional and multiple falls in older Australians who live at home.Aust J Physiother
2004; 50(3): 153–9.
3. Nevitt MC, Cummings SR, Kidd S, Black D. Risk factors for recurent nonsyncopal falls: a prospective study.JAMA1989; 261(18): 2663–8. doi:10.1001/jama.261.18.2663
4. Tinetti ME, Speechley M, Ginter SF. Risk factors for falls among elderly persons living in the community.N Engl J Med1988; 319(26): 1701–7. doi:10.1056/NEJM198812293192604
5. Sattin RW. Falls among older persons: a public health perspective.Annu Rev Public Health1992; 13: 489–508. doi:10.1146/annurev.pu.13.050192.002421
6. Tinetti ME, Powell L. Fear of falling and low self-efficacy: a cause of dependence in elderly persons.J Gerontol1993; 48(Spec No): 35–8.
7. King MB, Tinetti ME. Falls in community-dwelling older persons.J Am Geriatr Soc1995; 43(10): 1146–54.
8. Downton J, Andrews K. Postural disturbance and psychological symptoms amongst elderly people living at home.Int J Geriatr Psychiatry1990; 5(2): 93–8. doi:10.1002/gps.930050206
9. Chung MC, McKee KJ, Austin C, Barkby H, Brown H, Cash S et al. Posttraumatic stress disorder in older people after a fall.
Int J Geriatr Psychiatry2009; 24(9): 955–64. doi:10.1002/ gps.2201
10. Tinetti ME, Williams C. Falls, injuries due to falls, and the risk of admission to a nursing home.N Engl J Med1997; 337(18): 1279–84. doi:10.1056/NEJM199710303371806
11. Moller J. Projected costs of fall related injury to older persons due to demographic change in Australia. Canberra: Commonwealth Department of Health and Ageing; 2003.
12. Roudsari BS, Ebel BE, Corso PS, Molinari NA, Koepsell TD. The acute medical care costs of fall-related injuries among the
U.S. older adults.Injury2005; 36(11): 1316–22. doi:10.1016/ j.injury.2005.05.024
13. Stevens JA, Corso PS, Finkelstein EA, Miller TR. The costs of fatal and non-fatal falls among older adults.Inj Prev2006; 12(5): 290–5. doi:10.1136/ip.2005.011015
14. Potter-Forbes M, Aisbett C. Injury Costs: A Valuation of the Burden of Injury in New South Wales 1998–1999. Sydney: NSW Injury Risk Management Research Centre; 2003.
15. Carroll NV, Slattum PW, Cox FM. The cost of falls among the community-dwelling elderly.J Manag Care Pharm2005; 11(4): 307–16.
16. Scuffham P, Chaplin S, Legood R. Incidence and costs of unintentional falls in older people in the United Kingdom.
J Epidemiol Community Health2003; 57(9): 740–4. doi:10.1136/jech.57.9.740
17. Stevens JA, Corso PS, Finkelstein EA, Miller TR. The costs of fatal and non-fatal falls among older adults. Inj Prev 2006; 12(5): 290–5. doi:10.1136/ip.2005.011015
18. Watson W, Clapperton A, Mitchell R. The Incidence and Cost of Falls Injury Among Older People in New South Wales 2006/07. North Sydney: NSW Department of Health; 2010. Available from: http://www.health.nsw.gov.au/pubs/2010/ costoffall.html
19. Australian Bureau of Statistics. 3201.0 Population by Age and Sex, Australian States and Territories, Jun 2008. Australian Bureau of Statistics; 2008.
20. NSW Department of Health. NSW Costs of Care Standards 2006/07. North Sydney: NSW Department of Health; 2007.
21. Australian Institute of Health and Welfare. Residential aged care in Australia 2006–07: A statistical overview. Aged care statistics series 26. Canberra: AIHW; 2008.
22. Mathers C, Penm R. Health system costs of injury, poisoning and musculoskeletal disorders in Australia, 1993–94. AIHW cat. no. HWE 12. Canberra: Australian Institute of Health and Welfare; 1999.
23. Hall SE, Hendrie DV. A prospective study of the costs of falls in older people living in the community.Aust N Z J Public Health2003; 27(3): 343–51. doi:10.1111/j.1467-842X.2003. tb00405.x
24. Tiedemann AC, Murray SM, Munro B, Lord SR. Hospital and non-hospital costs for fall-related injury in community-dwelling older people.N S W Public Health Bull2008; 19(9–10): 161–5. doi:10.1071/NB07022
25. NSW Department of Health. Annual Report 2006/07. North Sydney: NSW Department of Health; 2007.
26. Australian Institute of Health and Welfare. Health expenditure Australia 2006–07. Canberra: AIHW; 2008.
27. Population Health Division. The Health of the People of New South Wales – Report of the Chief Health Officer, Data Book – Injury & Poisoning. North Sydney: NSW Department of Health; 2008.
Cost of fall-related injuries among older people
An economic evaluation of community
and residential aged care falls prevention
strategies in NSW
Jody Church
A,B, Stephen Goodall
A,
Richard Norman
Aand Marion Haas
A ACentre for Health Economics Research and Evaluation, University of Technology, Sydney
B
Corresponding author. Email: [email protected]
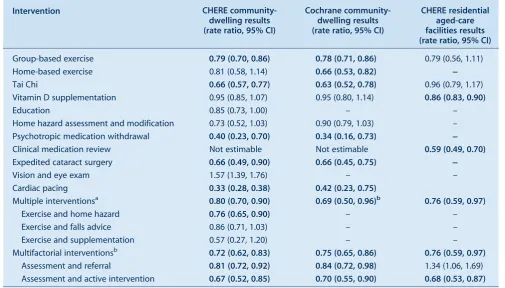
Abstract: Aim:To evaluate the cost-effectiveness of strategies designed to prevent falls amongst people aged 65 years and over living in the community and in residential aged-care facilities. Methods:A systematic review and meta-analysis of the literature was conducted. The pooled fall rate ratio was used in a decision analytic model that combined a Markov model and decision tree to estimate the costs and outcomes of potential interventions and/or strategies. The resulting cost per quality-adjusted life year was estimated. Results:The most cost-effective falls prevention strategy in community-dwelling older people was Tai Chi. Expedited cataract surgery and psycho-tropic medication withdrawal were also found to be cost-effective; however, the effectiveness of these interventions is less certain due to small numbers of trials and participants. The most cost-effective falls prevention strategies in residential aged-care facilities were medication review and vitamin D supplementation.
A fall is defined as ‘an unexpected event in which an
individual comes to rest on the ground, floor or lower level’.1
Falls are common among older people; up to one in four people aged 65 years and over fall at least once in a year, with many falling more than once. Falls are even more common among residents of aged-care facilities, with up to
half of all residents falling at least once in a year.2,3
Fall-related injury is a major cause of morbidity and mortality for older people. In New South Wales (NSW) each
![Table 1.Estimated resident population, number of people who fell and number of medically treated fall injuries by gender,persons aged 65 years and over, NSW, 2006]07](https://thumb-us.123doks.com/thumbv2/123dok_us/59586.2007621/16.595.51.539.670.769/estimated-resident-population-medically-treated-injuries-gender-persons.webp)
![Table 3.Estimated health care costs for all medically treated fall-related injuries by gender and level of treatment, personsaged 65 years and over, NSW, 2006]07](https://thumb-us.123doks.com/thumbv2/123dok_us/59586.2007621/17.595.59.558.664.780/estimated-medically-treated-related-injuries-gender-treatment-personsaged.webp)
![Table 4.Estimated health care costs for all medically treated fall-related injuries by level of treatment and cost component,persons aged 65 years and over, NSW, 2006]07](https://thumb-us.123doks.com/thumbv2/123dok_us/59586.2007621/18.595.46.542.110.319/estimated-medically-treated-related-injuries-treatment-component-persons.webp)