Year in review: communicable disease
surveillance, NSW, 2009
Communicable Diseases Branch,
NSW Department of Health
In this issue we present a review of notifiable diseases reported in New South Wales (NSW) residents in 2009. Conditions have been grouped into four categories (blood-borne viruses and sexually transmissible infections; enteric diseases; respiratory diseases; and vaccine-preventable dis-eases), with significant trends highlighted. Outbreaks of some diseases, notably chlamydia, cryptosporidiosis, H1N1 influ-enza and pertussis are discussed. For greater detail, refer to Tables 1–5, which show disease-specific data for notifica-tions reported by: year of onset of illness; month of onset of illness; area health service; and age group and sex.
Notifiable conditions
Bloodborne viruses and sexually transmissible infections
Highlights in 2009 included:
• Human immunodeficiency virus (HIV) infection:328 cases were notified, reflecting a stable rate of infections in NSW. HIV infection continues to largely affect men who have sex with men, although in 2009 there was a small increase in the number of notifications of heterosexual people. Notifications associated with injecting drug use remained low, accounting for 3% of cases.
• Hepatitis C:3951 cases were notified, similar to previous years. As hepatitis C infections are largely asymptomatic and cause chronic infections, caution should be used in interpreting these data as they may be influenced by changes in testing rather than in the incidence of the disease. • Chlamydia: 14 998 cases were notified in 2009, the highest on record. Cases were most common in young adults, with more females than males notified in this age group likely reflecting higher screening rates in women. • Infectious syphilis:508 cases were notified, reflecting an ongoing outbreak, largely among men who have sex with men and who reside in inner Sydney.
• Gonorrhoea: 1653 notifications, mainly in men, were reported in 2009. Although this largely affected men who have sex with men, towards the end of 2009 there was a modest increase in the number of notifications in women.
Comment
The number of notifications of sexually transmissible infec-tions continues to increase in NSW. Although this may in part be due to increased awareness and testing for these conditions, it demonstrates the continuing importance of prevention programs. The increases in sexually transmissi-ble infections may threaten the current stability of the HIV epidemic in NSW.1
Note that because of the chronic nature of hepatitis B and hepatitis C infection, repeat testing and repeat case notifica-tions are common for these condinotifica-tions. Recent improve-ments in methods for cleaning data have resulted in the identification of duplicate notifications of hepatitis B and hepatitis C cases. This has led to the reduction in the number of case notifications for previous years, particularly before 2005.
Enteric diseases
There were 6575 notifications of enteric disease in 2009, an increase of 39% compared with the average of the previous 5 years. This was largely due to an increase in notifications of cryptosporidiosis and shigellosis.
• There was a 147% increase of notifications of crypto-sporidiosis (1484 notifications), compared to the annual average of 600 for the period 2004–2008. This was attributed to a large outbreak at the beginning of the year, associated with contaminated swimming pools.2
• There was a 63% increase in notifications of shigellosis (155 notifications) compared to the previous 5-year average of 95 notifications. Of these, 55% were seen in south-east Sydney. The majority (98%) of notifications in
Vol. 21(7–8) July–August 2010
ISSN 1034 7674
NSW PUBLIC HEALTH
BULLETIN
Year in review
CONTENTS – See back page w w w . p u b l i s h . c s i r o . a u / j o u r n a l s / p h b
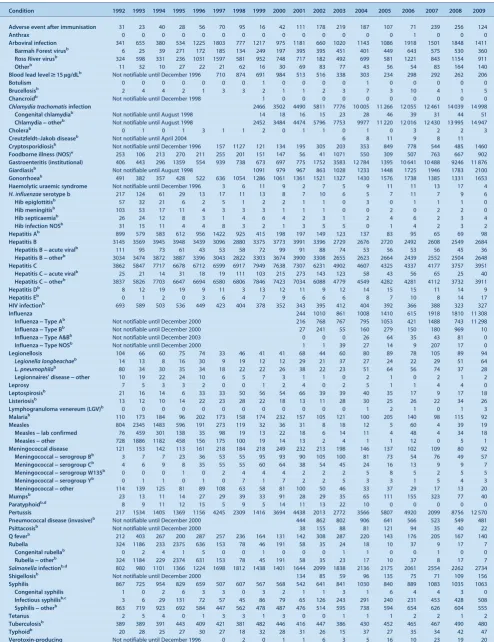
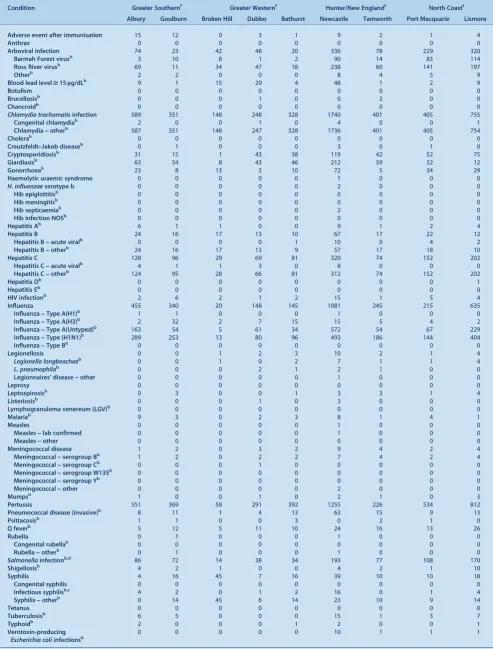
Table 1. Disease notifications by year of onset of illnessa, NSW, 1992–2009
Condition 1992 1993 1994 1995 1996 1997 1998 1999 2000 2001 2002 2003 2004 2005 2006 2007 2008 2009
Adverse event after immunisation 31 23 40 28 56 70 95 16 42 111 178 219 187 107 71 239 256 124
Anthrax 0 0 0 0 0 0 0 0 0 0 0 0 0 0 1 0 0 0
Arboviral infection 341 655 380 534 1225 1803 777 1217 975 1181 660 1020 1143 1086 1918 1501 1848 1411 Barmah Forest virusb
6 25 39 271 172 185 134 249 197 395 395 451 401 449 643 575 530 360 Ross River virusb
324 598 331 236 1031 1597 581 952 748 717 182 492 699 581 1221 843 1154 911 Otherb
11 32 10 27 22 21 62 16 30 69 83 77 43 56 54 83 164 140
Blood lead level$15lg/dLb
Not notifiable until December 1996 710 874 691 984 513 516 338 303 234 298 292 262 206
Botulism 0 0 0 0 0 0 0 1 0 0 0 0 1 0 0 0 0 0
Brucellosisb
2 4 4 2 1 3 3 2 1 1 2 3 7 3 10 4 1 5
Chancroidb
Not notifiable until December 1998 1 0 0 0 0 0 0 0 0 0 0
Chlamydia trachomatisinfection 2466 3502 4490 5811 7776 10 005 11 266 12 055 12 461 14 039 14 998 Congenital chlamydiab
Not notifiable until August 1998 14 18 16 15 23 28 46 39 31 44 51 Chlamydia]otherb
Not notifiable until August 1998 2452 3484 4474 5796 7753 9977 11 220 12 016 12 430 13 995 14 947 Cholerab
0 1 0 1 3 1 1 2 0 1 1 0 1 0 3 2 2 3
Creutzfeldt]Jakob diseaseb
Not notifiable until April 2004 6 8 11 9 8 11
Cryptosporidiosisb Not notifiable until December 1996 157 1127 121 134 195 305 203 353 849 778 544 485 1460
Foodborne illness (NOS)e 253 106 213 270 211 255 201 151 147 56 41 1071 550 309 507 763 667 902
Gastroenteritis (institutional) 406 443 296 1359 554 939 738 673 697 775 1752 3583 12 784 1395 10 641 10 488 9246 11 876 Giardiasisb Not notifiable until August 1998 1091 979 967 863 1028 1233 1448 1725 1946 1783 2100
Gonorrhoeab
491 382 357 428 522 636 1054 1286 1061 1361 1521 1327 1430 1576 1738 1385 1331 1653 Haemolytic uraemic syndrome Not notifiable until December 1996 3 6 11 9 2 7 5 9 11 11 13 17 4
H. influenzaeserotype b 217 124 61 29 13 17 11 13 8 7 10 6 5 7 11 7 9 6
Hib epiglottitisb
57 32 21 6 2 5 1 2 2 1 1 0 3 0 1 1 1 0
Hib meningitisb
103 53 17 11 4 3 3 3 1 1 1 0 0 2 0 2 2 0
Hib septicaemiab
26 24 12 8 3 1 4 6 4 2 3 1 2 4 6 2 3 4
Hib infection NOSb
31 15 11 4 4 8 3 2 1 3 5 5 0 1 4 2 3 2
Hepatitis Ab
899 579 583 612 956 1422 925 415 198 197 149 123 137 83 95 65 69 98 Hepatitis B 3145 3569 3945 3948 3439 3096 2880 3375 3773 3991 3396 2729 2676 2720 2492 2608 2549 2684
Hepatitis B]acute viralb
111 95 73 61 43 53 58 72 99 91 88 74 53 56 53 56 45 36
Hepatitis B]otherb
3034 3474 3872 3887 3396 3043 2822 3303 3674 3900 3308 2655 2623 2664 2439 2552 2504 2648 Hepatitis C 3862 5847 7717 6678 6712 6599 6917 7949 7638 7307 6231 4902 4607 4325 4337 4177 3757 3951
Hepatitis C]acute viralb
25 21 14 31 18 19 111 103 215 273 143 123 58 43 56 65 25 40 Hepatitis C]otherb
3837 5826 7703 6647 6694 6580 6806 7846 7423 7034 6088 4779 4549 4282 4281 4112 3732 3911 Hepatitis Db
8 12 19 19 9 11 3 13 12 11 9 12 14 15 15 11 14 9
Hepatitis Eb
0 1 2 0 3 6 4 7 9 6 6 6 8 7 10 8 14 17
HIV infectionb
693 589 503 536 449 423 404 378 352 343 395 412 404 392 366 388 323 327
Influenza 244 1010 861 1008 1410 615 1918 1810 11 308
Influenza]Type Ab
Not notifiable until December 2000 216 768 767 795 1053 421 1488 743 11 298 Influenza]Type Bb Not notifiable until December 2000 27 241 55 160 279 150 180 969 10
Influenza]Type A&Bb Not notifiable until December 2003 0 0 0 26 64 35 43 81 0
Influenza]Type NOSb
Not notifiable until December 2000 1 1 39 27 14 9 207 17 0
Legionellosis 104 66 60 75 74 33 46 41 41 68 44 60 80 89 78 105 89 94
Legionella longbeachaeb
14 13 8 16 30 9 19 12 12 29 21 37 27 24 22 29 51 64
L. pneumophilab
80 34 30 35 34 18 22 22 26 38 22 23 51 64 56 74 37 28
Legionnaires’ disease]other 10 19 22 24 10 6 5 7 3 1 1 0 2 1 0 2 1 2
Leprosy 7 5 3 3 2 0 0 1 2 4 0 2 5 1 1 4 4 0
Leptospirosisb
21 16 14 6 33 33 50 56 54 66 39 39 40 35 17 9 17 18
Listeriosisb
13 12 10 14 22 23 28 22 18 13 11 28 30 25 26 22 34 26
Lymphogranuloma venereum (LGV)b
0 0 0 0 0 0 0 0 0 0 0 0 1 2 1 0 1 3
Malariab
110 173 184 96 202 173 158 174 232 157 105 121 100 205 140 98 115 92
Measles 804 2345 1483 596 191 273 119 32 36 31 8 18 12 5 60 4 39 19
Measles]lab confirmed 76 459 301 138 35 98 19 13 22 18 6 14 11 4 48 4 34 18
Measles]other 728 1886 1182 458 156 175 100 19 14 13 2 4 1 1 12 0 5 1
Meningococcal disease 121 153 142 113 161 218 184 218 249 232 213 198 146 137 102 109 80 92 Meningococcal]serogroup Bb
3 7 7 23 36 53 55 95 93 90 105 100 81 73 54 76 49 57
Meningococcal]serogroup Cb
4 6 9 8 35 55 55 60 64 38 54 45 24 16 13 9 9 7
Meningococcal]serogroup W135b
0 0 0 1 0 2 4 4 4 2 2 2 5 8 5 2 5 5
Meningococcal]serogroup Yb
0 1 1 0 1 0 7 1 7 2 2 5 3 3 1 5 4 3
Meningococcal]other 114 139 125 81 89 108 63 58 81 100 50 46 33 37 29 17 13 20
Mumpsb 23 13 11 14 27 29 39 33 91 28 29 35 65 111 155 323 77 40
Paratyphoidb,d 8 9 11 12 15 5 9 5 14 11 13 22 10 0 0 0 0 0
Pertussis 217 1534 1405 1369 1156 4245 2309 1416 3694 4438 2013 2772 3566 5807 4920 2099 8756 12 570 Pneumococcal disease (invasive)b
Not notifiable until December 2000 444 862 802 906 641 566 523 549 481 Psittacosisb
Not notifiable until December 2000 38 155 88 81 121 94 35 40 22 Q feverb
212 403 267 200 287 257 236 164 131 142 308 287 220 143 176 205 167 140
Rubella 324 1186 233 2375 636 153 78 46 191 58 35 24 18 10 37 9 17 7
Congenital rubellab
0 2 4 1 5 0 0 1 0 0 0 1 1 0 0 1 0 0
Rubella]otherb
324 1184 229 2374 631 153 78 45 191 58 35 23 17 10 37 8 17 7 Salmonellainfectionb,d
802 980 1101 1366 1224 1698 1812 1438 1401 1644 2099 1838 2136 2175 2061 2554 2262 2734 Shigellosisb
Not notifiable until December 2000 134 85 59 96 135 75 71 109 156 Syphilis 867 725 954 829 659 507 607 567 568 542 641 841 1030 840 889 1083 1035 1063
Congenital syphilis 1 0 2 6 3 3 0 3 2 1 1 3 1 6 4 4 3 0
Infectious syphilisb,c
3 6 29 131 72 57 45 86 79 65 126 243 291 240 231 453 428 508 Syphilis]otherb
863 719 923 692 584 447 562 478 487 476 514 595 738 594 654 626 604 555
Tetanus 2 5 4 0 1 3 3 1 3 0 0 1 1 1 2 2 1 2
Tuberculosisb
389 389 391 443 409 421 381 482 446 416 447 386 430 452 465 467 490 480 Typhoidb
20 28 25 27 30 27 18 32 28 31 26 15 37 27 35 34 42 47
Verotoxin-producing Escherichia coliinfectionsb
Not notifiable until December 1996 0 2 0 1 1 6 3 5 16 10 23 19 20
aOnset: the earlier of patient reported onset date, specimen date or date of notification.bLaboratory-confirmed cases only.cIncludes syphilis primary, syphilis secondary, syphiliso1 y duration and syphilis newly acquired.d
From 2005, all paratyphoid recorded as salmonellosis.e
Foodborne illness cases are only those notified as part of an outbreak. NOS: not otherwise specified. No case of the following diseases have been notified since 1991: plagueb
, diphtheriab
, granuloma inguinaleb , lyssavirusb
, poliomyelitisb
, rabies, smallpox, typhusb
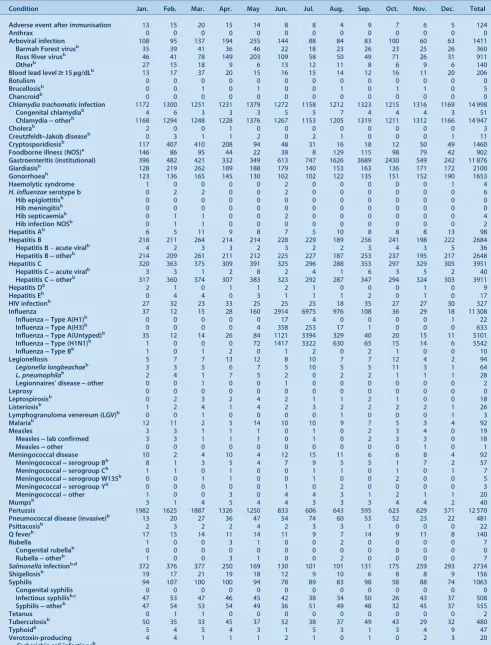
Table 2. Disease notifications by month of onset of illnessa, NSW, 2009
Condition Jan. Feb. Mar. Apr. May Jun. Jul. Aug. Sep. Oct. Nov. Dec. Total
Adverse event after immunisation 13 15 20 15 14 8 8 4 9 7 6 5 124
Anthrax 0 0 0 0 0 0 0 0 0 0 0 0 0
Arboviral infection 108 95 137 194 255 144 88 84 83 100 60 63 1411
Barmah Forest virusb
35 39 41 36 46 22 18 23 26 23 25 26 360
Ross River virusb
46 41 78 149 203 109 58 50 49 71 26 31 911
Otherb
27 15 18 9 6 13 12 11 8 6 9 6 140
Blood lead level$15lg/dLb
13 17 37 20 15 16 15 14 12 16 11 20 206
Botulism 0 0 0 0 0 0 0 0 0 0 0 0 0
Brucellosisb
0 0 1 0 1 0 0 1 0 1 1 0 5
Chancroidb
0 0 0 0 0 0 0 0 0 0 0 0 0
Chlamydia trachomatisinfection 1172 1300 1251 1231 1379 1272 1158 1212 1323 1215 1316 1169 14 998
Congenital chlamydiab
4 6 3 3 3 5 5 7 4 4 4 3 51
Chlamydia]otherb
1168 1294 1248 1228 1376 1267 1153 1205 1319 1211 1312 1166 14 947
Cholerab
2 0 0 1 0 0 0 0 0 0 0 0 3
Creutzfeldt]Jakob diseaseb
0 3 1 1 2 0 2 1 0 0 0 1 11
Cryptosporidiosisb
117 407 410 208 94 48 31 16 18 12 50 49 1460
Foodborne illness (NOS)e
146 86 95 44 22 38 8 129 115 98 79 42 902
Gastroenteritis (institutional) 396 482 421 332 349 613 747 1626 3689 2430 549 242 11 876
Giardiasisb
128 219 262 189 188 179 140 153 163 136 171 172 2100
Gonorrhoeab 123 136 165 145 130 102 102 122 135 151 152 190 1653
Haemolytic syndrome 1 0 0 0 0 2 0 0 0 0 0 1 4
H. influenzaeserotype b 0 2 2 0 0 2 0 0 0 0 0 0 6
Hib epiglottitisb 0 0 0 0 0 0 0 0 0 0 0 0 0
Hib meningitisb
0 0 0 0 0 0 0 0 0 0 0 0 0
Hib septicaemiab
0 1 1 0 0 2 0 0 0 0 0 0 4
Hib infection NOSb
0 1 1 0 0 0 0 0 0 0 0 0 2
Hepatitis Ab
6 5 11 9 8 7 5 10 8 8 8 13 98
Hepatitis B 218 211 264 214 214 228 229 189 256 241 198 222 2684
Hepatitis B–acute viralb
4 2 3 3 2 3 2 2 3 4 3 5 36
Hepatitis B]otherb
214 209 261 211 212 225 227 187 253 237 195 217 2648
Hepatitis C 320 363 375 309 391 325 296 288 353 297 329 305 3951
Hepatitis C]acute viralb
3 3 1 2 8 2 4 1 6 3 5 2 40
Hepatitis C]otherb
317 360 374 307 383 323 292 287 347 294 324 303 3911
Hepatitis Db
2 1 0 1 1 2 1 0 0 0 1 0 9
Hepatitis Eb
0 4 4 0 3 1 1 1 2 0 1 0 17
HIV infectionb
27 32 23 33 25 25 25 18 35 27 27 30 327
Influenza 37 12 15 28 160 2914 6975 976 108 36 29 18 11 308
Influenza]Type A(H1)b
0 0 0 0 0 17 4 0 0 0 0 1 22
Influenza]Type A(H3)b
0 0 0 0 4 358 253 17 1 0 0 0 633
Influenza]Type A(Untyped)b
35 12 14 26 84 1121 3394 329 40 20 15 11 5101
Influenza]Type (H1N1)b
1 0 0 0 72 1417 3322 630 65 15 14 6 5542
Influenza]Type Bb 1 0 1 2 0 1 2 0 2 1 0 0 10
Legionellosis 5 7 7 13 12 8 10 7 7 12 4 2 94
Legionella longbeachaeb 3 3 5 6 7 5 10 5 5 11 3 1 64
L. pneumophilab 2 4 1 7 5 2 0 2 2 1 1 1 28
Legionnaires’ disease]other 0 0 1 0 0 1 0 0 0 0 0 0 2
Leprosy 0 0 0 0 0 0 0 0 0 0 0 0 0
Leptospirosisb
0 2 3 2 4 2 1 1 2 1 0 0 18
Listeriosisb
1 2 4 1 4 2 3 2 2 2 2 1 26
Lymphogranuloma venereum (LGV)b
0 0 1 0 0 0 0 1 0 0 0 1 3
Malariab
12 11 2 5 14 10 10 9 7 5 3 4 92
Measles 3 3 1 1 1 0 1 0 2 3 4 0 19
Measles]lab confirmed 3 3 1 1 1 0 1 0 2 3 3 0 18
Measles]other 0 0 0 0 0 0 0 0 0 0 1 0 1
Meningococcal disease 10 2 4 10 4 12 15 11 6 6 8 4 92
Meningococcal]serogroup Bb
8 1 3 5 4 7 9 5 5 1 7 2 57
Meningococcal]serogroup Cb
1 1 0 1 0 0 1 1 0 1 0 1 7
Meningococcal]serogroup W135b
0 0 1 1 0 0 1 0 0 2 0 0 5
Meningococcal]serogroup Yb
0 0 0 0 0 1 0 2 0 0 0 0 3
Meningococcal]other 1 0 0 3 0 4 4 3 1 2 1 1 20
Mumpsb
3 1 4 5 4 4 3 3 3 4 4 2 40
Pertussis 1982 1625 1887 1326 1250 833 606 643 595 623 629 571 12 570
Pneumococcal disease (invasive)b
13 20 27 36 47 54 74 60 53 52 23 22 481
Psittacosisb
2 3 2 2 4 2 3 3 1 0 0 0 22
Q feverb 17 15 14 11 14 11 9 7 14 9 11 8 140
Rubella 1 0 0 3 1 0 0 2 0 0 0 0 7
Congenital rubellab 0 0 0 0 0 0 0 0 0 0 0 0 0
Rubella]otherb
1 0 0 3 1 0 0 2 0 0 0 0 7
Salmonellainfectionb,d
372 376 377 250 169 130 101 101 131 175 259 293 2734
Shigellosisb
19 17 21 19 18 12 9 10 6 8 8 9 156
Syphilis 94 107 100 100 94 78 89 83 98 58 88 74 1063
Congenital syphilis 0 0 0 0 0 0 0 0 0 0 0 0 0
Infectious syphilisb,c
47 53 47 46 45 42 38 34 50 26 43 37 508
Syphilis]otherb
47 54 53 54 49 36 51 49 48 32 45 37 555
Tetanus 0 1 1 0 0 0 0 0 0 0 0 0 2
Tuberculosisb
50 35 33 45 37 52 38 37 49 43 29 32 480
Typhoidb
5 4 5 4 3 1 5 3 1 3 4 9 47
Verotoxin-producing
Escherichia coliinfectionsb 4 4 1 1 1 2 1 0 1 0 2 3 20
a
Onset: the earlier of patient reported onset date, specimen date or date of notification.b
Laboratory-confirmed cases only.c
Includes syphilis primary, syphilis secondary, syphiliso1 y duration and syphilis newly acquired.d
Includes all paratyphoid cases.e
Foodborne illness cases are only those notified as part of an outbreak. NOS: not otherwise specified. No case of the following diseases have been notified since 1991: plagueb
, diphtheriab
, granuloma inguinaleb , lyssavirusb
, poliomyelitisb
, rabies, smallpox, typhusb
, viral haemorrhagic fever, yellow fever. 2009 influenza data: cases reported to public health units; contain 50 laboratory notifications from either interstate residents or overseas.
Year in review
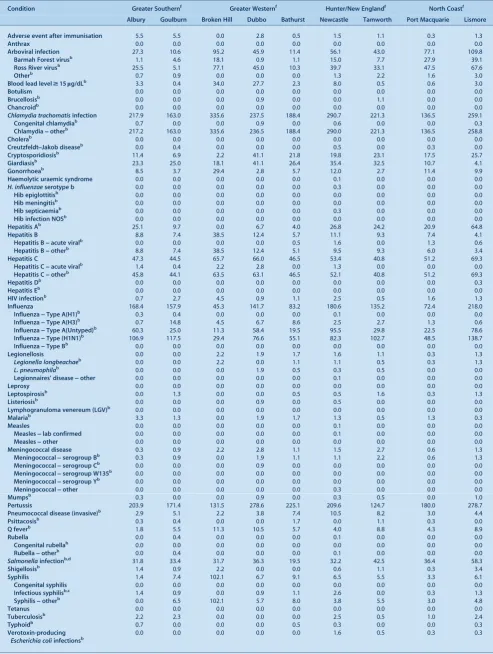
Table 3. Disease notifications by area health service of residence, crude rates per 100 000 population, NSW, 2009 (based on onset of illnessa)
Condition Greater Southernf Greater Westernf Hunter/New Englandf North Coastf
Albury Goulburn Broken Hill Dubbo Bathurst Newcastle Tamworth Port Macquarie Lismore
Adverse event after immunisation 5.5 5.5 0.0 2.8 0.5 1.5 1.1 0.3 1.3
Anthrax 0.0 0.0 0.0 0.0 0.0 0.0 0.0 0.0 0.0
Arboviral infection 27.3 10.6 95.2 45.9 11.4 56.1 43.0 77.1 109.8
Barmah Forest virusb 1.1 4.6 18.1 0.9 1.1 15.0 7.7 27.9 39.1
Ross River virusb 25.5 5.1 77.1 45.0 10.3 39.7 33.1 47.5 67.6
Otherb 0.7 0.9 0.0 0.0 0.0 1.3 2.2 1.6 3.0
Blood lead level$15lg/dLb 3.3 0.4 34.0 27.7 2.3 8.0 0.5 0.6 3.0
Botulism 0.0 0.0 0.0 0.0 0.0 0.0 0.0 0.0 0.0
Brucellosisb 0.0 0.0 0.0 0.9 0.0 0.0 1.1 0.0 0.0
Chancroidb 0.0 0.0 0.0 0.0 0.0 0.0 0.0 0.0 0.0
Chlamydia trachomatisinfection 217.9 163.0 335.6 237.5 188.4 290.7 221.3 136.5 259.1
Congenital chlamydiab 0.7 0.0 0.0 0.9 0.0 0.6 0.0 0.0 0.3
Chlamydia]otherb 217.2 163.0 335.6 236.5 188.4 290.0 221.3 136.5 258.8
Cholerab 0.0 0.0 0.0 0.0 0.0 0.0 0.0 0.0 0.0
Creutzfeldt]Jakob diseaseb 0.0 0.4 0.0 0.0 0.0 0.5 0.0 0.3 0.0
Cryptosporidiosisb 11.4 6.9 2.2 41.1 21.8 19.8 23.1 17.5 25.7
Giardiasisb 23.3 25.0 18.1 41.1 26.4 35.4 32.5 10.7 4.1
Gonorrhoeab 8.5 3.7 29.4 2.8 5.7 12.0 2.7 11.4 9.9
Haemolytic uraemic syndrome 0.0 0.0 0.0 0.0 0.0 0.1 0.0 0.0 0.0
H. influenzaeserotype b 0.0 0.0 0.0 0.0 0.0 0.3 0.0 0.0 0.0
Hib epiglottitisb 0.0 0.0 0.0 0.0 0.0 0.0 0.0 0.0 0.0
Hib meningitisb 0.0 0.0 0.0 0.0 0.0 0.0 0.0 0.0 0.0
Hib septicaemiab 0.0 0.0 0.0 0.0 0.0 0.3 0.0 0.0 0.0
Hib infection NOSb 0.0 0.0 0.0 0.0 0.0 0.0 0.0 0.0 0.0
Hepatitis Ab 25.1 9.7 0.0 6.7 4.0 26.8 24.2 20.9 64.8
Hepatitis B 8.8 7.4 38.5 12.4 5.7 11.1 9.3 7.4 4.1
Hepatitis B]acute viralb 0.0 0.0 0.0 0.0 0.5 1.6 0.0 1.3 0.6
Hepatitis B]otherb 8.8 7.4 38.5 12.4 5.1 9.5 9.3 6.0 3.4
Hepatitis C 47.3 44.5 65.7 66.0 46.5 53.4 40.8 51.2 69.3
Hepatitis C]acute viralb 1.4 0.4 2.2 2.8 0.0 1.3 0.0 0.0 0.0
Hepatitis C]otherb 45.8 44.1 63.5 63.1 46.5 52.1 40.8 51.2 69.3
Hepatitis Db 0.0 0.0 0.0 0.0 0.0 0.0 0.0 0.0 0.3
Hepatitis Eb 0.0 0.0 0.0 0.0 0.0 0.0 0.0 0.0 0.0
HIV infectionb 0.7 2.7 4.5 0.9 1.1 2.5 0.5 1.6 1.3
Influenza 168.4 157.9 45.3 141.7 83.2 180.6 135.2 72.4 218.0
Influenza]Type A(H1)b 0.3 0.4 0.0 0.0 0.0 0.1 0.0 0.0 0.0
Influenza]Type A(H3)b 0.7 14.8 4.5 6.7 8.6 2.5 2.7 1.3 0.6
Influenza]Type A(Untyped)b 60.3 25.0 11.3 58.4 19.5 95.5 29.8 22.5 78.6
Influenza]Type (H1N1)b 106.9 117.5 29.4 76.6 55.1 82.3 102.7 48.5 138.7
Influenza]Type Bb 0.0 0.0 0.0 0.0 0.0 0.0 0.0 0.0 0.0
Legionellosis 0.0 0.0 2.2 1.9 1.7 1.6 1.1 0.3 1.3
Legionella longbeachaeb 0.0 0.0 2.2 0.0 1.1 1.1 0.5 0.3 1.3
L. pneumophilab 0.0 0.0 0.0 1.9 0.5 0.3 0.5 0.0 0.0
Legionnaires’ disease]other 0.0 0.0 0.0 0.0 0.0 0.1 0.0 0.0 0.0
Leprosy 0.0 0.0 0.0 0.0 0.0 0.0 0.0 0.0 0.0
Leptospirosisb 0.0 1.3 0.0 0.0 0.5 0.5 1.6 0.3 1.3
Listeriosisb 0.0 0.0 0.0 0.9 0.0 0.5 0.0 0.0 0.0
Lymphogranuloma venereum (LGV)b 0.0 0.0 0.0 0.0 0.0 0.0 0.0 0.0 0.0
Malariab 3.3 1.3 0.0 1.9 1.7 1.3 0.5 1.3 0.3
Measles 0.0 0.0 0.0 0.0 0.0 0.1 0.0 0.0 0.0
Measles]lab confirmed 0.0 0.0 0.0 0.0 0.0 0.1 0.0 0.0 0.0
Measles]other 0.0 0.0 0.0 0.0 0.0 0.0 0.0 0.0 0.0
Meningococcal disease 0.3 0.9 2.2 2.8 1.1 1.5 2.7 0.6 1.3
Meningococcal]serogroup Bb 0.3 0.9 0.0 1.9 1.1 1.1 2.2 0.6 1.3
Meningococcal]serogroup Cb 0.0 0.0 0.0 0.9 0.0 0.0 0.0 0.0 0.0
Meningococcal]serogroup W135b 0.0 0.0 0.0 0.0 0.0 0.0 0.0 0.0 0.0
Meningococcal]serogroup Yb 0.0 0.0 0.0 0.0 0.0 0.0 0.0 0.0 0.0
Meningococcal]other 0.0 0.0 0.0 0.0 0.0 0.3 0.0 0.0 0.0
Mumpsb 0.3 0.0 0.0 0.9 0.0 0.3 0.5 0.0 1.0
Pertussis 203.9 171.4 131.5 278.6 225.1 209.6 124.7 180.0 278.7
Pneumococcal disease (invasive)b 2.9 5.1 2.2 3.8 7.4 10.5 8.2 3.0 4.4
Psittacosisb 0.3 0.4 0.0 0.0 1.7 0.0 1.1 0.3 0.0
Q feverb 1.8 5.5 11.3 10.5 5.7 4.0 8.8 4.3 8.9
Rubella 0.0 0.4 0.0 0.0 0.0 0.1 0.0 0.0 0.0
Congenital rubellab 0.0 0.0 0.0 0.0 0.0 0.0 0.0 0.0 0.0
Rubella]otherb 0.0 0.4 0.0 0.0 0.0 0.1 0.0 0.0 0.0
Salmonellainfectionb,d 31.8 33.4 31.7 36.3 19.5 32.2 42.5 36.4 58.3
Shigellosisb 1.4 0.9 2.2 0.0 0.0 0.6 1.1 0.3 3.4
Syphilis 1.4 7.4 102.1 6.7 9.1 6.5 5.5 3.3 6.1
Congenital syphilis 0.0 0.0 0.0 0.0 0.0 0.0 0.0 0.0 0.0
Infectious syphilisb,c 1.4 0.9 0.0 0.9 1.1 2.6 0.0 0.3 1.3
Syphilis]otherb 0.0 6.5 102.1 5.7 8.0 3.8 5.5 3.0 4.8
Tetanus 0.0 0.0 0.0 0.0 0.0 0.0 0.0 0.0 0.0
Tuberculosisb 2.2 2.3 0.0 0.0 0.0 2.5 0.5 1.0 2.4
Typhoidb 0.7 0.0 0.0 0.0 0.5 0.3 0.0 0.0 0.3
Verotoxin-producing
Escherichia coliinfectionsb
0.0 0.0 0.0 0.0 0.0 1.6 0.5 0.3 0.3
aYear of onset: the earlier of patient reported onset date, specimen date or date of notification.bLaboratory-confirmed cases only.cIncludes syphilis primary, syphilis secondary, syphiliso1 y duration and syphilis newly acquired.d
Includes all paratyphoid cases.f
Area health service further divided into the geographical region covered by their component public health unit (PHU).g
Rate is based on a denominator of 8000 people.hIncludes cases with unknown PHU.NOS: not otherwise specified.No case of the following diseases have been notified since 1991: plagueb, diphtheriab, granuloma inguinaleb
, lyssavirusb
, poliomyelitisb
, rabies, smallpox, typhusb
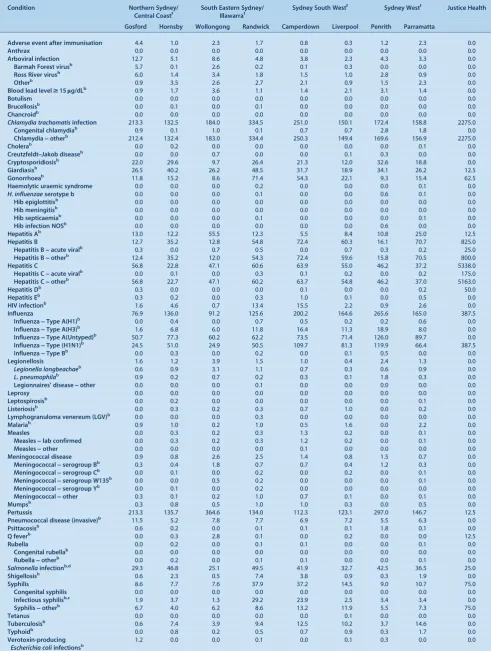
Condition Northern Sydney/ Central Coastf
South Eastern Sydney/ Illawarraf
Sydney South Westf Sydney Westf Justice Health
Gosford Hornsby Wollongong Randwick Camperdown Liverpool Penrith Parramatta
Adverse event after immunisation 4.4 1.0 2.3 1.7 0.8 0.3 1.2 2.3 0.0
Anthrax 0.0 0.0 0.0 0.0 0.0 0.0 0.0 0.0 0.0
Arboviral infection 12.7 5.1 8.6 4.8 3.8 2.3 4.3 3.3 0.0
Barmah Forest virusb 5.7 0.1 2.6 0.2 0.1 0.3 0.0 0.0 0.0
Ross River virusb 6.0 1.4 3.4 1.8 1.5 1.0 2.8 0.9 0.0
Otherb 0.9 3.5 2.6 2.7 2.1 0.9 1.5 2.3 0.0
Blood lead level$15lg/dLb 0.9 1.7 3.6 1.1 1.4 2.1 3.1 1.4 0.0
Botulism 0.0 0.0 0.0 0.0 0.0 0.0 0.0 0.0 0.0
Brucellosisb 0.0 0.1 0.0 0.1 0.0 0.0 0.0 0.0 0.0
Chancroidb 0.0 0.0 0.0 0.0 0.0 0.0 0.0 0.0 0.0
Chlamydia trachomatisinfection 213.3 132.5 184.0 334.5 251.0 150.1 172.4 158.8 2275.0
Congenital chlamydiab 0.9 0.1 1.0 0.1 0.7 0.7 2.8 1.8 0.0
Chlamydia]otherb 212.4 132.4 183.0 334.4 250.3 149.4 169.6 156.9 2275.0
Cholerab 0.0 0.2 0.0 0.0 0.0 0.0 0.0 0.1 0.0
Creutzfeldt]Jakob diseaseb 0.0 0.0 0.7 0.0 0.0 0.1 0.3 0.0 0.0
Cryptosporidiosisb 22.0 29.6 9.7 26.4 21.3 12.0 32.6 18.8 0.0
Giardiasisb 26.5 40.2 26.2 48.5 31.7 18.9 34.1 26.2 12.5
Gonorrhoeab 11.8 15.2 8.6 71.4 54.3 22.1 9.3 15.4 62.5
Haemolytic uraemic syndrome 0.0 0.0 0.0 0.2 0.0 0.0 0.0 0.1 0.0
H. influenzaeserotype b 0.0 0.0 0.0 0.1 0.0 0.0 0.6 0.1 0.0
Hib epiglottitisb 0.0 0.0 0.0 0.0 0.0 0.0 0.0 0.0 0.0
Hib meningitisb 0.0 0.0 0.0 0.0 0.0 0.0 0.0 0.0 0.0
Hib septicaemiab 0.0 0.0 0.0 0.1 0.0 0.0 0.0 0.1 0.0
Hib infection NOSb 0.0 0.0 0.0 0.0 0.0 0.0 0.6 0.0 0.0
Hepatitis Ab 13.0 12.2 55.5 12.3 5.5 8.4 10.8 25.0 12.5
Hepatitis B 12.7 35.2 12.8 54.8 72.4 60.3 16.1 70.7 825.0
Hepatitis B]acute viralb 0.3 0.0 0.7 0.5 0.0 0.7 0.3 0.2 25.0
Hepatitis B]otherb 12.4 35.2 12.0 54.3 72.4 59.6 15.8 70.5 800.0
Hepatitis C 56.8 22.8 47.1 60.6 63.9 55.0 46.2 37.2 5338.0
Hepatitis C]acute viralb 0.0 0.1 0.0 0.3 0.1 0.2 0.0 0.2 175.0
Hepatitis C]otherb 56.8 22.7 47.1 60.2 63.7 54.8 46.2 37.0 5163.0
Hepatitis Db 0.3 0.0 0.0 0.0 0.1 0.0 0.0 0.2 50.0
Hepatitis Eb 0.3 0.2 0.0 0.3 1.0 0.1 0.0 0.5 0.0
HIV infectionb 1.6 4.6 0.7 13.4 15.5 2.2 0.9 2.6 0.0
Influenza 76.9 136.0 91.2 125.6 200.2 164.6 265.6 165.0 387.5
Influenza]Type A(H1)b 0.0 0.4 0.0 0.7 0.5 0.2 0.2 0.6 0.0
Influenza]Type A(H3)b 1.6 6.8 6.0 11.8 16.4 11.3 18.9 8.0 0.0
Influenza]Type A(Untyped)b 50.7 77.3 60.2 62.2 73.5 71.4 126.0 89.7 0.0
Influenza]Type (H1N1)b 24.5 51.0 24.9 50.5 109.7 81.3 119.9 66.4 387.5
Influenza]Type Bb 0.0 0.3 0.0 0.2 0.0 0.1 0.5 0.0 0.0
Legionellosis 1.6 1.2 3.9 1.5 1.0 0.4 2.4 1.3 0.0
Legionella longbeachaeb 0.6 0.9 3.1 1.1 0.7 0.3 0.6 0.9 0.0
L. pneumophilab 0.9 0.2 0.7 0.2 0.3 0.1 1.8 0.3 0.0
Legionnaires’ disease]other 0.0 0.0 0.0 0.1 0.0 0.0 0.0 0.0 0.0
Leprosy 0.0 0.0 0.0 0.0 0.0 0.0 0.0 0.0 0.0
Leptospirosisb 0.0 0.2 0.0 0.0 0.0 0.0 0.0 0.1 0.0
Listeriosisb 0.0 0.3 0.2 0.3 0.7 1.0 0.0 0.2 0.0
Lymphogranuloma venereum (LGV)b 0.0 0.0 0.0 0.3 0.0 0.0 0.0 0.0 0.0
Malariab 0.9 1.0 0.2 1.0 0.5 1.6 0.0 2.2 0.0
Measles 0.0 0.3 0.2 0.3 1.3 0.2 0.0 0.1 0.0
Measles]lab confirmed 0.0 0.3 0.2 0.3 1.2 0.2 0.0 0.1 0.0
Measles]other 0.0 0.0 0.0 0.0 0.1 0.0 0.0 0.0 0.0
Meningococcal disease 0.9 0.8 2.6 2.5 1.4 0.8 1.5 0.7 0.0
Meningococcal]serogroup Bb 0.3 0.4 1.8 0.7 0.7 0.4 1.2 0.3 0.0
Meningococcal]serogroup Cb 0.0 0.1 0.0 0.2 0.0 0.2 0.0 0.1 0.0
Meningococcal]serogroup W135b 0.0 0.0 0.5 0.2 0.0 0.0 0.0 0.1 0.0
Meningococcal]serogroup Yb 0.0 0.1 0.0 0.2 0.0 0.0 0.0 0.0 0.0
Meningococcal]other 0.3 0.1 0.2 1.0 0.7 0.1 0.0 0.1 0.0
Mumpsb 0.3 0.8 0.5 1.0 1.0 0.3 0.0 0.5 0.0
Pertussis 213.3 135.7 364.6 134.0 112.3 123.1 297.0 146.7 12.5
Pneumococcal disease (invasive)b 11.5 5.2 7.8 7.7 6.9 7.2 5.5 6.3 0.0
Psittacosisb 0.6 0.2 0.0 0.1 0.1 0.1 1.8 0.1 0.0
Q feverb 0.0 0.3 2.8 0.1 0.0 0.2 0.0 0.0 12.5
Rubella 0.0 0.2 0.0 0.1 0.1 0.0 0.0 0.1 0.0
Congenital rubellab 0.0 0.0 0.0 0.0 0.0 0.0 0.0 0.0 0.0
Rubella]otherb 0.0 0.2 0.0 0.1 0.1 0.0 0.0 0.1 0.0
Salmonellainfectionb,d 29.3 46.8 25.1 49.5 41.9 32.7 42.5 36.5 25.0
Shigellosisb 0.6 2.3 0.5 7.4 3.8 0.9 0.3 1.9 0.0
Syphilis 8.6 7.7 7.6 37.9 37.2 14.5 9.0 10.7 75.0
Congenital syphilis 0.0 0.0 0.0 0.0 0.0 0.0 0.0 0.0 0.0
Infectious syphilisb,c 1.9 3.7 1.3 29.2 23.9 2.5 3.4 3.4 0.0
Syphilis]otherb 6.7 4.0 6.2 8.6 13.2 11.9 5.5 7.3 75.0
Tetanus 0.0 0.0 0.0 0.0 0.0 0.1 0.0 0.0 0.0
Tuberculosisb 0.6 7.4 3.9 9.4 12.5 10.2 3.7 14.6 0.0
Typhoidb 0.0 0.8 0.2 0.5 0.7 0.9 0.3 1.7 0.0
Verotoxin-producing
Escherichia coliinfectionsb
1.2 0.0 0.0 0.1 0.0 0.1 0.3 0.0 0.0
aYear of onset: the earlier of patient reported onset date, specimen date or date of notification.bLaboratory-confirmed cases only.cIncludes syphilis primary, syphilis secondary, syphiliso1 y duration and syphilis newly acquired.d
Includes all paratyphoid cases.f
Area health service further divided into the geographical region covered by their component public health unit (PHU).g Rate is based on a denominator of 8000 people.hIncludes cases with unknown PHU. NOS: not otherwise specified. No case of the following diseases have been notified since 1991: plagueb, diphtheriab, granuloma inguinaleb
, lyssavirusb
, poliomyelitisb
, rabies, smallpox, typhusb
, viral haemorrhagic fever, yellow fever. 2009 influenza data: cases reported to PHUs; contain 50 laboratory notifications from either interstate residents or overseas.
Table 3. (Continued)
Year in review
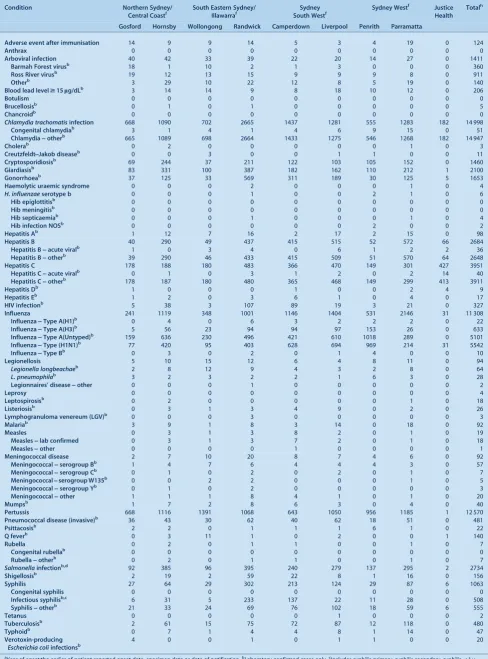
Table 4. Disease notifications by area health service of residence, NSW, 2009 (based on onset of illnessa)
Condition Greater Southernf Greater Westernf Hunter/New Englandf North Coastf
Albury Goulburn Broken Hill Dubbo Bathurst Newcastle Tamworth Port Macquarie Lismore
Adverse event after immunisation 15 12 0 3 1 9 2 1 4
Anthrax 0 0 0 0 0 0 0 0 0
Arboviral infection 74 23 42 48 20 336 78 229 320
Barmah Forest virusb 3 10 8 1 2 90 14 83 114
Ross River virusb 69 11 34 47 18 238 60 141 197
Otherb 2 2 0 0 0 8 4 5 9
Blood lead level$15lg/dLb 9 1 15 29 4 48 1 2 9
Botulism 0 0 0 0 0 0 0 0 0
Brucellosisb 0 0 0 1 0 0 2 0 0
Chancroidb 0 0 0 0 0 0 0 0 0
Chlamydia trachomatisinfection 589 351 148 248 328 1740 401 405 755
Congenital chlamydiab 2 0 0 1 0 4 0 0 1
Chlamydia]otherb 587 351 148 247 328 1736 401 405 754
Cholerab 0 0 0 0 0 0 0 0 0
Creutzfeldt]Jakob diseaseb 0 1 0 0 0 3 0 1 0
Cryptosporidiosisb 31 15 1 43 38 119 42 52 75
Giardiasisb 63 54 8 43 46 212 59 32 12
Gonorrhoeab 23 8 13 3 10 72 5 34 29
Haemolytic uraemic syndrome 0 0 0 0 0 1 0 0 0
H. influenzaeserotype b 0 0 0 0 0 2 0 0 0
Hib epiglottitisb 0 0 0 0 0 0 0 0 0
Hib meningitisb 0 0 0 0 0 0 0 0 0
Hib septicaemiab 0 0 0 0 0 2 0 0 0
Hib infection NOSb 0 0 0 0 0 0 0 0 0
Hepatitis Ab 6 1 1 0 0 9 1 2 4
Hepatitis B 24 16 17 13 10 67 17 22 12
Hepatitis B]acute viralb 0 0 0 0 1 10 0 4 2
Hepatitis B]otherb 24 16 17 13 9 57 17 18 10
Hepatitis C 128 96 29 69 81 320 74 152 202
Hepatitis C]acute viralb 4 1 1 3 0 8 0 0 0
Hepatitis C]otherb 124 95 28 66 81 312 74 152 202
Hepatitis Db 0 0 0 0 0 0 0 0 1
Hepatitis Eb 0 0 0 0 0 0 0 0 0
HIV infectionb 2 6 2 1 2 15 1 5 4
Influenza 455 340 20 148 145 1081 245 215 635
Influenza]Type A(H1)b 1 1 0 0 0 1 0 0 0
Influenza]Type A(H3)b 2 32 2 7 15 15 5 4 2
Influenza]Type A(Untyped)b 163 54 5 61 34 572 54 67 229
Influenza]Type (H1N1)b 289 253 13 80 96 493 186 144 404
Influenza]Type Bb 0 0 0 0 0 0 0 0 0
Legionellosis 0 0 1 2 3 10 2 1 4
Legionella longbeachaeb 0 0 1 0 2 7 1 1 4
L. pneumophilab 0 0 0 2 1 2 1 0 0
Legionnaires’ disease]other 0 0 0 0 0 1 0 0 0
Leprosy 0 0 0 0 0 0 0 0 0
Leptospirosisb 0 3 0 0 1 3 3 1 4
Listeriosisb 0 0 0 1 0 3 0 0 0
Lymphogranuloma venereum (LGV)b 0 0 0 0 0 0 0 0 0
Malariab 9 3 0 2 3 8 1 4 1
Measles 0 0 0 0 0 1 0 0 0
Measles]lab confirmed 0 0 0 0 0 1 0 0 0
Measles]other 0 0 0 0 0 0 0 0 0
Meningococcal disease 1 2 0 3 2 9 4 2 4
Meningococcal]serogroup Bb 1 2 0 2 2 7 4 2 4
Meningococcal]serogroup Cb 0 0 0 1 0 0 0 0 0
Meningococcal]serogroup W135b 0 0 0 0 0 0 0 0 0
Meningococcal]serogroup Yb 0 0 0 0 0 0 0 0 0
Meningococcal]other 0 0 0 0 0 2 0 0 0
Mumpsb 1 0 0 1 0 2 1 0 3
Pertussis 551 369 58 291 392 1255 226 534 812
Pneumococcal disease (invasive)b 8 11 1 4 13 63 15 9 13
Psittacosisb 1 1 0 0 3 0 2 1 0
Q feverb 5 12 5 11 10 24 16 13 26
Rubella 0 1 0 0 0 1 0 0 0
Congenital rubellab 0 0 0 0 0 0 0 0 0
Rubella]otherb 0 1 0 0 0 1 0 0 0
Salmonellainfectionb,d 86 72 14 38 34 193 77 108 170
Shigellosisb 4 2 1 0 0 4 2 1 10
Syphilis 4 16 45 7 16 39 10 10 18
Congenital syphilis 0 0 0 0 0 0 0 0 0
Infectious syphilisb,c 4 2 0 1 2 16 0 1 4
Syphilis]otherb 0 14 45 6 14 23 10 9 14
Tetanus 0 0 0 0 0 0 0 0 0
Tuberculosisb 6 5 0 0 0 15 1 3 7
Typhoidb 2 0 0 0 1 2 0 0 1
Verotoxin-producing
Escherichia coliinfectionsb
0 0 0 0 0 10 1 1 1
a
Year of onset:the earlier of patient reported onset date, specimen date or date of notification.b
Laboratory-confirmed cases only.c
Includes syphilis primary, syphilis secondary, syphiliso1 y duration and syphilis newly acquired.d
Includes all paratyphoid cases.f
Area health service further divided into the geographical region covered by their component public health unit (PHU).g Rate is based on a denominator of 8000 people.h
Includes cases with unknown PHU. NOS: not otherwise specified. No case of the following diseases have been notified since 1991: plagueb , diphtheriab
, granuloma inguinaleb
, lyssavirusb
, poliomyelitisb
, rabies, smallpox, typhusb
Condition Northern Sydney/ Central Coastf
South Eastern Sydney/ Illawarraf
Sydney South Westf
Sydney Westf Justice
Health Totalh
Gosford Hornsby Wollongong Randwick Camperdown Liverpool Penrith Parramatta
Adverse event after immunisation 14 9 9 14 5 3 4 19 0 124
Anthrax 0 0 0 0 0 0 0 0 0 0
Arboviral infection 40 42 33 39 22 20 14 27 0 1411
Barmah Forest virusb 18 1 10 2 1 3 0 0 0 360
Ross River virusb 19 12 13 15 9 9 9 8 0 911
Otherb 3 29 10 22 12 8 5 19 0 140
Blood lead level$15lg/dLb 3 14 14 9 8 18 10 12 0 206
Botulism 0 0 0 0 0 0 0 0 0 0
Brucellosisb 0 1 0 1 0 0 0 0 0 5
Chancroidb 0 0 0 0 0 0 0 0 0 0
Chlamydia trachomatisinfection 668 1090 702 2665 1437 1281 555 1283 182 14 998
Congenital chlamydiab 3 1 4 1 4 6 9 15 0 51
Chlamydia]otherb 665 1089 698 2664 1433 1275 546 1268 182 14 947
Cholerab 0 2 0 0 0 0 0 1 0 3
Creutzfeldt]Jakob diseaseb 0 0 3 0 0 1 1 0 0 11
Cryptosporidiosisb 69 244 37 211 122 103 105 152 0 1460
Giardiasisb 83 331 100 387 182 162 110 212 1 2100
Gonorrhoeab 37 125 33 569 311 189 30 125 5 1653
Haemolytic uraemic syndrome 0 0 0 2 0 0 0 1 0 4
H. influenzaeserotype b 0 0 0 1 0 0 2 1 0 6
Hib epiglottitisb 0 0 0 0 0 0 0 0 0 0
Hib meningitisb 0 0 0 0 0 0 0 0 0 0
Hib septicaemiab 0 0 0 1 0 0 0 1 0 4
Hib infection NOSb 0 0 0 0 0 0 2 0 0 2
Hepatitis Ab 1 12 7 16 2 17 2 15 0 98
Hepatitis B 40 290 49 437 415 515 52 572 66 2684
Hepatitis B]acute viralb 1 0 3 4 0 6 1 2 2 36
Hepatitis B]otherb 39 290 46 433 415 509 51 570 64 2648
Hepatitis C 178 188 180 483 366 470 149 301 427 3951
Hepatitis C]acute viralb 0 1 0 3 1 2 0 2 14 40
Hepatitis C]otherb 178 187 180 480 365 468 149 299 413 3911
Hepatitis Db 1 0 0 0 1 0 0 2 4 9
Hepatitis Eb 1 2 0 3 6 1 0 4 0 17
HIV infectionb 5 38 3 107 89 19 3 21 0 327
Influenza 241 1119 348 1001 1146 1404 531 2146 31 11 308
Influenza]Type A(H1)b 0 4 0 6 3 2 2 2 0 22
Influenza]Type A(H3)b 5 56 23 94 94 97 153 26 0 633
Influenza]Type A(Untyped)b 159 636 230 496 421 610 1018 289 0 5101
Influenza]Type (H1N1)b 77 420 95 403 628 694 969 214 31 5542
Influenza]Type Bb 0 3 0 2 0 1 4 0 0 10
Legionellosis 5 10 15 12 6 4 8 11 0 94
Legionella longbeachaeb 2 8 12 9 4 3 2 8 0 64
L. pneumophilab 3 2 3 2 2 1 6 3 0 28
Legionnaires’ disease]other 0 0 0 1 0 0 0 0 0 2
Leprosy 0 0 0 0 0 0 0 0 0 4
Leptospirosisb 0 2 0 0 0 0 0 1 0 18
Listeriosisb 0 3 1 3 4 9 0 2 0 26
Lymphogranuloma venereum (LGV)b 0 0 0 3 0 0 0 0 0 3
Malariab 3 9 1 8 3 14 0 18 0 92
Measles 0 3 1 3 8 2 0 1 0 19
Measles]lab confirmed 0 3 1 3 7 2 0 1 0 18
Measles]other 0 0 0 0 1 0 0 0 0 1
Meningococcal disease 2 7 10 20 8 7 4 6 0 92
Meningococcal]serogroup Bb 1 4 7 6 4 4 4 3 0 57
Meningococcal]serogroup Cb 0 1 0 2 0 2 0 1 0 7
Meningococcal]serogroup W135b 0 0 2 2 0 0 0 1 0 5
Meningococcal]serogroup Yb 0 1 0 2 0 0 0 0 0 3
Meningococcal]other 1 1 1 8 4 1 0 1 0 20
Mumpsb 1 7 2 8 6 3 0 4 0 40
Pertussis 668 1116 1391 1068 643 1050 956 1185 1 12 570
Pneumococcal disease (invasive)b 36 43 30 62 40 62 18 51 0 481
Psittacosisb 2 2 0 1 1 1 6 1 0 22
Q feverb 0 3 11 1 0 2 0 0 1 140
Rubella 0 2 0 1 1 0 0 1 0 7
Congenital rubellab 0 0 0 0 0 0 0 0 0 0
Rubella]otherb 0 2 0 1 1 0 0 1 0 7
Salmonellainfectionb,d 92 385 96 395 240 279 137 295 2 2734
Shigellosisb 2 19 2 59 22 8 1 16 0 156
Syphilis 27 64 29 302 213 124 29 87 6 1063
Congenital syphilis 0 0 0 0 0 0 0 0 0 0
Infectious syphilisb,c 6 31 5 233 137 22 11 28 0 508
Syphilis]otherb 21 33 24 69 76 102 18 59 6 555
Tetanus 0 0 0 0 0 1 0 0 0 2
Tuberculosisb 2 61 15 75 72 87 12 118 0 480
Typhoidb 0 7 1 4 4 8 1 14 0 47
Verotoxin-producing
Escherichia coliinfectionsb
4 0 0 1 0 1 1 0 0 20
a
Year of onset:the earlier of patient reported onset date, specimen date or date of notification.b
Laboratory-confirmed cases only.c
Includes syphilis primary, syphilis secondary, syphiliso1 y duration and syphilis newly acquired.d
Includes all paratyphoid cases.f
Area health service further divided into the geographical region covered by their component public health unit (PHU).g Rate is based on a denominator of 8000 people.h
Includes cases with unknown PHU. NOS: not otherwise specified. No case of the following diseases have been notified since 1991: plagueb , diphtheriab
, granuloma inguinaleb
, lyssavirusb
, poliomyelitisb
, rabies, smallpox, typhusb
, viral haemorrhagic fever, yellow fever. 2009 influenza data: cases reported to PHUs; contain 50 laboratory notifications from either interstate residents or overseas.
Table 4. (Continued)
Year in review
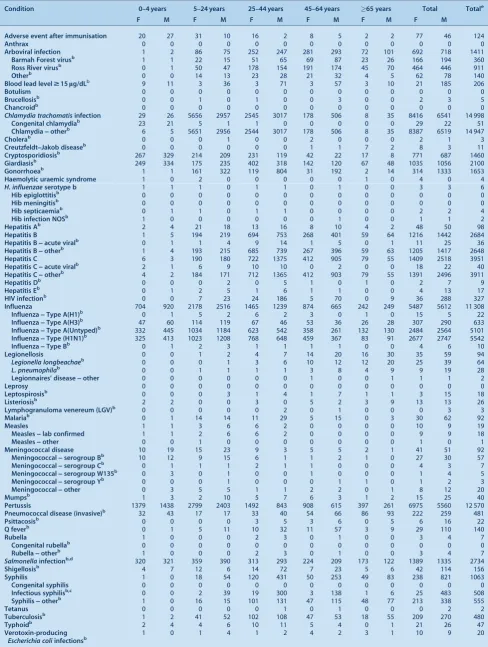
Table 5. Disease notifications by age group and sex of the case, NSW, 2009 (based on onset of illnessa)
Condition 0–4 years 5–24 years 25–44 years 45–64 years 65 years Total Totale
F M F M F M F M F M F M
Adverse event after immunisation 20 27 31 10 16 2 8 5 2 2 77 46 124
Anthrax 0 0 0 0 0 0 0 0 0 0 0 0 0
Arboviral infection 1 2 86 75 252 247 281 293 72 101 692 718 1411
Barmah Forest virusb
1 1 22 15 51 65 69 87 23 26 166 194 360
Ross River virusb
0 1 50 47 178 154 191 174 45 70 464 446 911
Otherb
0 0 14 13 23 28 21 32 4 5 62 78 140
Blood lead level$15lg/dLb 9 11 3 36 3 71 3 57 3 10 21 185 206
Botulism 0 0 0 0 0 0 0 0 0 0 0 0 0
Brucellosisb 0 0 1 0 1 0 0 3 0 0 2 3 5
Chancroidb
0 0 0 0 0 0 0 0 0 0 0 0 0
Chlamydia trachomatisinfection 29 26 5656 2957 2545 3017 178 506 8 35 8416 6541 14 998
Congenital chlamydiab
23 21 5 1 1 0 0 0 0 0 29 22 51
Chlamydia]otherb
6 5 5651 2956 2544 3017 178 506 8 35 8387 6519 14 947
Cholerab
0 0 0 1 0 0 2 0 0 0 2 1 3
Creutzfeldt]Jakob diseaseb
0 0 0 0 0 0 1 1 7 2 8 3 11
Cryptosporidiosisb
267 329 214 209 231 119 42 22 17 8 771 687 1460
Giardiasisb
249 334 175 235 402 318 142 120 67 48 1035 1056 2100
Gonorrhoeab
1 1 161 322 119 804 31 192 2 14 314 1333 1653
Haemolytic uraemic syndrome 1 0 2 0 0 0 0 0 1 0 4 0 4
H. influenzaeserotype b 1 1 1 0 1 1 0 1 0 0 3 3 6
Hib epiglottitisb
0 0 0 0 0 0 0 0 0 0 0 0 0
Hib meningitisb
0 0 0 0 0 0 0 0 0 0 0 0 0
Hib septicaemiab
0 1 1 0 1 1 0 0 0 0 2 2 4
Hib infection NOSb
1 0 0 0 0 0 0 1 0 0 1 1 2
Hepatitis Ab
2 4 21 18 13 16 8 10 4 2 48 50 98
Hepatitis B 1 5 194 219 694 753 268 401 59 64 1216 1442 2684
Hepatitis B]acute viralb
0 1 1 4 9 14 1 5 0 1 11 25 36
Hepatitis B]otherb
1 4 193 215 685 739 267 396 59 63 1205 1417 2648
Hepatitis C 6 3 190 180 722 1375 412 905 79 55 1409 2518 3951
Hepatitis C]acute viralb 2 1 6 9 10 10 0 2 0 0 18 22 40
Hepatitis C]otherb 4 2 184 171 712 1365 412 903 79 55 1391 2496 3911
Hepatitis Db 0 0 0 2 0 5 1 0 1 0 2 7 9
Hepatitis Eb 0 1 2 5 1 6 1 1 0 0 4 13 17
HIV infectionb
0 0 7 23 24 186 5 70 0 9 36 288 327
Influenza 704 920 2178 2516 1465 1239 874 665 242 249 5487 5612 11 308
Influenza]Type A(H1)b
0 1 5 2 6 2 3 0 1 0 15 5 22
Influenza]Type A(H3)b
47 60 114 119 67 46 53 36 26 28 307 290 633
Influenza]Type A(Untyped)b
332 445 1034 1184 623 542 358 261 132 130 2484 2564 5101
Influenza]Type (H1N1)b
325 413 1023 1208 768 648 459 367 83 91 2677 2747 5542
Influenza]Type Bb
0 1 2 3 1 1 1 1 0 0 4 6 10
Legionellosis 0 0 1 2 4 7 14 20 16 30 35 59 94
Legionella longbeachaeb
0 0 0 1 3 6 10 12 12 20 25 39 64
L. pneumophilab
0 0 1 1 1 1 3 8 4 9 9 19 28
Legionnaires’ disease]other 0 0 0 0 0 0 1 0 0 1 1 1 2
Leprosy 0 0 0 0 0 0 0 0 0 0 0 0 0
Leptospirosisb
0 0 0 3 1 4 1 7 1 1 3 15 18
Listeriosisb
2 2 0 0 3 0 5 2 3 9 13 13 26
Lymphogranuloma venereum (LGV)b
0 0 0 0 0 2 0 1 0 0 0 3 3
Malariab
0 1 14 14 11 29 5 15 0 3 30 62 92
Measles 1 1 3 6 6 2 0 0 0 0 10 9 19
Measles]lab confirmed 1 1 2 6 6 2 0 0 0 0 9 9 18
Measles]other 0 0 1 0 0 0 0 0 0 0 1 0 1
Meningococcal disease 10 19 15 23 9 3 5 5 2 1 41 51 92
Meningococcal]serogroup Bb 10 12 9 15 6 1 1 2 1 0 27 30 57
Meningococcal]serogroup Cb 0 1 1 1 2 1 1 0 0 0 4 3 7
Meningococcal]serogroup W135b
0 3 0 1 0 0 1 0 0 0 1 4 5
Meningococcal]serogroup Yb
0 0 0 1 0 0 0 1 1 0 1 2 3
Meningococcal]other 0 3 5 5 1 1 2 2 0 1 8 12 20
Mumpsb
1 3 2 10 5 7 6 3 1 2 15 25 40
Pertussis 1379 1438 2799 2403 1492 843 908 615 397 261 6975 5560 12 570
Pneumococcal disease (invasive)b
32 43 17 17 33 40 54 66 86 93 222 259 481
Psittacosisb
0 0 0 0 3 5 3 6 0 5 6 16 22
Q feverb
0 1 5 11 10 32 11 57 3 9 29 110 140
Rubella 1 0 0 0 2 3 0 1 0 0 3 4 7
Congenital rubellab
0 0 0 0 0 0 0 0 0 0 0 0 0
Rubella]otherb
1 0 0 0 2 3 0 1 0 0 3 4 7
Salmonellainfectionb,d
320 321 359 390 313 293 224 209 173 122 1389 1335 2734
Shigellosisb
4 7 12 6 14 72 7 23 5 6 42 114 156
Syphilis 1 0 18 54 120 431 50 253 49 83 238 821 1063
Congenital syphilis 0 0 0 0 0 0 0 0 0 0 0 0 0
Infectious syphilisb,c
0 0 2 39 19 300 3 138 1 6 25 483 508
Syphilis]otherb
1 0 16 15 101 131 47 115 48 77 213 338 555
Tetanus 0 0 0 0 0 1 0 1 0 0 0 2 2
Tuberculosisb 1 2 41 52 102 108 47 53 18 55 209 270 480
Typhoidb 2 4 4 6 10 11 5 4 0 1 21 26 47
Verotoxin-producing
Escherichia coliinfectionsb
1 0 1 4 1 2 4 2 3 1 10 9 20
a
Year of onset: the earlier of patient reported onset date, specimen date or date of notification.b
Laboratory-confirmed cases only.c
Includes syphilis primary, syphilis secondary, syphiliso1 y duration and syphilis newly acquired.d
Includes all paratyphoid cases.e
Includes cases with unknown age and sex and people who identify as transgender. NOS: not otherwise specified. F: female. M: male. Institutional gastrointestinal outbreaks and foodborne illness are excluded from the Table as complete demographic data are not routinely collected. 2009 influenza data: cases reported to public health units; contain 50 laboratory notifications from either interstate residents or overseas. No case of the following diseases have been notified since 1991: plagueb
, diphtheriab , granuloma inguinaleb
, lyssavirusb
, poliomyelitisb
, rabies, smallpox, typhusb
this area were male. Shigellosis in Sydney has been associated with men who have sex with men.3
• Salmonellosis (including infections caused by
Salmo-nella Paratyphi) was the most frequently reported
condition, with 2681 notifications, an increase of 20% compared to the previous 5-year average. An increase in
S. Typhimurium 170 was seen nationwide and the cause of this increase was not identified.
• Of the 68 foodborne outbreaks seen in 2009, 24 (35%) were linked toSalmonella.
Comment
The outbreak of cryptosporidiosis reinforces the impor-tance of keeping swimming pools free of infectious patho-gens through awareness among patrons of not swimming within 2 weeks of experiencing diarrhoea, and pool opera-tors maintaining high sanitary standards.
The numerous foodborne outbreaks emphasise the need for vigilance in the maintenance of safe food-handling practices.
Respiratory diseases
Highlights in 2009 included:
• The emergence and outbreak of pandemic (H1N1) 2009 influenza which involved the most intensive public health response of recent years. Unpublished serological studies suggest that around 16% of the community had acquired the virus. People aged less than 65 years were much more likely to have acquired the infection than older people, with up to 35% of adolescents aged 12–17 years esti-mated to have acquired the infection. Once the pandemic was established in Australia, testing was only recom-mended where it would change clinical management or for surveillance purposes. In NSW, over 5000 cases were confirmed by laboratory testing. This underestimates the true incidence of disease. The outbreak peaked in mid-July, with approximately 1300 people presenting to emergency departments each week with influenza-like illnesses. In total 54 people died with confirmed pan-demic (H1N1) influenza, although infection may have contributed to other deaths as well. Compared with previous outbreaks of seasonal influenza, pandemic (H1N1) 2009 caused much more illness in people under 60 years of age.4
• The number of cases of legionellosis remained steady in 2009 with 94 notifications. The last 2 years have seen
more Legionella longbeachae than L. pneumophilia
cases, a reversal of the historical distribution.
Comment
The emergence and substantial impact of pandemic (H1N1) influenza in 2009 reinforces the need for vigilance in the detection of emerging infections and for prepared-ness to manage such outbreaks. NSW Health continues to
review the lessons learnt from the response to the pan-demic to inform the revision of panpan-demic response plans for future implementation.
Vaccine-preventable diseases
Highlights in 2009 included:
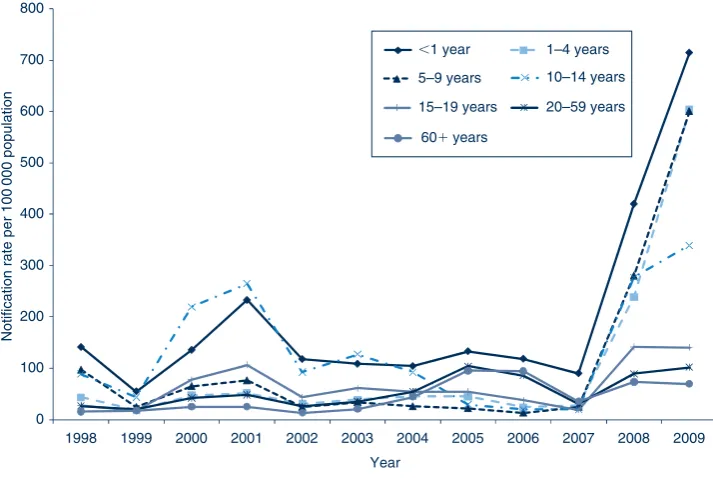
• In 2009, 12 578 notifications of pertussis were reported in NSW following a significant increase in 2008 (8759), and compared with 2100 notifications in 2007. While epidemics of pertussis occur every 3 to 5 years, notifica-tions in 2008 and 2009 far exceeded previous epidemics. In 2009 the number of notifications increased in chil-dren aged less than 5 years (from 1206 notifications in 2008 to 2826 notifications in 2009); of these 86% had complete immunisation status. The highest increase in this age group was for those aged 3 years, which may reflect waning immunity following the primary course of immunisation at 2, 4 and 6 months of age and prior to receiving a booster dose at 4 years of age. In addition, the greater number of notifications in the 2009 epidemic compared with past epidemics may reflect more wide-spread use by laboratories of nucleic acid testing for pertussis, which is more sensitive than other methods for diagnosis.5
• Notifications of meningococcal disease have generally been declining in the past 10 years. A vaccine for serogroup C disease was added to the National Immunisa-tion Program (in 2003) for children at 12 months of age. The vaccine was provided free to all children aged 1–19 years through schools and other programs. The greatest reduction in notifications over the subsequent years has been for meningococcal disease due to serogroup C, with seven cases reported in 2009. Notifications for other serogroups (B, W 135 and Y) have remained relatively stable.6
• There continued to be a decline in the rates of measles, mumps and rubella.
Comment
The outbreak of pertussis highlights the challenge of increasing vaccination rates among adolescents and young adults, as well as the importance of promoting and main-taining high vaccination rates in infants and their carers (Tables 1–5).
Acknowledgments
We thank all those general and specialist medical practices, laboratories, hospitals, schools, child-care centres, and others who have notified diseases of public health significance to their local public health units for investigation and control.
References
1. Fleming DT, Wasserheit JN. From epidemiological synergy to public health policy and practice: the contribution to other sexually transmitted diseases to sexual transmission of HIV infection.Sex Transm Infect1999; 75: 3–17.
Year in review
2. Communicable Diseases Branch. NSW Department of Health. Communicable Diseases Report, NSW, January and February 2009.N S W Public Health Bull2009; 20(3–4): 71–5.
3. O’Sullivan B, Delpech V, Pontivivo G, Karagiannis T, Marriott D, Harkness J et al. Shigellosis linked to sex venues, Australia.Emerg Infect Dis2002; 8(8): 862–4.
4. NSW Health. 2009. Influenza Monthly Epidemiology Report, NSW. Available from: http://www.health.nsw.gov.au/
publichealth/Infectious/reports/influenza_05022010.asp (Accessed 12 May 2010.)
5. Communicable Diseases Branch. NSW Department of Health. Communicable Diseases Report, NSW, March and April 2009. N S W Public Health Bull2009; 20(5–6): 99–103.