Quantifying the interactions between defoliation interval, defoliation intensity and nitrogen fertiliser application on the nutritive value of rainfed and irrigated perennial ryegrass
K.G. PembletonA*, R.P. RawnsleyB, L.R. TurnerB, R. CorkreyC, D.J. DonaghyD
AUniversity of Southern Queensland, School of Agricultural, Computational and
Environmental Sciences and Institute for Agriculture and the Environment, Toowoomba QLD 4350
BTasmanian Institute of Agriculture, University of Tasmania, Burnie, TAS 7320 CTasmanian Institute of Agriculture, University of Tasmania, Hobart, TAS 7320 DMassey University, Palmerston North 4442, New Zealand
*Corresponding Author: Keith.Pembleton@usq.edu.au
Running head: Impact of defoliation management on nutritive value 1
Abstract. A key goal of temperate pasture management is to optimise the nutritive value and production of pastures. Extensive research has examined the influence of single components such as irrigation, nitrogen (N) fertiliser, and grazing interval and grazing intensity, yet conjecture remains regarding practices that optimise pasture nutritive value. Much of this conjecture relates to interactions between inputs and grazing management. A two-year split-split plot experiment was undertaken to investigate these interactions using a perennial ryegrass dominant pasture at Elliott, Tasmania. Irrigation treatments (rainfed or irrigated) were main plots and defoliation intervals (leaf regrowth stages; 1-leaf, 2-leaf or 3-leaf) were subplots. Defoliation intensity (30, 55 or 80 mm defoliation height) and N fertiliser (0.0, 1.5 or 3.0 kg N/ha/day) were crossed within sub-subplots. Herbage samples were collected from each plot four times over the experimental period and were analysed for neutral detergent fibre (NDF), acid detergent fibre (ADF) and crude protein (CP) concentrations (% dry matter (DM)). Metabolisable energy (ME) concentration (MJ/kg DM) was estimated from these values. The ME concentration decreased as defoliation height and defoliation interval increased for all time points except during winter. The CP concentration increased with increasing N fertiliser applications in the plots defoliated at the 1-leaf stage, but this increase only occurred as N applications increased from 1.5 to 3.0 kg N/ha/day for the plots defoliated at the 2-leaf and 3-leaf stages of regrowth. As N application rates increased from 0 to 1.5 kg N/ha/day, plots defoliated at the 3-leaf stage had greater increases in NDF concentration compared to plots defoliated at the 1-leaf stage of regrowth, except during spring. As defoliation height and interval increased ADF concentration increased in both spring and summer. While defoliating at frequent intervals (1-leaf stage) and lower heights (30 mm) produced pasture of a marginally higher nutritional value, these benefits are mitigated by the previously established negative consequences of lower pasture yield and poor pasture
persistence. Consequently, grazing management that maximises pasture productivity and persistence (defoliated between the 2- and 3-leaf regrowth stages to a height of 55 mm) should be applied to perennial ryegrass pastures irrespective of input management.
Key words: grazing management, pasture-based dairy systems, intensive pasture production 18
Introduction
The most cost effective feed source for dairy cows in the temperate regions of Australia and New Zealand are perennial ryegrass (Lolium perenne L.) dominant pastures (Chapman et al. 2009). Consequently, mixtures of perennial ryegrass and white clover (Trifolium repens L.) are the principle feedbase supporting the dairy industry in these regions (Doyle et al. 2000; Holmes 2007). Grazing management is a key driver of the productivity, nutritive value and persistence of temperate pastures and has attracted considerable research attention (Graham et al. 2000; Fulkerson and Donaghy 2001; Lee et al. 2008). Despite this, conjecture remains around the application of grazing management principles due to genetic gains in pasture breeding programs (approximately 0.5% per year; Lee et al. 2012), and an intensification of grazing systems via increased supplementary feeding and water and fertiliser (particularly nitrogen (N)) inputs.
The two most important aspects to grazing management are grazing interval (rotation length or when to graze) and grazing intensity (post-grazing residual). In practice, the number of days between consecutive grazing events, pasture height, or pasture mass are generally used to schedule grazing intervals on farm. However, Fulkerson and Donaghy (2001) identified that using day rotations to schedule grazing events fails to consider seasonal variation in weather, which affects pasture growth. Pasture height and pasture mass, while reflecting weather conditions, are animal-related indicators for grazing and do not take into consideration plant-based factors that influence when a pasture is physiologically ready for grazing. Scheduling grazing interval based on leaf regrowth stage considers the recovery of plants in terms of energy reserves as well as pasture growth rates and nutritive value
(Fulkerson and Donaghy 2001). Perennial ryegrass pastures achieve their maximum growth rates between the 2-leaf and 3-leaf stage of regrowth (Rawnsley et al. 2014). Daughter tiller formation occurs between the 1-leaf and 2-leaf stages of regrowth, while the maximum accumulation of plant energy reserves occurs around the 3-leaf stage (Fulkerson and Donaghy 2001). It is now widely accepted that repeatedly grazing a perennial ryegrass pasture prior to the 2-leaf stage reduces plant persistence and overall yield, while allowing pasture to grow beyond the 3-leaf regrowth stage reduces nutritive value, with no additional benefit on yield or persistence (Rawnsley et al. 2007). Consequently, it is well established that perennial ryegrass pasture should be grazed between the 2-leaf and 3-leaf stages to optimise yield, nutritive value and persistence (Fulkerson and Donaghy 2001; MacDonald et al. 2010).
Grazing intensity is best conceptualised by the height, mass or leaf area of pasture remaining after grazing (Brougham 1960; Korte et al. 1982). While grazing to a target leaf area might result in a good outcome in terms of pasture growth, this practice is difficult to implement beyond single plants. Target residual pasture mass is often used within grazing systems (Eastwood and Kenny 2009), however, residual height is often quoted in the
literature because it is easy to control in an experimental context (Lee et al. 2008; Brink et al. 2013). Since perennial ryegrass stores the majority of energy reserves in the bottom 40 mm of the tiller, grazing to below this height can limit energy storage capacity and reduce regrowth and persistence (Fulkerson and Donaghy 2001). On the other hand, grazing much above 50 to 60 mm means that herbage is not fully utilised (Lee et al. 2008). Perennial ryegrass exhibits phenotypic plasticity (changes in growth habit) in response to repeated low or high post-grazing heights. Grazing studies in Ireland using high or low stocking rates (analogues to low and high post grazing defoliation heights) have identified changes in the proportion of leaf and stem in ryegrass swards (O'Donovan and Delaby 2005). Such adaptation by the plant limits its growth potential (Lee et al. 2008) by reducing the radiation use efficiency of the canopy, through increasing shading of new photosynthetically-efficient leaves by older leaves, or increasing the amount of light intercepted by the tiller base rather than leaf.
While defoliation interval and defoliation intensity, as along with fertiliser use and irrigation management have been studied in isolation (e.g. Lee et al. 2008; Rawnsley et al. 2009; Pembleton et al. 2013), there is a paucity of information regarding how they interact to influence pasture growth, nutritive value and persistence. Such knowledge is important to fine tune best-practice pasture management guidelines as the dairy industry increases its use of irrigation and N fertiliser to drive pasture production and maintain its cost competitiveness.
Past research has highlighted that there is only a slight decline in pasture nutritive value as perennial ryegrass progresses from the 1-leaf stage to the 3-leaf stage of regrowth (Turner et al. 2006), with nutritive value decreasing thereafter as leaves senesce and stem accumulates (Hunt 1965; Davies 1971). However, nutritive value can decline at any regrowth stage if canopy closure occurs, due to shading inducing stem formation and leaf death (Rawnsley et al. 2007) along with the relatively poorer nutritional value of stem and pseudostem compared to leaf (Beecher et al. 2015). There are indications that under higher levels of inputs (N and water) that typify modern dairy pasture management, pastures are 80
more likely to reach canopy closure early in the regrowth cycle, and this is associated with an earlier decline in nutritive value (McKenzie et al. 2003).
We have previously reported how the interactions between input use (irrigation and N), defoliation interval (as determined by leaf regrowth stage), and defoliation intensity (defined by height) affected the yield and growth rates of perennial ryegrass over a 2-year period (Rawnsley et al. 2014). From this it was concluded that to achieve maximum growth, perennial ryegrass should be grazed at the 3-leaf stage unless conditions were conducive to high (>60 kg dry matter (DM)/ha/day) pasture growth rates (achieved in spring or under high levels of N fertiliser use; Rawnsley et al. 2014). In these situations, perennial ryegrass should be grazed between the 2-leaf and 3-leaf regrowth stages. To maximise pasture production, perennial ryegrass should always be grazed to a target post-grazing height of around 50 mm irrespective of conditions. In this paper we report on how these interactions affect the nutritive value of pasture over a two year period and discuss grazing management in relation to optimising both pasture growth and nutritive value.
Methods Site description
The experiment was undertaken at the Dairy Research Facility of the Tasmanian Institute of Agriculture at Elliott in North West Tasmania (-41.093o, 145.780o, 155 m a.s.l.). At this
facility the soil is a deep clay loam red ferrosol (Isbell 1996) and the pre-experiment soil test indicated a baseline soil chemical fertility of 16.0 mg phosphorus (P)/kg (Olsen extraction) 293 mg potassium (K)/kg (Colwell extraction) and 12.6 mg sulfur (S)/kg (potassium chloride extraction) along with a pH(water) of 6.3. The climate at this location is classified as ‘temperate
moist’ with a winter dominant rainfall pattern under the Köppen climate classification system (Kelleher 1994). Prior to the experiment, the site was an established perennial ryegrass (cv. Impact) pasture that was periodically grazed with dairy heifers and non-lactating dairy cows. Treatments and experimental design
The experiment investigated the response of rainfed and irrigated perennial ryegrass defoliated at the 1-leaf, 2-leaf or 3-leaf stages of regrowth (the average number of days between defoliations, the average growth rate and the average pasture yield for each treatment in autumn, winter, spring and summer are provided in Table 1 and Table 2) to 112
heights of 30, 55 or 80 mm and receiving 0, 1.5 or 3 kg/ha/day of N fertiliser (applied retrospectively after each defoliation). The experiment was arranged as a split-split plot design. Plot dimensions were 3 × 2 m and were replicated three times. For each season there were a total of 162 plots within the three blocks. Each block consisted of two main plots (irrigation-rainfed) each of which contained three subplots (defoliation interval). Each subplot consisted of 9 plots to which the defoliation height and fertiliser treatments were randomly assigned. Irrigated and rainfed main plots were separated by a 12 m buffer area of perennial ryegrass. Defoliation interval and height subplots were separated by a 1 m buffer of perennial ryegrass. All buffer areas were regularly defoliated (every two to three weeks) and the cut material removed.
Agronomic practices
The field site was sprayed with RoundUp (360 g/L, glyphosate, Nufarm Australia Ltd. Laverton North, Vic, Australia) at a rate of 6 L/ha on 19 August 2009. Fourteen days after spraying, the site was power harrowed and then perennial ryegrass (cv. Arrow; heading date of +10 days relative to cv. Nui) was immediately sown at 25 kg/ha with an air seeder drill (Amazone drill, AMAZONEN-Werke H, Dreyer GmbH & Co., Hasbergen, Germany). The plots were established in the weeks following sowing and the site was fenced to exclude livestock. All plots were defoliated with a rotary mower (Brigs and Stratton) to a 55 mm height four times (8 December 2009 and 6 January, 2 February, and 1 March, 2010). Following the first defoliation, 241.5 kg P/ha and 11.5 kg S/ha was applied by hand to each plot in the form of triple superphosphate (21% P, 1% S). After the fourth defoliation, the irrigation, defoliation and N fertiliser treatments commenced. Nitrogen fertiliser treatments were applied by hand, in the form of urea (46% N) to the plots on the same day as they were defoliated.
Irrigation treatments were applied through a pressurised irrigation system consisting of 32 micro sprinklers (MP 200-360 rotator, Hunter Industries Inc. San Macros, CA, USA) arranged on a 4 × 4 m grid pattern in the irrigated main plots. With the use of pressure regulators, this system achieved a distribution uniformity greater than 80% with a delivery rate of 5 mm/hour. Irrigation water was applied on a 20 mm rainfall deficit, calculated from estimated evapotranspiration and rainfall. Rainfall was measured at the experimental site. Estimated evapotranspiration was calculated by the FAO 56 method (Allen et al. 1998) using 143
weather data collected at the experimental site. In total, 180 and 380 mm of irrigation water were applied in the 2010/11 and 2011/12 irrigation seasons, respectively (Table 3).
Soil tests (to a depth of 75 mm) across the experimental site occurred in July 2010 (28.7 mg P/kg Olsen extraction and 138 mg K/kg Colwell extraction) and March 2011 (26.3 mg P/kg Olsen extraction and 268 mg K/kg Colwell extraction). Based on these results, the plots received 52.5 kg P/ha and 500 kg K/ha in August 2010 and 52.5 kg P/ha and 250 kg K/ha in September 2011. These fertilisers were applied in the form of triple superphosphate along with muriate of potash (50% K).
Plots were harvested with a rotary mower when the perennial ryegrass plants reached their assigned defoliation interval treatment. The leaf regrowth stage of each main plot by subplot treatment was assessed twice weekly by sampling 30 random tillers per treatment. Sample collection
Samples were collected from the harvested material from each plot in spring 2010 (November), winter 2011 (June/July), summer 2011/12 (December) and autumn 2012 (April). Samplings occurred when each defoliation treatment was harvested and occurred over a maximum length of 21 days (shorter during periods of rapid pasture growth and leaf emergence) for each period of sampling. Approximately 200 g of fresh herbage material was collected from each plot and dried at 60oC for 48 hours in a fan-forced drying oven. Dried
herbage samples were ground to pass through a 1 mm screen and then stored in sealed bags while awaiting analysis of nutritive value.
Nutritive value analysis
All herbage samples were analysed by the DairyOne Forage Laboratory (Ithaca, New York, USA). Nitrogen concentration was determined via Kjeldahl digestion followed by titration (Thiex et al. 2002). Crude protein (CP) was calculated by multiplying N concentration by 6.25. The neutral detergent fibre (NDF) and acid detergent fibre (ADF) concentrations were determined using the methods outlined in van Soest et al. (1991) and AOAC (1990).
Metabolisable energy (ME) at three times maintenance intake was calculated using the National Research Council 2001 energy model for dairy cattle (National Research Council 2001). These calculations required acid detergent insoluble crude protein (ADICP) and neutral detergent insoluble crude protein (NDICP) to be estimated from CP and NDF using the following equations (P. Sirois (DairyOne) pers. comm. February 2014):
ADICP% DM = CP% DM × 0.07
NDICP% DM = (CP% DM × 0.33) + (NDF% DM × 0.143) – 8.77
In the calculation of ME, standard values for ryegrass forage of 4.4, 7.8 and 2.6% DM were used for fat, ash and lignin concentrations, respectively. These values were based on the DairyOne forage database (available online at http://dairyone.com/analytical-services/feed-and-forage/feed-composition-library/; Accessed: February 2014).
Statistical analysis
Data from each sampling event were analysed separately. All analysis was conducted using R (R Core Team 2015) assuming a split-split design in which sub-subplots contained a completely random design. Post-hoc comparisons were calculated using least significant differences (LSDs). Effects were regarded as significant at the 0.05 level, except where otherwise indicated. Residuals from the analyses were examined using quantile-quantile plots to assess outcome data for normality and homogeneity. No data required transformation prior to analysis.
Results
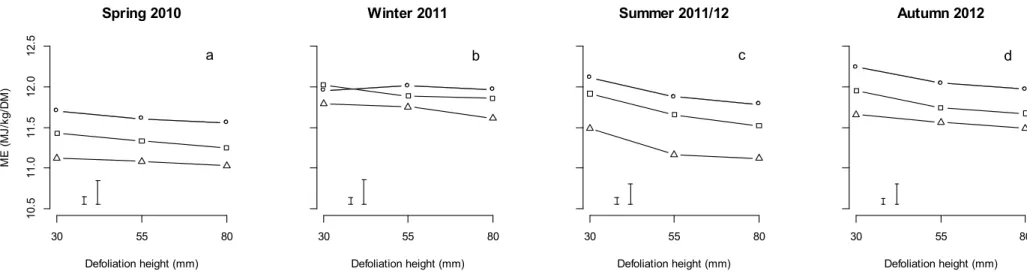
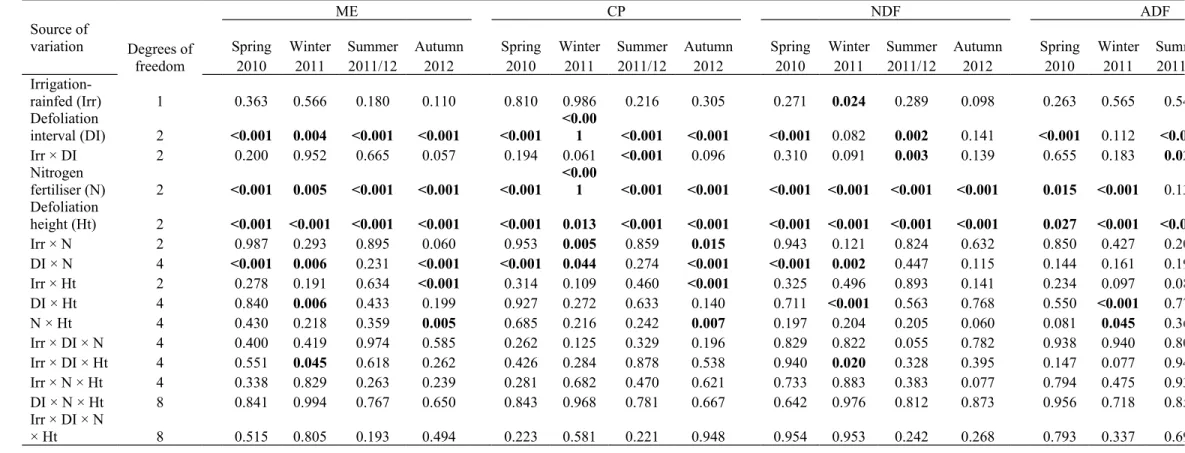
At each sampling event, there were significant effects of N fertiliser rate (P < 0.01) and defoliation interval (P < 0.01) on herbage ME concentration (Table 4). For spring 2010, winter 2011 and autumn 2012 assessments, these factors interacted (P < 0.001, 0.01 and 0.001, respectively). There was a trend for ME concentration to decrease with increasing defoliation interval, although the maximum difference in ME between the 1-leaf stage and the 3-leaf stage treatments was 0.8 MJ /kg DM (Fig. 1). In spring 2010, the ME concentration of swards that were defoliated at the 1-leaf stage of regrowth was greater than those defoliated at the 2-leaf and 3-leaf stages. While the swards defoliated at the 2-leaf stage had greater ME concentrations than those defoliated at the 3-leaf stage when zero N was applied, when 1.5 or 3 kg N/ha/day was applied, there was no difference in the ME concentration. For the zero N fertiliser treatment there was no difference in ME concentration observed between defoliation interval treatments in winter 2011. In summer 2011/2012, the ME concentration of plots defoliated at the 3-leaf stage was lower than the other defoliation interval treatments,
irrespective of N fertiliser treatment. In autumn 2012, the ME concentration was not affected 205
by N fertiliser application rate when plots were defoliated at the 1-leaf stage, but in the swards defoliated at the 2- or 3- leaf stage was lower with the application of 1.5 kg N/ha/day.
There was a significant effect (P < 0.001) of defoliation height at each sampling (Table 4), with a trend for ME to decrease slightly with higher defoliation heights across all defoliation interval treatments at the spring 2010, summer 2011/12 and autumn 2012
samplings (Fig 2). At the winter 2011 sampling, the swards defoliated at the 1-leaf stage did not show a decrease in ME concentration as defoliation height was increased. The average decrease in ME concentration with defoliation height did not exceed 0.7 MJ /kg DM.
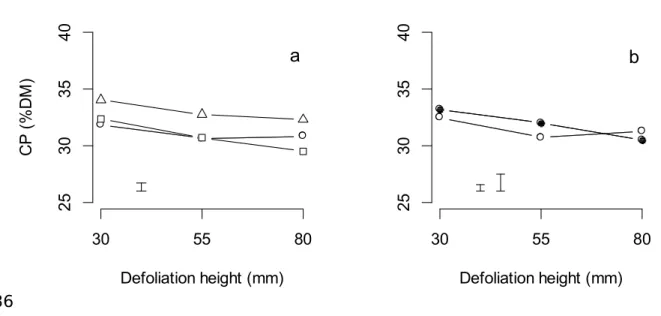
Leaf regrowth stage and N fertiliser rate both influenced pasture CP concentration (P < 0.001 and P < 0.001, respectively; Table 4), with CP concentration increasing under more frequent defoliation (especially the 1-leaf stage) at all sampling events (Fig. 3). Crude protein concentration generally increased with increasing N applications in spring and winter. In summer 2011/12 (for all defoliation interval treatments) and autumn 2012 (for the 2-leaf and 3-leaf stage defoliation interval treatments), CP concentrations initially declined as N fertiliser application rate increased from 0 to 1.5 kg N/ha/day, and then increased as N fertiliser application rate further increased to 3.0 kg N/ha/day. In all seasons, the CP
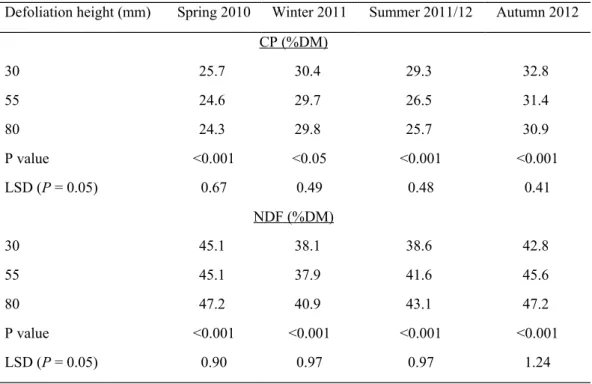
concentration of plots decreased as defoliation height increased from 30 mm to 55 mm (Table 5). In summer 2011/12 and autumn 2012 there was a further decline when defoliation height increased from 55 to 80 mm. However, these decreases were relatively small with the greatest decline of 3.6% DM observed for the summer 2011/12 sampling (Table 5).
In autumn 2012, defoliation height interacted with N fertiliser treatment and also with irrigation treatment (P < 0.01 and P < 0.001, respectively) to influence CP concentration (Table 4). At the 55 or 80 mm defoliation heights, plots receiving 3 kg N/ha/day had
between 1.5 to 2.1% DM greater CP concentration compared to those plots receiving 0 or 1.5 kg N/ha/day (Fig. 4a). Under irrigation, CP concentration decreased as defoliation height increased from 30 to 55 to 80 mm (Fig. 4b). Under rainfed conditions, the CP concentration decreased between the 30 and 55 mm defoliation height treatments but did not differ between the 55 and 80 mm defoliation heights.
In summer 2011/12, CP concentration decreased as defoliation interval increased (Table 6). Under rainfed conditions, this decrease was more apparent between the 2- and 3-leaf stage intervals compared to the 1- and 2-3-leaf stage intervals. .
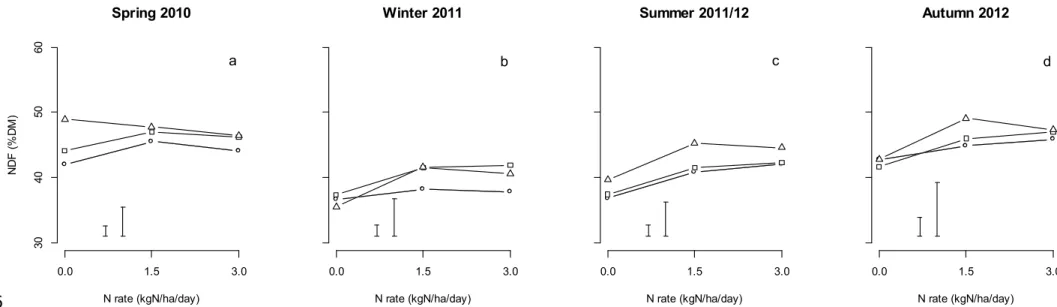
Apart from swards that received zero N fertiliser and were defoliated at the 3-leaf stage of regrowth in spring or the swards that were defoliated a the 1-leaf stage in winter, swards that received zero N fertiliser had a lower NDF concentration than those receiving either 1.5 or 3.0 kg N/ha/day N fertiliser (Fig. 5). However, there was no difference in NDF between the swards that received either 1.5 or 3.0 kg N/ha/day. When zero N fertiliser was applied there were only minimal (<3% of DM) differences in NDF between the defoliation interval treatments.
The NDF concentration was lower at the 30 mm defoliation height compared to the 80 mm defoliation height (Table 5). In winter and spring, the NDF concentration for swards defoliated to a height of 55 mm were not significantly different to swards defoliated to a height of 30 mm. In summer and autumn the NDF concentration of swards defoliated to a height of 55 mm was intermediate to those defoliated to either 30 or 80 mm, and significantly different to both.
In winter 2011, NDF concentration was influenced by a three way interaction (P < 0.05) between irrigation, defoliation height and defoliation interval treatments (Table 4). Under rainfed conditions there was no impact of defoliation height on NDF concentration when the pastures were defoliated at the 1-leaf or 2-leaf stages of regrowth. However, when defoliated at the 3-leaf stage, the NDF concentration increased as defoliation height was raised from 30 to 80 mm (Fig. 6). Under irrigation, there was no difference in NDF concentration between the defoliation interval treatments when defoliated to a height of 30 mm, but when defoliated to a height of either 55 or 80 mm, the swards defoliated at the 2-leaf stage had a greater NDF concentration than those defoliated at the 1-leaf stage. When the irrigated swards were defoliated to a height of 80 mm, those defoliated at the 3-leaf stages had a greater NDF concentration compared to those defoliated at the 1-leaf stage.
In summer 2011/12, NDF concentration was affected by an interaction (P < 0.01) between irrigation and defoliation interval treatment (Table 4). While NDF concentration increased as defoliation interval increased from the 1- to 3-leaf stage under both irrigated and rainfed conditions, the pattern of increase was different (Table 6). Under rainfed conditions, the NDF concentration for plots defoliated at the 2 and 3 leaf stage interval were not
significantly different. In contrast under irrigation the NDF concentration for plots defoliated at the 2-leaf stage were lower than those defoliated at either the 1- or 3- leaf regrowth stage. 266
The ADF concentration was affected (P < 0.001) by the defoliation interval treatment in spring 2010 (Table 4) with the 1-leaf stage resulting in a lower ADF concentration
compared with the 3-leaf stage (Table 7). Defoliation height also influenced ADF
concentration in spring 2010 (P < 0.05) and summer 2011/12 (P < 0.001; Table 4). In spring 2010 the swards defoliated to 55 mm had a lower ADF concentration than those defoliated to 80 mm. In summer 2011/12 the swards defoliated to 30 mm had a lower ADF concentration compared with those defoliated to 55 or 80 mm. The ADF concentration in summer 2011/12 was affected by an interaction (P < 0.05) between irrigation treatment and defoliation interval (Table 6). The ADF concentration increased by 2.5% DM between the 2- and 3-leaf
regrowth stage under both rainfed and irrigated conditions and by 2.3% DM and 1.0% DM between the 1- and 2-leaf regrowth stages under rainfed and irrigated conditions,
respectively.
In winter 2011 defoliation height interacted with defoliation interval (P < 0.001) and N fertiliser treatment (P < 0.05) to affect ADF concentration (Table 4). When swards were defoliated to 30 mm there was no difference in the ADF concentration between the
defoliation interval treatments, with an average of 21.7% DM (Fig. 7a). At the 1-leaf regrowth stage the swards defoliated to 80 mm defoliation height had the same ADF
concentrations as those defoliated to 55 mm while for those defoliated at the 2-leaf and 3-leaf stages the ADF concentration increased as defoliation height increased from 55 to 80 mm. There was no effect of N fertiliser application on the ADF concentration of swards defoliated to 30 mm (Fig. 7b). However, at 55 or 80 mm defoliation height the swards that received zero N fertiliser had lower ADF concentrations than the swards that received 1.5 kg
N/ha/day. When the swards were defoliated to 80 mm the ADF concentration was reduced by 1.6% DM under the zero N fertiliser treatment compared with the 3 kg N/ha/day
treatment.
Discussion
Overall the differences in key nutritive value parameters between treatments were relatively small. This was unexpected, considering the variation between some of the treatments (e.g. 0 vs 3.0 kg N/ha/day of N fertiliser applied or defoliated at the 1-leaf vs 3-leaf regrowth stage). While greater differences for ME, NDF and ADF may have been observed under more extreme treatments, the treatment combinations in our experiment reflect a wide range of 297
pasture practices applied within pasture based dairy systems in temperate Australia and New Zealand. This indicates that the potential gains to be made in pasture nutritive value through a refinement of well-established best management grazing practices will be incremental rather than transformative. Consequently, grazing management of dairy pastures should be prioritised to optimise yield and persistence, with nutritive value only considered when larger effects are observed (i.e. in summer).
Across all the treatments, the CP concentration was in excess of what is required for high levels of milk production (National Research Council 2001). Excess CP (>17% DM for high producing cows, National Research Council 2001) in the diet is metabolised into
ammonium in the rumen, then converted to urea in the liver, and excreted in the urine. This has two consequences within pasture-based dairy systems. First, the process requires energy to be expended (Oldham 1984) (between 0.035 and 0.050 MJ/g N; National Research
Council 2001), reducing the amount of energy available for milk production, and second, it leads to an increase in urinary N output which increases N losses to the environment (either through leaching, volatilisation or de-nitrification from urine patches) (Dijkstra et al. 2013; Pacheco and Waghorn 2008). These consequences decrease the N use efficiency of dairy systems (de Klein and Ledgard 2001; Eckard et al. 2004). By far the greatest influence on CP concentration that we observed was the leaf regrowth stage at defoliation. In this study the pastures defoliated at the 3-leaf regrowth stage maintained the lowest CP concentration at all samplings, between 14.5 and 31.5% DM. Allowing pastures to complete their regrowth cycle (for ryegrass, to the 3-leaf stage) not only positively impacts on pasture yield and persistence (Fulkerson and Donaghy 2001), but should help reduce excess CP intake, and maintain a desirable WSC:CP ratio (Turner et al. 2014). Therefore, grazing rotation is a powerful tool in pasture-based dairy systems, to reduce N lost to the environment.
Across the experiment, the greatest impact on pasture ME was defoliation interval, as determined by the leaf regrowth stage. We observed a general decline in pasture ME
concentration and an increase in NDF concentration as defoliation interval was extended from the 1-leaf to the 2-leaf then to the 3-leaf stage, which is consistent with previous findings (Fulkerson and Donaghy 2001; Turner et al. 2006). For the summer sampling we also observed some evidence of a decrease in ME concentration as N fertiliser increased or defoliation height was increased. Interestingly, these declines occurred irrespective of the leaf regrowth stage for all but one of the sampling events. Potentially the increase in plant size driven by the higher N fertiliser applications increased the relative proportion of stem 329
and pseudostem and hence increasing the structural (cellulose, hemicellulose and lignin) components of the plant (Beecher et al. 2015). In winter, the ME concentration of swards defoliated at the 3-leaf stage decreased with increased N fertiliser. However, this did not occur for the swards defoliated at the 1- or 2-leaf stage. During spring, increasing N application rate arrested both the decline in ME concentration and the increase in NDF concentration with increasing defoliation interval. This seems counter-intuitive as higher rates of N fertiliser use during periods of rapid growth should increase the prevalence of canopy closure. However, the N deficit stress under the zero N fertiliser treatments during this period of rapid growth (Rawnsley et al. 2014), coupled with the longer defoliation interval of the 3-leaf stage defoliation treatment, would have enhanced the onset of reproductive development (and hence stem growth) in this treatment, leading to higher concentrations of fibre and a concomitant lower ME concentration.
Defoliation height had a relatively consistent impact on the nutritive value of the pasture over the experiment, with pastures defoliated to 80 mm having lower CP, greater fibre, and lower ME concentrations than the pastures defoliated to 30 mm. Interestingly, there were often only minimal differences in the NDF concentration between the plants defoliated at 30 mm and 55 mm. Under grazing O'Donovan and Delaby (2005) found only a small (but statistically significant) effect from different grazing intensities on the NDF concentrations across a number of ryegrass cultivars. Lee et al. (2008) identified a similar result for perennial ryegrass pastures defoliated across five different defoliation heights that ranged from 20 mm to 100 mm. These authors concluded that a post-grazing height of between 40 and 80 mm should be targeted to optimise nutritive value and production. Our results suggest that this recommendation could be refined to a target post-grazing pasture height of around 55 mm, although the authors recognise the practical difficulty of
consistently achieving this target on-farm. While for one season there was an interaction between leaf regrowth stage and defoliation height, this effect only influenced the relative ME difference between the different defoliation heights.
Irrigation influenced the CP, NDF and ADF concentrations in the pasture during summer. However, this impact was mediated by the leaf regrowth stage at which the pastures were defoliated. For the rainfed pastures NDF and ADF concentrations tended to increase between the 1-leaf and 2-leaf regrowth stages, while for the irrigated pastures this nutritive value decline occurred between the 2-leaf and 3-leaf stages. Despite these different patterns of decline, there were minimal differences in the CP, NDF and ADF concentrations between 362
irrigated and rainfed pastures at the 3-leaf regrowth stage. The environment our experiment was undertaken in may be partly responsible for such a result, with an average annual rainfall of 1200 mm and above average summer rainfall received for the duration of the experiment. Greater differences in nutritive value between dryland and fully irrigated pastures were observed by Jensen et al. (2003) in a drier environment (470 mm annual rainfall).
In our previous paper (Rawnsley et al. 2014) we showed that defoliating at the 1-leaf and 2-leaf regrowth stages resulted in 25% and 6% lower yields, respectively, compared with defoliating at the 3-leaf stage. We have also shown a decreases in perennial ryegrass
persistence associated with such management (Turner et al. 2013). The results presented from the present paper show that there is little justification to modify the recommendations made by Rawnsley et al. (2014) with regard to the grazing management required to maximise perennial ryegrass productivity (i.e. defoliated between the 2- and 3-leaf regrowth stage to a height of 55 mm), when considering nutritive value. While the nutritive value (in terms of ME) of perennial ryegrass could be marginally increased by defoliating at an earlier leaf stage and to a lower height, the negative consequences to pasture productivity do not justify the small gain in nutritive value. Such practices will also result in an excess CP concentration in the cow’s diet with negative consequences to production and the environment.
Acknowledgments
The authors gratefully acknowledge the financial support provided by Dairy Australia Ltd. and the technical support provided by Mr Peter Chamberlain.
References
Allen, RG, Pereira, LS, Raes, D, Smith, M (1998) 'Crop evapotranspiration - Guidelines for computing crop water requirements - FAO Irrigation and drainage paper 56.' (Food and Agriculture Organization of the United Nations: Rome)
AOAC (1990) Fiber (Acid Detergent) and Lignin in Animal Feed. (973.18) In 'Official Methods of Analysis 15 Edition.' (Association of Official Analytical Chemists: Gaithersburg)
Beecher, M, Hennessy, D, Boland, TM, McEvoy, M, O'Donovan, M, Lewis, E (2015) The variation in morphology of perennial ryegrass cultivars throughout the grazing season and effects on organic matter digestibility. Grass and Forage Science 70, 19-29. Brink, G, Jackson, R, Alber, N (2013) Residual sward height effects on growth and nutritive
value of grazed temperate perennial grasses. Crop Science 53, 2264-2274.
Brougham, R (1960) The effects of frequent hard grazings at different times of the year on the productivity and species yields of a grass-clover pasture. New Zealand Journal of Agricultural Research 3, 125-136
Chapman, DF, Cullen, BR, Johnson, IR, Beca, D (2009) Interannual variation in pasture growth rate in Australian and New Zealand dairy regions and its consequences for system management. Animal Production Science 49, 1071-1079.
Davies, A (1971) Changes in growth rate and morphology of perennial ryegrass swards at high and low nitrogen levels. Journal of Agricultural Science 77, 123-134.
de Klein, CAM, Ledgard, SF (2001) An analysis of environmental and economic
implications of nil and restricted grazing systems designed to reduce nitrate leaching from New Zealand dairy farms. I. Nitrogen losses. New Zealand Journal of
Agricultural Research 44, 201-215.
Doyle, PT, Stockdale, CR, Lawson, AW, Cohen, DC (2000) 'Pastures for dairy production in Victoria.' (Department of Natural Resources and Environment: Kyabram, Victoria.) Dijkstra, J, Oenema, O, Van Groenigen, J, Spek, J, Van Vuuren, A, Bannink, A (2013) Diet
effects on urine composition of cattle and N 2 O emissions. Animal 7, 292-302. Eastwood, C, Kenny, S (2009) Art or Science?: Heuristic versus Data Driven Grazing
Management on Dairy Farms. Extension Farming Systems Journal 5, 95-102.
Eckard, RJ, Chapman, DF, White, RE, Chen, D (2004) The environmental impact of nitrogen fertiliser use on dairy pastures. Australian Journal of Dairy Technology 59, 145-148. Fulkerson, WJ, Donaghy, DJ (2001) Plant-soluble carbohydrate reserves and senescence -
key criteria for developing an effective grazing management system for ryegrass-based pastures: a review. Australian Journal of Experimental Agriculture 41, 261-275.
Graham, J, Prance, T, Thompson, R, Borg, D, Ball, P, Filsell, P (2000) The effects of grazing management on perennial ryegrass (Lolium perenne L.) herbage mass and persistence in south-eastern Australia. Australian Journal of Experimental Agriculture 40, 207-224. Holmes, CW (2007) The challenge for pasture-based dairying: learning from the
unrecognised systems experts, good farmers. In 'Dairy Science 2007, Meeting the Challenges for Pasture-Based Dairying, Proceedings of the 3rd Dairy Science Symposium. The University of Melbourne'. (Eds DF Chapman, DA Clark, KL Macmillan, DP Nation) pp. 11-34. (University of Melbourne: Melbourne)
Hunt, L (1965) Some implications of death and decay in pasture production. Grass and Forage Science 20, 27-31.
Isbell, RF (2002) 'The Australian soil classification' (CSIRO Publishing: Collingwood) Jensen, KB, Waldron, BL, Asay, KH, Johnson, DA, Monaco, TA (2003) Forage nutritional
characteristics of orchardgrass and perennial ryegrass at five irrigation levels. Agronomy Journal 95, 668-675.
Kelleher, FM (1994) Climate and Crop Distribution. In 'Principles of Field Crop Production.' (Ed. JE Pratley.) pp. 26-117. (Oxford University Press: Melbourne)
Korte, C, Watkin, B, Harris, W (1982) Use of residual leaf area index and light interception as criteria for spring-grazing management of a ryegrass-dominant pasture. New Zealand Journal of Agricultural Research 25, 309-319.
Lee, J, Donaghy, D, Roche, J (2008) Effect of defoliation severity on regrowth and nutritive value of perennial ryegrass dominant swards. Agronomy Journal 100, 308-314. Lee, JM, Matthew, C, Thom, ER, Chapman, DF (2012) Perennial ryegrass breeding in New
Zealand: a dairy industry perspective. Crop & Pasture Science 63, 107-127. National Research Council (2001) 'Nutrient Requirements of Dairy Cattle, 7th Revised
Edition.' (National Academy Press: Washington, D.C.)
Macdonald, KA, Glassey, CB, Rawnsley, RP (2010) 'The emergence, development and effectiveness of decision rules for pasture based dairy systems, Meeting the challenges of pasture-based dairying, Proceedings of the 4th Australasian Dairy Science
Symposium.' Lincoln University Christchurch, New Zealand. (Eds GR Edwards, RH Bryant) pp. 199-209. (Lincoln University: Lincoln, New Zealand)
McKenzie, FR, Jacobs, JL, Kearney, G (2003) Long-term effects of multiple applications of nitrogen fertiliser on grazed dryland perennial ryegrass/white clover dairy pastures in south-west Victoria. 3. Botanical composition, nutritive characteristics, mineral content, and nutrient selection Australian Journal of Agricultural Research 54, 477-485.
O'Donovan, M, Delaby, L (2005) A comparison of perennial ryegrass cultivars differing in heading date and grass ploidy with spring calving dairy cows grazed at two different stocking rates. Animal Research 54, 337-350.
Oldham, JD (1984) Protein-energy interrelationships in dairy cows. Journal of Dairy Science 67, 1090-1114.
Pacheco, D, Waghorn, G (2008) 'Dietary nitrogen–definitions, digestion, excretion and consequences of excess for grazing ruminants, Proceedings of the New Zealand Grassland Association 70, 107-116.
Pembleton, KG, Rawnsley, RP, Burkitt, LL (2013) Environmental influences on optimum nitrogen fertiliser rates for temperate dairy pastures. European Journal of Agronomy 45, 132-141.
R Core Team (2015). R: A language and environment for statistical computing. R Foundation for Statistical Computing, Vienna, Austria. URL, https://www.R-project.org/.
Rawnsley, RP, Cullen, BR, Turner, LR, Donaghy, DJ, Freeman, M, Christie, KM (2009) Potential of deficit irrigation to increase marginal irrigation response of perennial ryegrass (Lolium perenne L.) on Tasmanian dairy farms. Crop & Pasture Science 60, 1156-1164.
Rawnsley, RP, Langworthy, AD, Pembleton, KG, Turner, LR, Corkrey, R, Donaghy, D (2014) Quantifying the interactions between grazing interval, grazing intensity, and nitrogen on the yield and growth rate of dryland and irrigated perennial ryegrass. Crop & Pasture Science 65, 735-746.
Rawnsley, RP, Donaghy, DJ, Stevens, DR (2007) What is limiting production and
consumption of perennial ryegrass in temperate dairy regions of Australia and New Zealand? In 'Dairy Science 2007, Meeting the Challenges for Pasture-Based Dairying, Proceedings of the 3rd Dairy Science Symposium. Melbourne'. (Eds DF Chapman, DA Clark, KL Macmillan, DP Nation) pp. 256-276.
Thiex, NJ, Manson, H, Anderson, S, Persson, JA (2002) Determination of Crude Protein in Animal Feed, Forage, Grain, and Oilseeds by Using Block Digestion with a Copper Catalyst and Steam Distillation into Boric Acid: Collaborative Study. Journal of AOAC INTERNATIONAL 85, 309-317.
Turner, LR, Donaghy, DJ, Lane, PA, Rawnsley, RP (2006) Effect of defoliation management, based on leaf stage, on perennial ryegrass (Lolium perenne L.), prairie grass (Bromus willdenowii Kunth.) and cocksfoot (Dactylis glomerata L.) under dryland conditions. 2. Nutritive value. Grass and Forage Science 61, 175-181.
Turner, LR, Donaghy, DJ, Pembleton, KG, Rawnsley, RP (2013) Effect of nitrogen fertiliser applications on botanical composition. In 'Revitalising grasslands to sustain our
communities: Proceedings of the 22nd International Grassland Congress. Sydney', 15-19 September 2013. (Eds DL Michalk, GD Millar, WB Badgery, KM Broadfoot) pp. 1513 - 1514. (New South Wales Department of Primary Industries).
Turner, LR, Donaghy, DJ, Pembleton, KG, Rawnsley, RP (2015) Longer defoliation interval ensures expression of the ‘high sugar’ trait in perennial ryegrass cultivars in cool temperate Tasmania, Australia, Journal of Agricultural Science 153, 995-1005. van Soest, PJ, Robertson, JB, Lewis, BA (1991) Methods of dietary fiber, neutral detergent
fiber, and nonstarch polysaccharides in relation to animal nutrition. Journal of Dairy Science 74, 3583-3597.
List of figures
Fig. 1. The estimated metabolisable energy (ME) concentration (MJ/ kgDM) of perennial ryegrass pastures defoliated at the 1-leaf (○), 2-leaf (□) or 3-leaf (∆) stages of regrowth when receiving nitrogen (N) fertiliser application rates of either 0, 1.5 or 3 kg N/ha/day. On each panel the left error bar represents the LSD (P = 0.05) for comparisons within the defoliation interval treatments, and the right error bar represents the LSD (P = 0.05) for the comparisons between the defoliation interval treatments.
Fig. 2. The estimated metabolisable energy (ME) concentration (MJ/ kgDM) of perennial ryegrass pastures defoliated at the 1-leaf (○), 2-leaf (□) or 3-leaf (∆) stages of regrowth when defoliated to a height of 30, 55 or 80 mm. On each panel the left error bar represents the LSD (P = 0.05) for comparisons within the defoliation interval treatments, and the right error bar represents the LSD (P = 0.05) for the comparisons between the defoliation interval
treatments.
Fig. 3. The crude protein (CP) concentration (%DM) of perennial ryegrass pastures defoliated at the 1-leaf (○), 2-leaf (□) or 3-leaf (∆) stages of regrowth when receiving nitrogen (N) fertiliser application rates of either 0, 1.5 or 3 kg N/ha/day. On each panel the left error bar represents the LSD (P = 0.05) for comparisons within the defoliation interval treatments, and the right error bar represents the LSD (P = 0.05) for the comparisons between the defoliation interval treatments.
Fig. 4. The crude protein (CP) concentration (%DM) of perennial ryegrass pastures during autumn 2012 when defoliated to heights of 30, 55 or 80 mm and receiving 0, (○), 1.5 (□) or 3.0 (∆) kg N/ha/day (panel a) or grown under rainfed (○) or irrigated (●) conditions (panel b). On panel a, the error bar represents the LSD (P = 0.05). On panel b, the left error bar
represents the LSD (P = 0.05) for comparisons within irrigation treatments and the right error bar represents the LSD (P = 0.05) for comparisons between irrigation treatments.
Fig. 5. The neutral detergent fibre (NDF) concentration (%DM) of perennial ryegrass pastures defoliated at the 1-leaf (○), 2-leaf (□) or 3-leaf (∆) stages of regrowth when
receiving nitrogen (N) fertiliser application rates of either 0, 1.5 or 3 kg N/ha/day. On each 532
panel the left error bar represents the LSD (P = 0.05) for comparisons within the defoliation interval treatments, and the right error bar represents the LSD (P = 0.05) for the comparisons between the defoliation interval treatments.
Fig. 6. The neutral detergent fibre (NDF) concentration (%DM) of perennial ryegrass pastures during winter 2011 when grown under rainfed (○) or irrigated (●) conditions and defoliated at the 1-leaf (○), 2-leaf (□) or 3-leaf (∆) leaf regrowth stages and defoliated to heights of 30, 55 or 80 mm. The left error bar represents the LSD (P = 0.05) for comparisons within the irrigation and defoliation interval treatments, the centre error bar represents the LSD (P = 0.05) for comparisons within the irrigation and defoliation heights treatments and the right error bar represents the LSD (P = 0.05) for the comparisons within the defoliation intervals and defoliation height treatments.
Fig. 7. The acid detergent fibre (ADF) concentration (%DM) of perennial ryegrass pastures during winter 2011, when defoliated to a height of 30, 55 or 80 mm and defoliated at the 1-leaf (○), 2-1-leaf (□) or 3-1-leaf (∆) 1-leaf stages of regrowth (panel a) or receiving nitrogen fertiliser application rates of either 0 (●), 1.5 (■) or 3 (▲) kg N/ha/day (panel b). The left error bar on panel a represents the LSD (P = 0.05) for comparison between defoliation heights within each leaf stage defoliation interval and the right error bar represents the LSD (P = 0.05) for the comparisons between each leaf stage defoliation interval. The error bar on panel b represents the LSD (P = 0.05) for comparison between the nitrogen and defoliation height treatments.
List of Tables
Table 1. The average number of days between each leaf stage defoliation in autumn, winter, spring and summer.
Table 2. The average growth rate (kgDM/ha/day) and pasture yield (above defoliation height; kgDM/ha) of each treatment (Dryland and Irrigated, defoliated at leaf stage 1, 2 or 3,
defoliated to 30, 55 or 80 mm height, and receiving 0, 1.5 or 3.0 kg N/ha/day) in autumn, winter, spring and summer.
Table 3. The rainfall (mm) received and the irrigation (mm) applied to the irrigated treatment over the 2010/11 and 2011/12 irrigation seasons.
Table 4. Summary of the P values from the ANOVA of the nutritive value parameters of Metabolisable energy (ME), Crude protein (CP), Neutral detergent fibre (NDF) and Acid detergent fibre (ADF) from each sampling event. Significant effects are in bold for clarity.
Table 5. The crude protein (CP) and neutral detergent fibre (NDF) concentration (%DM) of perennial ryegrass pastures when defoliated to heights of 30, 55 or 80 mm.
Table 6. The crude protein (CP) neutral detergent fibre (NDF) and acid detergent fibre (ADF) concentration (%DM) of perennial ryegrass pastures in summer 2011/12 when grown under irrigated or rainfed conditions and defoliated at the 1-, 2- or 3-leaf stage of regrowth (defoliation interval).
Table 7. The effect of irrigation treatment, defoliation interval, defoliation height and nitrogen (N) fertiliser application rate on the acid detergent fibre (ADF) concentration (%DM) of perennial ryegrass pastures.
Spring 2010
N rate (kgN/ha/day)
M
E
(
M
J/
kg
/D
M
)
0.0 1.5 3.0
10
.5
11
.0
11
.5
12
.0
12
.5
a
Winter 2011
N rate (kgN/ha/day)
0.0 1.5 3.0
b
Summer 2011/12
N rate (kgN/ha/day)
0.0 1.5 3.0
c
Autumn 2012
N rate (kgN/ha/day)
0.0 1.5 3.0
d
Fig. 1. The estimated metabolisable energy (ME) concentration (MJ/ kgDM) of perennial ryegrass pastures defoliated at the 1-leaf (○), 2-leaf (□) or 3-leaf (∆) stages of regrowth when receiving nitrogen (N) fertiliser application rates of either 0, 1.5 or 3 kg N/ha/day. On each panel the left error bar represents the LSD (P = 0.05) for comparisons within the defoliation interval treatments, and the right error bar represents the LSD (P = 0.05) for the comparisons between the defoliation interval treatments.
611
Spring 2010
Defoliation height (mm)
M
E
(
M
J/
kg
/D
M
)
30 55 80
10
.5
11
.0
11
.5
12
.0
12
.5
a
Winter 2011
Defoliation height (mm)
30 55 80
b
Summer 2011/12
Defoliation height (mm)
30 55 80
c
Autumn 2012
Defoliation height (mm)
30 55 80
d
Fig. 2. The estimated metabolisable energy (ME) concentration (MJ/ kgDM) of perennial ryegrass pastures defoliated at the 1-leaf (○), 2-leaf (□) or 3-leaf (∆) stages of regrowth when defoliated to a height of 30, 55 or 80 mm. On each panel the left error bar represents the LSD (P = 0.05) for comparisons within the defoliation interval treatments, and the right error bar represents the LSD (P = 0.05) for the comparisons between the defoliation interval treatments.
618 619
Spring 2010
N rate (kgN/ha/day)
C
P
(
%
D
M
)
0.0 1.5 3.0
10
20
30
40 a
Winter 2011
N rate (kgN/ha/day)
0.0 1.5 3.0
b
Summer 2011/12
N rate (kgN/ha/day)
0.0 1.5 3.0
c
Autumn 2012
N rate (kgN/ha/day)
0.0 1.5 3.0
d
Fig. 3. The crude protein (CP) concentration (%DM) of perennial ryegrass pastures defoliated at the 1-leaf (○), 2-leaf (□) or 3-leaf (∆) stages of regrowth when receiving nitrogen (N) fertiliser application rates of either 0, 1.5 or 3 kg N/ha/day. On each panel the left error bar represents the LSD (P = 0.05) for comparisons within the defoliation interval treatments, and the right error bar represents the LSD (P = 0.05) for the
comparisons between the defoliation interval treatments. 626
627 628 629
Defoliation height (mm)
C
P
(
%
D
M
)
30 55 80
25
30
35
40
a
Defoliation height (mm)
30 55 80
25
30
35
40
b
Fig. 4. The crude protein (CP) concentration (%DM) of perennial ryegrass pastures during autumn 2012 when defoliated to heights of 30, 55 or 80 mm and receiving 0, (○), 1.5 (□) or 3.0 (∆) kg N/ha/day (panel a) or grown under rainfed (○) or irrigated (●) conditions (panel b). On panel a, the error bar represents the LSD (P = 0.05). On panel b, the left error bar
represents the LSD (P = 0.05) for comparisons within irrigation treatments and the right error bar represents the LSD (P = 0.05) for comparisons between irrigation treatments.
635
Spring 2010
N rate (kgN/ha/day)
N
D
F
(
%
D
M
)
0.0 1.5 3.0
30
40
50
60
a
Winter 2011
N rate (kgN/ha/day)
0.0 1.5 3.0
b
Summer 2011/12
N rate (kgN/ha/day)
0.0 1.5 3.0
c
Autumn 2012
N rate (kgN/ha/day)
0.0 1.5 3.0
d
Fig. 5. The neutral detergent fibre (NDF) concentration (%DM) of perennial ryegrass pastures defoliated at the 1-leaf (○), 2-leaf (□) or 3-leaf (∆) stages of regrowth when receiving nitrogen (N) fertiliser application rates of either 0, 1.5 or 3 kg N/ha/day. On each panel the left error bar represents the LSD (P = 0.05) for comparisons within the defoliation interval treatments, and the right error bar represents the LSD (P = 0.05) for the comparisons between the defoliation interval treatments.
643 644 645
Irrigated
Defoliation height (mm)
N
D
F
(
%
D
M
)
30 55 80
30
35
40
45
50
a
Rainfed
Defoliation height (mm)
30 55 80
b
Fig. 6. The neutral detergent fibre (NDF) concentration (%DM) of perennial ryegrass pastures during winter 2011 when grown under rainfed (○) or irrigated (●) conditions and defoliated at the 1-leaf (○), 2-leaf (□) or 3-leaf (∆) leaf regrowth stages and defoliated to heights of 30, 55 or 80 mm. The left error bar represents the LSD (P = 0.05) for comparisons within the irrigation and defoliation interval treatments, the centre error bar represents the LSD (P = 0.05) for comparisons within the irrigation and defoliation heights treatments and the right error bar represents the LSD (P = 0.05) for the comparisons within the defoliation intervals and defoliation height treatments.
653
Defoliation height (mm)
A
D
F
(
%
D
M
)
30 55 80
10
15
20
25
30 a
Defoliation height (mm)
30 55 80
b
Fig . 7. The acid detergent fibre (ADF) concentration (%DM) of perennial ryegrass pastures during winter 2011, when defoliated to a height of 30, 55 or 80 mm and defoliated at the 1-leaf (○), 2-1-leaf (□) or 3-1-leaf (∆) 1-leaf stages of regrowth (panel a) or receiving nitrogen fertiliser application rates of either 0 (●), 1.5 (■) or 3 (▲) kg N/ha/day (panel b). The left error bar on panel a represents the LSD (P = 0.05) for comparison between defoliation heights within each leaf stage defoliation interval and the right error bar represents the LSD (P = 0.05) for the comparisons between each leaf stage defoliation interval. The error bar on panel b represents the LSD (P = 0.05) for comparison between the nitrogen and defoliation height treatments.
664
Table 1. The average number of days between each leaf stage defoliation in autumn, winter, spring and summer.
Rainfed Irrigated
1 leaf stage 2 leaf stage 3 leaf stage 1 leaf stage 2 leaf stage 3 leaf stage
Autumn 17.0 27.5 38.8 15.6 25.3 36.8
Winter 21.0 36.7 55.5 20.6 36.7 55.5
Spring 13.0 20.0 35.3 13.0 20.0 35.3
Summer 11.1 21.8 30.3 11.1 20.6 30.3
676 677
Table 2. The rainfall (mm) received and the irrigation (mm) applied to the irrigated treatment over the 2010/11 and 2011/12 irrigation seasons.
Month 2009/10 2010/11 2011/12
Rainfall
(mm) Rainfall (mm) Irrigation (mm) Rainfall(mm) Irrigation(mm)
July . 110 0 169 0
August 289 195 0 193 0
September 129 164 0 85 0
October 69 97 0 102 40
November 74 120 20 150 40
December 37 174 20 50 100
January 5.8 269 80 67 80
February 65 81 40 74 60
March 98 73 20 167 40
April 103 78 0 98 20
May 68 32 0 123 0
June 103 129 0 134 0
Total 1040.8 1522 180 1412 380
679 680
Table 3. Summary of the P values from the ANOVA of the nutritive value parameters of Metabolisable energy (ME), Crude protein (CP), Neutral detergent fibre (NDF) and Acid detergent fibre (ADF) from each sampling event. Significant effects are in bold for clarity.
Source of
variation Degrees of freedom
ME CP NDF ADF
Spring Winter Summer Autumn Spring Winter Summer Autumn Spring Winter Summer Autumn Spring Winter Summer
2010 2011 2011/12 2012 2010 2011 2011/12 2012 2010 2011 2011/12 2012 2010 2011 2011/12
Irrigation-rainfed (Irr) 1 0.363 0.566 0.180 0.110 0.810 0.986 0.216 0.305 0.271 0.024 0.289 0.098 0.263 0.565 0.542
Defoliation
interval (DI) 2 <0.001 0.004 <0.001 <0.001 <0.001
<0.00
1 <0.001 <0.001 <0.001 0.082 0.002 0.141 <0.001 0.112 <0.001
Irr × DI 2 0.200 0.952 0.665 0.057 0.194 0.061 <0.001 0.096 0.310 0.091 0.003 0.139 0.655 0.183 0.025
Nitrogen
fertiliser (N) 2 <0.001 0.005 <0.001 <0.001 <0.001 <0.001 <0.001 <0.001 <0.001 <0.001 <0.001 <0.001 0.015 <0.001 0.130 Defoliation
height (Ht) 2 <0.001 <0.001 <0.001 <0.001 <0.001 0.013 <0.001 <0.001 <0.001 <0.001 <0.001 <0.001 0.027 <0.001 <0.001
Irr × N 2 0.987 0.293 0.895 0.060 0.953 0.005 0.859 0.015 0.943 0.121 0.824 0.632 0.850 0.427 0.204
DI × N 4 <0.001 0.006 0.231 <0.001 <0.001 0.044 0.274 <0.001 <0.001 0.002 0.447 0.115 0.144 0.161 0.192
Irr × Ht 2 0.278 0.191 0.634 <0.001 0.314 0.109 0.460 <0.001 0.325 0.496 0.893 0.141 0.234 0.097 0.087
DI × Ht 4 0.840 0.006 0.433 0.199 0.927 0.272 0.633 0.140 0.711 <0.001 0.563 0.768 0.550 <0.001 0.777
N × Ht 4 0.430 0.218 0.359 0.005 0.685 0.216 0.242 0.007 0.197 0.204 0.205 0.060 0.081 0.045 0.365
Irr × DI × N 4 0.400 0.419 0.974 0.585 0.262 0.125 0.329 0.196 0.829 0.822 0.055 0.782 0.938 0.940 0.802
Irr × DI × Ht 4 0.551 0.045 0.618 0.262 0.426 0.284 0.878 0.538 0.940 0.020 0.328 0.395 0.147 0.077 0.949
Irr × N × Ht 4 0.338 0.829 0.263 0.239 0.281 0.682 0.470 0.621 0.733 0.883 0.383 0.077 0.794 0.475 0.931
DI × N × Ht 8 0.841 0.994 0.767 0.650 0.843 0.968 0.781 0.667 0.642 0.976 0.812 0.873 0.956 0.718 0.854
Irr × DI × N
× Ht 8 0.515 0.805 0.193 0.494 0.223 0.581 0.221 0.948 0.954 0.953 0.242 0.268 0.793 0.337 0.699
Table 4. The crude protein (CP) and neutral detergent fibre (NDF) concentration (%DM) of perennial ryegrass pastures when defoliated to heights of 30, 55 or 80 mm.
Defoliation height (mm) Spring 2010 Winter 2011 Summer 2011/12 Autumn 2012
CP (%DM)
30 25.7 30.4 29.3 32.8
55 24.6 29.7 26.5 31.4
80 24.3 29.8 25.7 30.9
P value <0.001 <0.05 <0.001 <0.001
LSD (P = 0.05) 0.67 0.49 0.48 0.41
NDF (%DM)
30 45.1 38.1 38.6 42.8
55 45.1 37.9 41.6 45.6
80 47.2 40.9 43.1 47.2
P value <0.001 <0.001 <0.001 <0.001
LSD (P = 0.05) 0.90 0.97 0.97 1.24
688 689
Table 5. The crude protein (CP) neutral detergent fibre (NDF) and acid detergent fibre (ADF) concentration (%DM) of perennial ryegrass pastures in summer 2011/12 when grown under irrigated or rainfed conditions and defoliated at the 1-, 2- or 3-leaf stage of regrowth (defoliation interval).
Irrigation treatment
1-leaf stage
2-leaf stage
3-leaf stage
P value (Irr × defoliation interval)
ALSD
(P = 0.05)
BLSD
(P = 0.05)
CP(%DM)
Rainfed 29.8 28.3 21.9 <0.001 0.89 2.08
Irrigated 32.5 27.6 23.2
NDF (%DM)
Rainfed 38.8 42.6 43.1 <0.01 2.11 2.43
Irrigated 40.9 38.0 43.1
ADF (%DM)
Rainfed 19.4 21.7 24.2 <0.05 0.73 2.55
Irrigated 19.7 20.7 23.1
AWithin irrigation treatments
BBetween irrigation treatments 692
693 694 695
Table 6. The effect of defoliation interval, defoliation height and nitrogen (N) fertiliser application rate on the acid detergent fibre (ADF) concentration (%DM) of perennial ryegrass pastures.
Spring 2010 Winter 2011 Summer 2011/12 Autumn 2012
Defoliation interval
1-leaf 23.3 20.3 19.5 21.8
2-leaf 25.4 21.3 21.2 22.5
3-leaf 26.4 21.6 23.7 24.1
P value <0.001 NS <0.001 <0.05
LSD (P = 0.05) 3.08 . 1.54 4.11
Defoliation height (mm)
30 24.9 21.7 20.4 22.3
55 24.6 19.8 21.5 22.9
80 25.7 21.7 22.4 23.2
P value <0.05 <0.001 <0.001 NS
LSD (P = 0.05) 0.82 0.74 0.93 .
N fertiliser application rate (kg N/ha/day)
0.0 25.4 20.0 21.0 22.6
1.5 25.4 21.8 21.9 23.1
3.0 24.3 21.4 21.5 22.7
P value <0.05 <0.001 NS NS
LSD (P = 0.05) 0.82 0.74 . .
699 700 701