Transactions of the 17th International Conference on
Structural Mechanics in Reactor Technology (SMiRT 17) Prague, Czech Republic, August 17 –22, 2003
Paper # K09-1
A Development Program of Three-Dimensional Seismic Isolation for Advanced
Reactor Systems in Japan
Asao Kato1), Satoshi Moro1), Masaki Morishita2), Takafumi Fujita3), Saburoh Midorikawa4)
1) The Japan Atomic Power Company, Tokyo, Japan
2) O-arai Engineering Center, Japan Nuclear Cycle Development Institute, Ibaraki, Japan 3) Institute of Industrial Science, University of Tokyo, Tokyo, Japan
4) Tokyo Institute of technology, Yokohama, Kanagawa, Japan
ABSTRACT
Two types of three-dimensional seismic isolation systems were developed one by one. As for the 3 dimensional entire building base isolation system, development was conducted by collecting concepts. The vertically isolated for main components with horizontally entire building base isolation system was developed by referring the bored cone dish spring technology.
In this R&D project, several tests would be conducted and some technical standards would be completed for about a decade.
KEY WORDS: FBR, development program, seismic isolation system, seismic design condition, damping ratio, response
analysis, isolation system analysis, floor response spectra
INTRODUCTION
The peculiar FBR design features compare with Light Water Reactor (LWR) are high temperature and low pressure in components. High temperature of FBR gives large thermal strain in components. Therefore applying thinner component can reduce the stress intensity. However, in the design for seismic loads, generally, thin component could not be realized, because such a thin component could not resist intensive seismic loads. At this point, the component design has a contradiction in choosing thickness for component. That is, the thickness must be thinner for thermal loads, must be thicker for seismic loads at the same time.
This very point was the reason for the seismic isolation technology was intended to introduce to FBR design, which enables not only to mitigate the seismic design condition and realize the thinner components, but also to enhance the structural integrity of the components and reactor building. In the R&D for the demonstration FBR, conducted from 1987 to 1997, horizontal seismic isolation technology was mainly developed. After the R&D was completed with the publication of the design guideline for the horizontal seismic isolation system [1], economical competency was strictly closed up than before. In such a situation, component design has challenged to realize thinner components. The only obstacle to the challenge was to mitigate the seismic load in vertical direction in the horizontal seismic isolation system, and the innovation and application of three-dimensional seismic isolation technology were required to solve the problem. On this background, ‘A large Scale R&D Project on Three-Dimensional Seismic Isolation for FBR’ (this R&D) started on April in 2000. This paper shows the development method of this R&D project, setting up the seismic condition, setting up the seismic design feasibility evaluation criteria for components and building, and the outline and results of the seismic response analyses of the component and building in order to get proper properties of the three-dimensional seismic isolation systems. Meanwhile, the analyses were conducted giving varieties in vertical properties under constant horizontal base isolation property, because the vertical seismic isolation properties were the key factors to be determined for the three-dimensional seismic isolation technology. The proper vertical seismic isolation properties are shown as the combinations of frequencies and damping ratios of the seismic isolation devices, and they are set as the target of this R&D.
R&D PROJECT OVERVIEW
Three-Dimensional Seismic Isolation System Concept
Two types of three-dimensional seismic isolation systems were selected appropriate for FBR in this R&D project through the viewpoints of realization and economic competency. One is a three-dimensional Seismic Isolation System (3D SIS), the other is a vertical isolation of main components with horizontal base Isolation System (V. +2D SIS), which are schematically shown in Figure 1. In the 3D SIS, 3D Seismic Isolation Devices (SID) support the reactor building as shown in Figure 1(a). In the V. +2D SIS, 2D SID support a building, furthermore, verticalSID support a Common Deck that supports main components such as the reactor vessel (RV) and the pumps, as shown in Figure 1(b).
3D Seismic Isolation System Development Method
In case of applying the 3D SIS to FBR, component layout has no need to change itself from that is appropriate to the horizontal seismic isolation system. This is a great advantage for plant design. However, it had the assignment to develop the 3D SID. While the device was required to exhibit three-dimensional seismic isolation functions, there was no such a peculiar device when the project started. Consequently, this 3D SIS was developed by the method of collecting ideas from major private companies involved in the FBR development activities in Japan.
Figure 1 Three-Dimensional Seismic Isolation Systems
: 3D Seismic Isolation Devices(b) V. +2D Seismic Isolation System
(a) 3D Seismic IsolationSystem
: 2D Seismic Isolation Devices : Vertical Seismic Isolation Devices : Common Deck
V. +2D Seismic Isolation System Development Method
In case of applying the V. +2D SIS, the component layout has to be changed a little for installing the common deck in primary sodium circuit system. However, when this system was adopted, the assignment would be limited to realize the bored cone dish spring for the vertical isolation system supporting main components. The dish spring was selected as the vertical isolation device for its efficiency in design, layout, maintenance and economic competency. Since the dish spring technology was basically developed for smaller diameter spring, realization of larger size and confirmation of through plant life reliability on its performance could be major items of the assignment. So, the R&D on the applicability of the dish spring could be completed in a relatively short period.
As the development items, several experiments were planned to grasp the basic properties of the spring and to confirm the applicability of the current design formula to the larger size dish springs. Those experiments would be carried out using the large-size specimens to exclude the scale effect like a friction behavior from test results.
TARGET SEISMIC CONDITION
At the first step of this R&D project, seismic design condition had to be settled. Meanwhile, as the condition could be applied to examine the ultimate behavior of the seismic isolation system, the seismic condition was set as ‘S2’ defined in Japan, which was the extreme design earthquake that was in a sense equivalent to SSE. Considering those factors, the horizontal seismic spectrum that was applied to the past R&D [2] for the horizontal seismic isolation system was quoted and settled as the seismic condition for this R&D. The spectrum had been made enveloping the design spectra in several Nuclear Power Plant (abbreviated NPP) sites in Japan and keeping the velocity spectrum constant in the longer period range.
The seismic condition was defined as ‘Case Study S2 for the 3D seismic isolation development’, or abbreviated Case Study S2
(further abbreviated CSS2). On this project, the SID was to be developed adding some redundancy in its capacity.
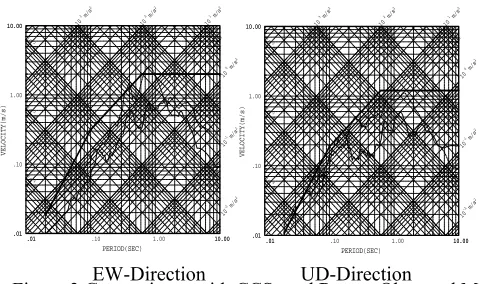
CSS2 for both in horizontal and vertical directions are shown in Figure 2. In the figure, horizontal velocity spectrum reaches 2.0
m/s in the period between 0.62 and 10.0 sec, vertical spectrum reaches 1.2m/s, damping ratio 0.05 is used. The ratio, vertical to horizontal, was to be 0.6, was settled considering the experience of the past.
CSS2 was compared with a couple of response spectra of recent observed earthquake motions, Kobe Japan 1995[3], Kocaeli
Turkey 1999[4] and Chi-Chi Republic of China 1999[5].
Observed motions were recorded at ground surface level and no correction was done. So, there was a difference in condition between CSS2 and observed earthquake motions because CSS2 was defined at the bedrock. Representative comparison results are
shown in Figure 3•5. Data in Figure 5 were collected from the records on relatively hard rock. From these figures, the spectra of the observed earthquake motion records are almost enveloped by the CSS2. In the comparison with Chi-Chi, it should be noted
that the spectra exceeded CSS2 in longer periods were based on the motions recorded in the vicinity or on the faults. Case Case
EW-Direction UD-Direction
Figure 3 Comparisons with CCS and Recent Observed Motions 2
(Kobe Japan, 1995)
.01 .10 1.00 10.00
.01 10.00
.01 .10 1.00 10.00
.01 10.00
10 -4
m 10 -3
m 10 -2
m 10 -1
m 10
0
m 10
1
m
10 3m/s
2
10 2m/s
2
10 1m/s
2
10 0m/s
2
10 -1m/s
2
10 -2m/s
2
PERIOD(SEC)
V
E
L
O
C
I
T
Y
(
m
/
s
)
Study S2(h=5%) KBUUD00(h=5%) JMAKBUD(h=5%)
.01 .10 1.00 10.00
.01 10.00
.01 .10 1.00 10.00
.01 10.00
10 -4
m 10 -3
m 10 -2
m 10 -1
m 10 0
m 10 1
m
10 3m/s
2
10 2m/s
2
10 1m/s
2
10 0m/s
2
10 -1m/s
2
10 -2m/s
2
PERIOD(SEC)
V
E
L
O
C
I
T
Y
(
m
/
s
)
Study S2(h=5%) KBUEW00(EW,h=5%) JMAKBEW(EW,h=5%)
0 . 0 1 0 . 1 1 1 0
P e r i o d is j
1 0 0 0 m / s 2 1 0 0 m / s 2 1 0 m / s 2
1 m / s 2
1 m
0 . 1 m / s 2
0 . 0 1 m / s 2 0 . 1 m
0 . 0 1 m
0 . 0 0 1 m / s 2 0 . 0 0 0 0 1 m 0 . 0 0 0 1 m 0 . 0 0 1 m
A c c e l e r a t i o n im / s 2 j
0 . 0 0 1 m / s 0 . 0 1 m / s 0 . 1 m / s 1 m / s 1 0 m / s
NS-Direction UD-Direction /s
2
0 -3 m
(
m
/
s
.01 .10 1.00 10.00
.01 10.00
.01 .10 1.00 10.00
.01 10.00
10 -4 m 10 -3 m 10 -2 m
10 -1 m
10 0 m
10 1 m 10
3m/s
2
10
2m/s
2
10
1m/s
2
10
0m/s
2
10
-1m
10
-2m/s
2
PERIOD(SEC)
V
E
L
O
C
I
T
Y
(
m
/
s
)
Case Study S2(h=5%) ARC_NS(NS,h=5%) ATS_NS(NS,h=5%) BTS_NS(NS,h=5%) BUR_NS(NS,h=5%) CNA_NS(NS,h=5%) DHM_NS(NS,h=5%) FAT_NS(NS,h=5%) HAS_NS(NS,h=5%) YKP_NS(NS,h=5%) YPT_NS(NS,h=5%)
.01 .10 1.00 10.00
.01 10.00
.01 .10 1.00 10.00
.01 10.00
10 -4 m 1 10 -2
m 10 -1
m 10 0
m 10 1
m 10
3m/s
2
10
2m/s
2
10
1m/s
2
10
0m/s
2
10
-1m/s
2
10
-2m/s
2
PERIOD(SEC)
V
E
L
O
C
I
T
Y
)
Case Study S2(h=5%) ARC_UD(UD,h=5%) ATS_UD(UD,h=5%) BTS_UD(UD,h=5%) BUR_UD(UD,h=5%) CNA_UD(UD,h=5%) DHM_UD(UD,h=5%) FAT_UD(UD,h=5%) HAS_UD(UD,h=5%) YKP_UD(UD,h=5%) YPT_UD(UD,h=5%)
Figure 4 Comparisons with CCS and Recent Figure5 Comparisons with CCS and Recent 0.01
0.10 1.00 10.00
0.01 0.10 1.00 10.00
CHY014-UD TCU089-UD TCU067-UD TCU072-UD TCU065-UD TCU079-UD TCU076-UD TCU071-UD TCU052-UD TCU078-UD CASE STUDY S2-UD
PSEUD
O VELOCITY (m/s
)
PERIOD (sec)
2 2
o
bserved Motions (Kocaeli Turkey,
1999) Observed Motions (Chi-chi Republic of China, 1999)When the building and component response analyses were conducted, simulated ground motions were prepared based on CSS2
spectra as input data. Horizontal and vertical simulated ground motions are shown in Figure 6. The maximum accelerations of input motions are 8.31m/s2 in horizontal, 5.56m/s2 in vertical respectively.
Horizontal Direction Vertical Direction
Figure 6 Simulated Ground Motions
SEISMIC RESPONSE ANALYSIS
Analysis Method and Model
The main objective of conducting seismic response analyses is to identify the values of vertical frequencies and damping ratios fit for the three-dimensional seismic isolation devices. They are evaluated by comparing the analysis response values with the seismic design feasibility evaluation criteria.
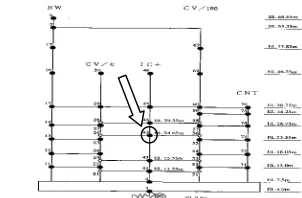
The building seismic response analyses were conducted as a nonlinear response analysis both in horizontal and vertical directions by applying the simulated ground motions to the analysis model of the representative NPP building. Analysis model of the building in vertical and horizontal directions are shown in Figures 7,8 respectively. The SID are shown as an axial spring in Figure 7, as a combination of sway and rocking springs in Figure 8. Building structures were properly modeled as a lumped-mass model based on the experiences of the past.Total mass of the building model was estimated as about 170000t. Figure 9 shows the modeling concept of the building analysis model.
While the vertical soil spring is modeled in Figure 7 for its stiffness is comparable with that of the SID, horizontal soil spring is not modeled in Figure 8 for its horizontal stiffness is much larger than that of the SID. Meanwhile, the vertical soil spring stiffness was set as a constant value based on the axial soil stress, soil material properties and configuration of the building, and the damping coefficient of the soil spring was set depends on the fundamental natural frequency of the building-seismic isolation device-soil system. Meanwhile, the soil property was assumed as a secondary velocity equivalent to 1500m/s. In these figures, the reactor vessel support point is shown as the node number 33 in Figure 7, number 43 in Figure8 respectively.
On the other hand, the component seismic analyses were conducted as a spectrum response analysis by applying the Floor Response Spectra (Abbreviated FRS) at the reactor vessel support point in the building analysis model to the reactor component analysis model. Reactor component analysis models in horizontal / rotational and vertical directions are shown in Figure 10. RV and inner structure were properly modeled as a lumped-mass model in horizontal / rotational directions or finite element model in vertical direction, based on the experiences of the past.
Horizontal/Rotational Direction Vertical Direction
Figure 9 Modeling Concept of the Building Analysis Model Figure 10 Reactor Component Analysis Model
(Horizontal Direction)
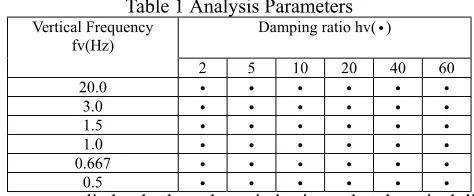
Analysis Parameters
Analysis parameters are shown in Table 1. As shown in the table, the vertical frequency is varied from 20.0 to 0.5Hz, vertical damping ratio is varied from 2 to 60%. In those values, 20Hz in vertical direction means no vertical seismic isolation device is installed, 0.5Hz is thought as the lowest seismic isolation device frequency that could be attained, 2% damping means no damper is installed. Parameters were specified having some margin. The damper possessing damping ratio greater than 40% is thought hard to realize. On the other hand, the 3D SID possessing vertical frequency less than 0.67Hz had been proposed in the ideas shown in ‘2.2.2 3D Seismic Isolation System Development Method’ in this paper.
Table 1 Analysis Parameters Damping ratio hv(•) Vertical Frequency
fv(Hz)
2 5 10 20 40 60
20.0 • • • • • •
3.0 • • • • • •
1.5 • • • • • •
1.0 • • • • • •
0.667 • • • • • •
0.5 • • • • • •
Parameters are applied to both analyses in horizontal and vertical directions.
Building Seismic Response Analysis Results
Eigen Value Analysis Results
Representative eigen value analysis results are shown as the participation functions in Figure 11 in horizontal direction, in Figure12 in vertical direction, respectively. In Figure 11, fundamental participation function shows the sway mode and second participation function shows little deformation in the case of fv=20Hz, which means this structure is seismically isolated only in horizontal direction. On the other hand, both fundamental and second participation functions show the rocking mode in the case of fv=0.667Hz, which shows this structure reduces the vertical stiffness and rocking mode is induced as a result.
In Figure 12, in the case of fv=20Hz, fundamental participation function shows the deformation mode like seismic resistance structure because the stiffness of seismic isolation system is equivalent to no vertical seismic isolation device is installed. And the fundamental natural frequency 9.37Hz is different from fv=20Hz because the soil spring stiffness governs this vibration system. On the other hand, in the case of fv=0.667Hz, fundamental participation function shows the deformation mode like rigid body and the fundamental natural frequency 0.667Hz equals the seismic isolation device frequency 0.67Hz because this vibration system is not governed by the soil springs but governed by the vertical seismic isolation devices.
0 1
c f v2 0 h v0 2 .
1 .0 9 5 1 .0 8 8 1 .0 8 8
1 .0 7 1 1 .0 7 1
1 .0 4 8 1 .0 4 8
1 .0 1 5 1 .0 1 5
1 .0 0 5 1 .0 0 5 0 .9 9 9 0 .9 9 9 0 .9 9 3 0 .9 9 3 0 .9 8 6 0 .9 8 6 0 .9 7 8
1 .0 2 9
1 .0 1 4 1 .0 1 4
1 .0 0 6 1 .0 1 4
1 .0 0 6 1 .0 0 6 1 .0 0 6 1 .0 0 6 1 .0 0 6 1 .0 0 6 1 .0 0 1 1 .0 0 6 1 .0 0 1 1 .0 0 1 0 .9 9 9 1 .0 0 1 0 .9 9 9 0 .9 9 9 0 .9 9 2 0 .9 9 9 0 .9 9 2 0 .9 9 2 0 .9 8 9 0 .9 9 2 0 .9 8 9 0 .9 8 9 0 .9 8 6 0 .9 8 9 0 .9 8 6 0 .9 8 6 0 .9 8 4 0 .9 8 6 0 .9 8 4 0 .9 8 4 0 .9 7 8 0 .9 8 4 0 .9 7 8
1 .0 3 5
1 .0 2 0 1 .0 2 0
1 .0 1 0 1 .0 2 0
1 .0 1 0 1 .0 1 0 1 .0 0 3 1 .0 1 0 1 .0 0 3 1 .0 0 3
0 .9 9 0 1 .0 0 3
0 .9 9 0 0 .9 9 0 0 .9 8 4 0 .9 9 0 0 .9 8 4 0 .9 8 4 0 .9 7 8 0 .9 8 4 0 .9 7 8 0 .9 7 8 0 .9 7 7
1 .0 8 8
1 .0 6 9 1 .0 6 9
1 .0 4 4 1 .0 4 4
1 .0 2 0 1 .0 2 0 1 .0 1 6 1 .0 2 0 1 .0 1 6 1 .0 1 6 1 .0 0 9 1 .0 1 6 1 .0 0 9 1 .0 0 9 1 .0 0 8 1 .0 0 9 1 .0 0 8 1 .0 0 8 1 .0 0 2 1 .0 0 8 1 .0 0 2 1 .0 0 2 1 .0 0 0 1 .0 0 2 1 .0 0 0 1 .0 0 0 0 .9 9 3 1 .0 0 0 0 .9 9 3 0 .9 9 3 0 .9 8 9 0 .9 9 3 0 .9 8 9 0 .9 8 9 0 .9 8 5 0 .9 8 9 0 .9 8 5 0 .9 8 5 0 .9 8 3 0 .9 8 5 0 .9 8 3 0 .9 8 3 0 .9 7 8 0 .9 8 3 0 .9 7 8
1 .0 1 8 1 .0 1 5 1 .0 1 5 1 .0 0 9 1 .0 0 9 1 .0 0 3 1 .0 0 3 0 .9 9 4 0 .9 9 4 0 .9 8 6 0 .9 8 6 0 .9 7 8 T 1 = 1. 0 1 1 f 1 = 0 . 9 9
B E TA = 1. 0 9 5 0 1
c f v2 0 h v0 2 .
- 0 .1 1 3 - 0 .1 0 2 - 0 .1 0 2
- 0 .0 7 9 - 0 .0 7 9
- 0 .0 4 4 - 0 .0 4 4
- 0 .0 0 3 - 0 .0 0 3
0 .0 0 3 0 .0 0 3 0 .0 0 5 0 .0 0 5 0 .0 0 7 0 .0 0 7 0 .0 0 9 0 .0 0 9 0 .0 0 9
- 0 .0 0 3
0 .0 0 0 0 .0 0 0
0 .0 0 3 0 .0 0 0
0 .0 0 3 0 .0 0 3 0 .0 0 3 0 .0 0 3 0 .0 0 3 0 .0 0 3 0 .0 0 5 0 .0 0 3 0 .0 0 5 0 .0 0 5 0 .0 0 5 0 .0 0 5 0 .0 0 5 0 .0 0 5 0 .0 0 7 0 .0 0 5 0 .0 0 7 0 .0 0 7 0 .0 0 8 0 .0 0 7 0 .0 0 8 0 .0 0 8 0 .0 0 8 0 .0 0 8 0 .0 0 8 0 .0 0 8 0 .0 0 9 0 .0 0 8 0 .0 0 9 0 .0 0 9 0 .0 0 9 0 .0 0 9 0 .0 0 9
- 0 .0 0 8
- 0 .0 0 2 - 0 .0 0 2
0 .0 0 2 - 0 .0 0 2
0 .0 0 2 0 .0 0 2 0 .0 0 5 0 .0 0 2 0 .0 0 5 0 .0 0 5
0 .0 0 8 0 .0 0 5
0 .0 0 8 0 .0 0 8 0 .0 0 9 0 .0 0 8 0 .0 0 9 0 .0 0 9 0 .0 0 9 0 .0 0 9 0 .0 0 9 0 .0 0 9 0 .0 1 0
- 0 .1 0 2
- 0 .0 7 5 - 0 .0 7 5
- 0 .0 3 8 - 0 .0 3 8
- 0 .0 0 9 - 0 .0 0 9 - 0 .0 0 6 - 0 .0 0 9 - 0 .0 0 6 - 0 .0 0 6 - 0 .0 0 1 - 0 .0 0 6 - 0 .0 0 1 - 0 .0 0 1 0 .0 0 0 - 0 .0 0 1 0 .0 0 0 0 .0 0 0 0 .0 0 3 0 .0 0 0 0 .0 0 3 0 .0 0 3 0 .0 0 4 0 .0 0 3 0 .0 0 4 0 .0 0 4 0 .0 0 7 0 .0 0 4 0 .0 0 7 0 .0 0 7 0 .0 0 8 0 .0 0 7 0 .0 0 8 0 .0 0 8 0 .0 0 9 0 .0 0 8 0 .0 0 9 0 .0 0 9 0 .0 0 9 0 .0 0 9 0 .0 0 9 0 .0 0 9 0 .0 0 9 0 .0 0 9 0 .0 0 9
- 0 .0 0 2 - 0 .0 0 1 - 0 .0 0 1 0 .0 0 2 0 .0 0 2 0 .0 0 4 0 .0 0 4 0 .0 0 7 0 .0 0 7 0 .0 0 8 0 .0 0 8 0 .0 0 9 T 2 = 0. 2 2 9 f 2 = 4 . 3 7 B E TA = - 0. 1 1 3
f v 2 0 H z
Figure 11(2/2) Representative Participation Functions (Building Model: Horizontal Direction (fv=0.667Hz))
Figure 12 (1/2)Representative Participation Functions
(Building Model: Vertical Direction (fv=20Hz))
0 1
1 . 5 8 9 1 . 5 0 7 1 . 5 0 7
1 . 3 3 0 1 . 3 3 0
1 . 1 0 3 1 . 1 0 3
0 . 8 3 0 0 . 8 3 0
0 . 6 4 4 0 . 6 4 4 0 . 5 2 2 0 . 5 2 2 0 . 3 9 4 0 . 3 9 4 0 . 2 7 6 0 . 2 7 6 0 . 1 4 8
1 . 0 9 9
0 . 8 3 0 0 . 8 3 0
0 . 6 5 8 0 . 8 3 0
0 . 6 5 8 0 . 6 5 8 0 . 6 4 4 0 . 6 5 8 0 . 6 4 4 0 . 6 4 4 0 . 5 4 8 0 . 6 4 4 0 . 5 4 8 0 . 5 4 8 0 . 5 2 3 0 . 5 4 8 0 . 5 2 3 0 . 5 2 3 0 . 3 9 4 0 . 5 2 3 0 . 3 9 4 0 . 3 9 4 0 . 3 3 6 0 . 3 9 4 0 . 3 3 6 0 . 3 3 6 0 . 2 7 6 0 . 3 3 6 0 . 2 7 6 0 . 2 7 6 0 . 2 4 3 0 . 2 7 6 0 . 2 4 3 0 . 2 4 3 0 . 1 4 8 0 . 2 4 3 0 . 1 4 8
1 . 1 0 1
0 . 8 3 1 0 . 8 3 1
0 . 6 5 8 0 . 8 3 1
0 . 6 5 8 0 . 6 5 8 0 . 5 4 8 0 . 6 5 8 0 . 5 4 8 0 . 5 4 8
0 . 3 3 6 0 . 5 4 8
0 . 3 3 6 0 . 3 3 6 0 . 2 4 3 0 . 3 3 6 0 . 2 4 3 0 . 2 4 3 0 . 1 4 8 0 . 2 4 3 0 . 1 4 8 0 . 1 4 8 0 . 0 6 7
1 . 5 0 7
1 . 3 2 9 1 . 3 2 9
1 . 1 0 2 1 . 1 0 2
0 . 8 3 1 0 . 8 3 1 0 . 7 7 3 0 . 8 3 1 0 . 7 7 3 0 . 7 7 3 0 . 6 5 8 0 . 7 7 3 0 . 6 5 8 0 . 6 5 8 0 . 6 4 4 0 . 6 5 8 0 . 6 4 4 0 . 6 4 4 0 . 5 4 8 0 . 6 4 4 0 . 5 4 8 0 . 5 4 8 0 . 5 2 3 0 . 5 4 8 0 . 5 2 3 0 . 5 2 3 0 . 3 9 4 0 . 5 2 3 0 . 3 9 4 0 . 3 9 4 0 . 3 3 6 0 . 3 9 4 0 . 3 3 6 0 . 3 3 6 0 . 2 7 6 0 . 3 3 6 0 . 2 7 6 0 . 2 7 6 0 . 2 4 3 0 . 2 7 6 0 . 2 4 3 0 . 2 4 3 0 . 1 4 8 0 . 2 4 3 0 . 1 4 8
0 . 8 3 1 0 . 7 7 2 0 . 7 7 2 0 . 6 4 4 0 . 6 4 4 0 . 5 2 3 0 . 5 2 3 0 . 3 9 4 0 . 3 9 4 0 . 2 7 7 0 . 2 7 7 0 . 1 4 8
B E T A = - 1 . 5 8 9 0 1
- 0 . 6 2 1 - 0 . 5 3 5 - 0 . 5 3 5
- 0 . 3 4 8 - 0 . 3 4 8
- 0 . 1 0 9 - 0 . 1 0 9
0 . 1 7 5 0 . 1 7 5
0 . 3 6 2 0 . 3 6 2 0 . 4 8 2 0 . 4 8 2 0 . 6 0 8 0 . 6 0 8 0 . 7 2 3 0 . 7 2 3 0 . 8 4 5
- 0 . 0 9 2
0 . 1 7 6 0 . 1 7 6
0 . 3 4 9 0 . 1 7 6
0 . 3 4 9 0 . 3 4 9 0 . 3 6 3 0 . 3 4 9 0 . 3 6 3 0 . 3 6 3 0 . 4 5 7 0 . 3 6 3 0 . 4 5 7 0 . 4 5 7 0 . 4 8 2 0 . 4 5 7 0 . 4 8 2 0 . 4 8 2 0 . 6 0 8 0 . 4 8 2 0 . 6 0 8 0 . 6 0 8 0 . 6 6 5 0 . 6 0 8 0 . 6 6 5 0 . 6 6 5 0 . 7 2 2 0 . 6 6 5 0 . 7 2 2 0 . 7 2 2 0 . 7 5 5 0 . 7 2 2 0 . 7 5 5 0 . 7 5 5 0 . 8 4 5 0 . 7 5 5 0 . 8 4 5
- 0 . 1 0 1
0 . 1 7 5 0 . 1 7 5
0 . 3 5 0 0 . 1 7 5
0 . 3 5 0 0 . 3 5 0 0 . 4 6 0 0 . 3 5 0 0 . 4 6 0 0 . 4 6 0
0 . 6 6 7 0 . 4 6 0
0 . 6 6 7 0 . 6 6 7 0 . 7 5 6 0 . 6 6 7 0 . 7 5 6 0 . 7 5 6 0 . 8 4 5 0 . 7 5 6 0 . 8 4 5 0 . 8 4 5 0 . 9 2 5
- 0 . 5 3 5
- 0 . 3 4 7 - 0 . 3 4 7
- 0 . 1 0 7 - 0 . 1 0 7
0 . 1 7 3 0 . 1 7 3 0 . 2 3 2 0 . 1 7 3 0 . 2 3 2 0 . 2 3 2 0 . 3 4 7 0 . 2 3 2 0 . 3 4 7 0 . 3 4 7 0 . 3 6 1 0 . 3 4 7 0 . 3 6 1 0 . 3 6 1 0 . 4 5 6 0 . 3 6 1 0 . 4 5 6 0 . 4 5 6 0 . 4 8 2 0 . 4 5 6 0 . 4 8 2 0 . 4 8 2 0 . 6 0 8 0 . 4 8 2 0 . 6 0 8 0 . 6 0 8 0 . 6 6 5 0 . 6 0 8 0 . 6 6 5 0 . 6 6 5 0 . 7 2 2 0 . 6 6 5 0 . 7 2 2 0 . 7 2 2 0 . 7 5 5 0 . 7 2 2 0 . 7 5 5 0 . 7 5 5 0 . 8 4 5 0 . 7 5 5 0 . 8 4 5
0 . 1 7 8 0 . 2 3 6 0 . 2 3 6 0 . 3 6 4 0 . 3 6 4 0 . 4 8 4 0 . 4 8 4 0 . 6 0 9 0 . 6 0 9 0 . 7 2 3 0 . 7 2 3 0 . 8 4 5 B E T A = - 0 . 9 2 5
f v 0 . 6 6 7 H z
EXCITING FUNCTION ..NO T= S f= Hz B= RB19 RB18 RB17 RB16 RB15 RB14 RB13 RB12 RB11 I/C IC35 IC34 IC33 IC32 IC31 IC04 IC03 IC02 IC01 FIX1 CV53 CV52 CV51 CV50 CV49 CV47 CV45 CV44 CV42 RE69 RE68 RE67 RE66 RE65 RE64 RE63 RE62 RE61 1 1.502 0.67 1.003 1.003 1.003 1.002 1.002 1.001 1.001 1.001 1.000 1.000 1.001 1.001 1.001 1.000 1.000 1.000 0.999 0.002 0.002 0.000 1.003 1.003 1.002 1.002 1.001 1.001 1.001 1.000 1.000 1.003 1.003 1.002 1.002 1.002 1.001 1.001 1.001 1.000 -1 0
EXCITING FUNCTION ..NO T= S f= Hz B= RB19 RB18 RB17 RB16 RB15 RB14 RB13 RB12 RB11 I/C IC35 IC34 IC33 IC32 IC31 IC04 IC03 IC02 IC01 FIX1 CV53 CV52 CV51 CV50 CV49 CV47 CV45 CV44 CV42 RE69 RE68 RE67 RE66 RE65 RE64 RE63 RE62 RE61 2 0.058 17.24 0.001 0.001 0.001 0.001 0.001 0.000 0.000 0.000 0.000 0.000 0.000 0.000 0.000 0.000 0.000 0.000 0.000 0.000 0.000 0.000 -0.001 -0.001 -0.000 -0.000 0.000 0.000 0.000 0.000 0.000 -0.001 -0.001 -0.001 -0.001 -0.000 -0.000 -0.000 -0.000 -0.000
-1 0 1 1
Figure 12 (2/2)Representative Participation Functions (Building Model: Vertical Direction (fv=0.667Hz))
•1=1.502 (•1=0.67),BETA=1. •1=0.058 (•1=17.24),BETA=0.001
EXCITING FUNCTION ..NO T= S f= Hz B= RB19 RB18 RB17 RB16 RB15 RB14 RB13 RB12 RB11 I/C IC35 IC34 IC33 IC32 IC31 IC04 IC03 IC02 IC01 FIX1 CV53 CV52 CV51 CV50 CV49 CV47 CV45 CV44 CV42 RE69 RE68 RE67 RE66 RE65 RE64 RE63 RE62 RE61 2 0.058 17.26 0.144 0.144 0.139 0.125 0.097 0.051 0.041 0.033 0.024 0.015 0.009 0.009 0.008 0.006 0.004 0.003 0.003 0.002 0.002 0.000 -0.066 -0.062 -0.049 -0.026 0.004 0.005 0.005 0.005 0.004 -0.108 -0.105 -0.096 -0.082 -0.062 -0.050 -0.040 -0.026 -0.012
-1 0 1
•1=0.107 (•1=9.37),BETA=1.700 •1=0.058 (•1=17.26),BETA=0.144
c f v 0 0 7 h v 2 0 T 2 = 0 . 7 5 1 f 2 = 1 . 3 3
•2=0.751 (•2=1.33),BETA=-0.925
c f v 0 0 7 h v 2 0 T 1 = 2 . 6 6 9 f 1 = 0 . 3 7
•1=2.669 (•1=0.37),BETA=-1.589
EXCITING FUNCTION ..NO T= S f= Hz B= RB19 RB18 RB17 RB16 RB15 RB14 RB13 RB12 RB11 I/C IC35 IC34 IC33 IC32 IC31 IC04 IC03 IC02 IC01 FIX1 CV53 CV52 CV51 CV50 CV49 CV47 CV45 CV44 CV42 RE69 RE68 RE67 RE66 RE65 RE64 RE63 RE62 RE61 1 0.107 9.37 1.700 1.591 1.573 1.516 1.393 1.171 1.111 1.051 0.979 0.895 1.090 1.059 1.025 0.911 0.852 0.782 0.764 0.542 0.531 0.000 1.700 1.676 1.567 1.352 1.075 1.029 0.988 0.934 0.875 1.593 1.578 1.526 1.428 1.296 1.218 1.146 1.038 0.922
-1 0 1
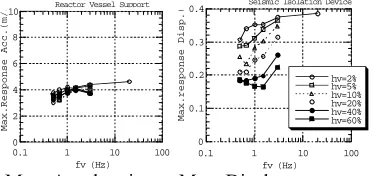
Maximum Responses
Maximum response acceleration at the RV support point and maximum response displacements at the layer in which the seismic isolation systems are installed, are shown in from Figure 13 to 15. In Figure13, the maximum horizontal response acceleration at RV support point is thought to be constant when the seismic isolation device stiffness is varied, on the other hand, in Figure 14, the maximum rotational acceleration increases when the vertical seismic isolation stiffness decreases. In Figure 13, the maximum response displacement in horizontal direction decreases when the vertical seismic isolation device stiffness decreases, on the other hand, in Figure 14, the rotational response angle increases sharply when the stiffness decreases. The reason, the rotational acceleration and angle increases followed by the decrease of the stiffness, can be attributed to the change of the vibration modes. They change from sway to rocking. In Figure 15, maximum response acceleration in vertical direction decreases when the vertical seismic isolation device stiffness decreases in the region between 3.0 Hz and 0.5Hz, on the other hand, the maximum response displacement in vertical direction increases depending on the decrease of the vertical stiffness. These tendencies are in common with usual vibration systems; A system that has a longer period exhibits smaller accelerations and longer displacements than those of shorter period.From these outputs, the total horizontal and vertical maximum displacements were summed up by SRSS as shown in Figure 16, and compared with the design feasibility evaluation criteria relating to the piping system in the case of 3D SIS.
0 0.05 0.1 0.15 0.2 0.25
0.1 1 10 100
Max.Response Rotational Acc.(rad/s
2
fv (Hz) Reactor Vessel
Max.Reponse Rotaion Angle(
r 0 0.005 0.01 0.015 0.02 0.025 0.03
0.1 1 10 100 hv=2% hv=5% hv=10% hv=20% hv=40% hv=60% fv (Hz) Seismic Isolation D i 0 0.1 0.2 0.3 0.4
0.1 1 10 100
Seismic Isolation Device
hv=2% hv=5% hv=10% hv=20% hv=40% hv=60% Max.response Disp. ( fv (Hz) 0 2 4 6 8 10
0.1 1 10 100
Max.Response Acc.(m/
s
fv (Hz)
Reactor Vessel Support
5
0 0.1 10 15 20
1 10 100
Max
. Respo
nse Ve
rt. Acc
.•
m/s
2
•
fv(Hz) Reactor Vessel
0 0.1 0.2 0.3 0.4 0.5
0.1 1 10 100
Max
.Respon
se Ver
t. Disp
.m•
fv(Hz)
hv=2% hv=5% hv=10% hv=20% hv=40% hv=60%
Seismic Isolation Device
SRSS
of
H
ori.&
V
ert.
D
is
p
Max. Acceleration Max. Displacement Figure 16 SRSS of Max. Hori.&Vert Figure 15 Maximum responses in Vertical Direction . Displacements
Floor Response Spectra
The FRS at the RV support point are shown in Figure 17 and Figure 18 for horizontal and vertical directions, respectively. In Figure 17, little differences among the horizontal FRS is found, especially around 0.2sec, the fundamental natural frequency of the RV in horizontal direction. On the other hand, in Figure 18, remarkable differences in vertical FRS between fv20Hz and the others are found, in the region of the fundamental natural frequency of the RV in vertical direction of about 0.1sec. At the period of 0.1sec, FRS decreases by about 1/6, from that of 20Hz to those of others. This very point is why the seismic isolation system is applied to FBR. The spectra shown in Figure 17,18 in horizontal and vertical directions and in rotational direction were applied to the component analysis model to estimate the required responses.
Figure 17 FRS at RV Support Point in Horizontal Direction Figure 18 FRS at RV Support Point in Vertical Direction
TARGETS IN THE SEIMIC ISOLATION DEVICE DEVELOPMENT
Evaluation Results for Component Design
Table 2 Evaluation Results for Component Seismic Design (For 3D Seismic Isolation System)
3D Seismic Isolation System Vertical Damping Ratio of the Device:
hv(%) Vertical Frequency of
the Device: fv(Hz)
2 5 10 20 40 60
× • • • • •
× • • • • •
× • • • • •
× • • • • •
20
• • • • • •
× × • • • •
× • • • • •
• • • • • •
• • • • • •
• • • • • •
× • • • • •
× • • • • •
• • • • • •
• • • • • •
• • • • • •
• • • • • •
• • • • • •
• • • • • •
• • • • • •
• • • • • •
• • • • • •
• • • • • •
• • • • • •
• • • • • •
0.667
• • • • • •
• • • • • •
• • • • • •
• • • • • •
• • • • • •
• • • • • •
3.0
1.5
1.0
0.5
Note 1: Redundancy: Allowable Value/ Analysis Result
•: Redundancy over 1.0, •: Redundancy 1.0 •0.8,
×: Redundancy less than 0.8,•:No Evaluation
Note2: Evaluation Items From Top to Bottom in each Combination of fv and hv. 1st: Acceleration at core support plate in vertical direction
2nd: Relative displacement between core support plate and upper inner structure in vertical direction 3rd: Out of plane displacement of core support plate
4th: Combined stress in reactor vessel
5th: Relative displacement for the water/steam system in the case of the 3D Seismic Isolation System Note3: :Proper combination of ‘fv’ & ‘hv’.
:Just before the proper combination of the above
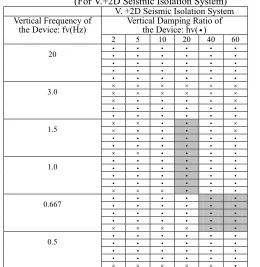
Table 3 Evaluation Results for Component Seismic Design (For V.+2D Seismic Isolation System)
V. +2D Seismic Isolation System Vertical Damping Ratio of
the Device: hv(•)
Vertical Frequency of the Device: fv(Hz)
2 5 10 20 40 60
• • • • • •
• • • • • •
• • • • • •
• • • • • •
20
• • • • • •
× × × × × ×
× × × × × ×
× • • • × ×
• • • • • •
• • • • • •
× × • • • ×
× • • • • ×
• • • • • •
• • • • • •
× × • • • •
• • • • • •
• • • • • •
• • • • • •
• • • • • •
× × × • • •
• • • • • •
• • • • • •
• • • • • •
• • • • • •
0.667
× × × × • •
• • • • • •
• • • • • •
• • • • • •
• • • • • •
× × × × × •
3.0
1.5
1.0
0.5
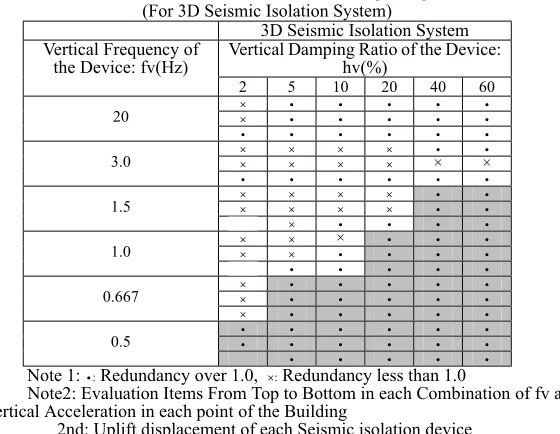
Evaluation Results for Building Design
Building seismic response analysis results were compared with the criteria to evaluate the applicability of the SIC to FBR. Evaluation results for building design are shown in Table 4 only for 3D SIS.
From the table, the combinations of vertical frequencies less than 1.0Hz and vertical damping ratio between 20 and 40• could be recommended for the 3D SIS.
Table 4 Evaluation Results for Building Design (For 3D Seismic Isolation System)
3D Seismic Isolation System Vertical Damping Ratio of the Device:
hv(%) Vertical Frequency of
the Device: fv(Hz)
2 5 10 20 40 60
× • • • • •
× • • • • •
20
• • • • • •
× × × × • •
× × × × × ×
• • • • • •
× × × × • •
× × × × • •
× × • • • •
× × × • • •
× × • • • •
• • • • • •
× • • • • •
× • • • • •
0.667
× • • • • •
• • • • • •
• • • • • •
• • • • • •
3.0
1.5
1.0
0.5
Note 1: •: Redundancy over 1.0, ×: Redundancy less than 1.0
Note2: Evaluation Items From Top to Bottom in each Combination of fv and hv. 1st: Vertical Acceleration in each point of the Building
2nd: Uplift displacement of each Seismic isolation device 3rd: Horizontal Acceleration in each point of the Building
Targets in the Seismic Isolation Device Development
Considering both of the evaluation results for the seismic isolation device properties for 3D and V. +2D SIS, the targets were set in Table 5. Development of the 3D SIS is going to progress for a while based on these targets. However, these targets should be updated referring to the relating commercialized FBR project progress, because these were settled based on the tentative conditions.
Table 5 Targets in the Seismic Isolation Device Development
Seismic Isolation System Type
Vertical Frequency (Hz)
Vertical Damping Ratio (•)
3D Less than or 20•40
V. +2D Around 1.0 20•40
equal to1.0
CONCLUSIONS
(1) Development planning consisted of setting seismic conditions, design feasibility evaluation criteria and development target like frequency and damping ratio and so on. They were settled tentatively prior to the start of R&D.
(2) Development methods for 3D and Vertical +2D Seismic Isolation System were settled. For the 3D system, the method of collecting ideas from major private companies was adopted. Three ideas were chosen from nine proposals, and they are under currently development. Another screening would be considered when necessary.
(3) For the V. +2D system, the cone dish spring technology is applied to the vertical seismic isolation device. As the development items, several experiments are planned to grasp the basic properties of the spring and to confirm the applicability of the existing design formula to larger size dish springs.
(4) The seismic conditions were settled as the seismic spectra ‘Case Study S2’ in horizontal and vertical directions. The ratio, vertical to horizontal, was to be 0.6, was settled considering the experience of the past.
(5) The criteria for component and building seismic design feasibility evaluation were settled. The criteria for component design were settled for the design of core, reactor vessel and piping. On the other hand, the criteria for building design were settled for the design of seismic isolation device and building structural members like column, beam and so on.
(6) Seismic response analyses for the building and reactor component were conducted to grasp the intensities of the responses at the reactor supporting point and seismic isolation layer in the building model, and at the core support plate and RV in the reactor component model. In the analyses, seismic isolation effects were remarkably recognized in the vertical FRS at the RV support point. The analysis results were compared with the design feasibility evaluation criteria to evaluate the applicability of the 3D SIS to FBR.
(7) As the target in the 3D SIS development, vertical frequency: less than or equal to 1.0Hz in the case of 3D, around 1.0Hz in the case of V. +2D Seismic Isolation Systems, vertical damping ratio: from 20 to 40• for both 3D and V. +2D Seismic Isolation Systems, were settled.
(8) The development conditions settled ‘tentatively’ would be updated referring to the progress of relating R&D activities.
ACKNOWLEDGEMENTS
REFERENCES
[1] JEAG 4614-2000,”Design Guideline of seismic Isolation Systems for Nuclear Power Plants”, Japan Electric Association, 2000(In Japanese)
[2] Kato M. et al. “Design study of the seismic-isolated reactor building of demonstration FBR plant in Japan”, Trans. of the 13th SMiRT, Vol.3, Div. K, pp579-584, Brazil, August, 1995
[3] Japan Meteorological Agency, “Hyougoken nambu earthquake strong motion records”, 1995 (in Japanese) [4] Bogazici University Kandilli Observatory & Earthquake Research Institute,
http://www.koeri.boun.edu.tr/earthqk/smnl.htm,, Turkey, 1999
[5] Seismology Center Weather Bureau, “Digital Acceleration (Files on CD-ROM”, Taipei, Taiwan, 1999) [6] The Japan Atomic Power Company, ”Demonstration fast
breeder reactor elevated temperature structural design guideline (DDS)”, 1999 (in Japanese)