Volume 2010, Article ID 230785,9pages doi:10.1155/2010/230785
Research Article
Detection of Ground Moving Targets for
Two-Channel Spaceborne SAR-ATI
Zhen Dong,
1Bin Cai,
2and Diannong Liang
11School of Electronic Science and Engineering, National University of Defense Technology (NUDT), Changsha, Hunan, 410073, China 2Telecommunication Engineering Institute, Air Force Engineering University, Xi’an, Shanxi, 710077, China
Correspondence should be addressed to Zhen Dong,dongzhen@vip.sina.com
Received 9 March 2009; Revised 21 December 2009; Accepted 1 April 2010
Academic Editor: Laurent Ferro-Famil
Copyright © 2010 Zhen Dong et al. This is an open access article distributed under the Creative Commons Attribution License, which permits unrestricted use, distribution, and reproduction in any medium, provided the original work is properly cited.
Many present spaceborne synthetic aperture radar (SAR) systems are constrained to only two channels for ground moving target indication (GMTI). Along-track interferometry (ATI) technique is currently exploited to detect slowly moving targets and measure their radial velocity and azimuth real position. In this paper, based on the joint probability density function (PDF) of interferogram’s phase and amplitude and the two hypotheses “clutter” and “clutter plus signal”, several constant false alarm rate (CFAR) detection criteria are analyzed for their capabilities and limitations under low signal-to-clutter ratio (SCR) and low clutter-to-noise ratio (CNR) conditions. The CFAR detectors include one-step CFAR detector with interferometric phase, two-step CFAR detectors, and two-dimensional (2D) CFAR detector. The likelihood ratio test (LRT) based on the Neyman-Pearson (NP) criterion is exploited as an upper bound for the performance of the other CFAR detectors. Performance analyses demonstrate the superiority of the 2D CFAR techniques to detect dim slowly moving targets for spaceborne system.
1. Introduction
Many present spaceborne synthetic aperture radar (SAR) systems, such as TerraSAR-X and RADARSAT-2, are con-strained to two channels to detect slowly moving targets on the ground. The two channels, which aligned in the flight direction of the same or different platform(s), observe the same terrain at different times under identical geometry. The radial velocities of the ground moving targets lead to the phase difference of the two registered SAR images whereas the two channel signals for stationary scene are identical and can be canceled out by computing the phase difference. Along-track interferometry (ATI) technique exploits the interferogram of the two channel SAR images to perform moving target detection, radial velocity measurement, and azimuth relocation.
Traditional SAR-ATI detection techniques only used the interferometric phase as the constant false alarm rate (CFAR) detection metric to separate moving target from clutter. Gierull [1, 2] derived the theoretical joint (PDF) probability density function (PDF) of interferogram’s phase and amplitude for the hypotheses “clutter” and “clutter plus
signal” under the assumption of Gaussian backscatter. A two-step CFAR detector [1] is also proposed by computing the magnitude and phase thresholds separately based on
the marginal PDFs of magnitude and phase. Chiu [3]
proposed a nonparametric CFAR detector using histogram approximation to the theoretical joint PDF for the clutter interferogram. Meyer et al. [4] integrated a prior information into a likelihood ratio detector, which include road network database and the radar cross-section (RCS) of the moving targets. This new hypothesis-test framework is fit for pub-lic traffic monitoring applications, where the vehicles are assumed to travel strictly on streets or roads.
clutter returns, such as channel unbalance or the additive receiver thermal noise, are other limitations to ATI detection performance, but some of them can be remedied using suitable calibration techniques [2, 5]. At low clutter-to-noise ratio (CNR) patches, such as smooth roads or water surfaces, the correlation value may be lower to 0.8. Due to the low coherence, the wide phase distribution of the clutter interferogram induces that the phase detection threshold becomes too large, and prohibits almost any detection [2]. In this paper, under low SCR or low CNR conditions, several CFAR techniques are analyzed for their capabilities and limitations.
In this paper, based on the joint probability density function (PDF) of interferogram’s phase and amplitude and the two hypotheses “clutter” and “clutter plus signal”, several constant false alarm rate (CFAR) detection criteria are analyzed for their capabilities and limitations under low signal-to-clutter ratio (SCR) and low clutter-to-noise ratio (CNR) conditions. The CFAR detectors include one-step CFAR detector with interferometric phase, two-step CFAR detectors and two-dimensional (2D) CFAR detector. The likelihood ratio test (LRT) based on the Neyman-Pearson (NP) criterion is exploited as an upper bound for the performance of the other CFAR detectors.
The paper is organized as follows.Section 2reviews the statistics of the multilook interferograms’ magnitude and phase for the hypotheses “clutter” and “clutter plus moving target” under Gaussian assumption of the clutter.Section 3 describes the CFAR detection techniques and the likelihood ratio test (LRT) under the NP (Neyman-Pearson) criterion. Performance analysis and comparison are given inSection 4. Section 5gives the conclusion.
2. Statistics of Multilook Interferograms’
Magnitude and Phase for the Hypotheses
“Clutter” and “Clutter Plus Moving Target”
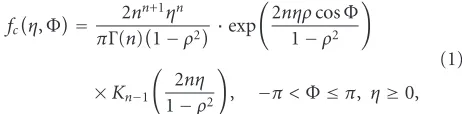
Firstly, some realistic assumptions are described as follows: (i) Gaussian distributed stationary clutter which is validated over homogeneous agricultural and natural areas [1]; (ii) moving target is modeled as point target of Swerling 0 case with a constant velocity; (iii) magnitude and phase errors caused by mismatched SAR processing or channel unbalance have been eliminated prior to the detection; (iv) the SAR resolution cell is larger than the target size that contains both clutter and moving target; (v) the definitions of SCR and CNR are proposed in [6], which are different from traditional definitions used in GMTI. Under above assumptions, the well-known joint PDF of the multilook interferograms’ phaseΦand normalized magnitudeηfor the clutter-only case is given by [1]
fc
η,Φ= 2nn+1ηn
πΓ(n)1−ρ2 ·exp
2nηρcosΦ
1−ρ2
×Kn−1
2nη
1−ρ2
, −π <Φ≤π, η≥0, (1)
whereρis the correlation coefficient between the two channel outputs andnis the effective number of looks.Kn−1(·) is the
0
0.5
1
ρ
0 10 20 30
n
0 0.2 0.4 0.6 0.8
KL
Figure 1: Kullback-Leibler (KL) divergence of joint PDF and product of the marginal PDF for different looks number and the coherence.
second type modified Bessel function of order (n−1), and
Γ(·) is the gamma function. Integrating (1) with respect toη
orΦlead to the marginal PDFs of the phase and magnitude as follows:
fc(Φ)= Γ
(n+ 1/2)1−ρ2nρcos(Φ) 2√πΓ(n)1−ρ2cos2(Φ)(n+1/2)
+
1−ρ2n 2π 2F1
n, 1;1 2;ρ
2cos2(Φ)
,
fc
η= 4nn+1ηn
Γ(n)1−ρ2I0
2nηρ
1−ρ2
·Kn−1
2nη
1−ρ2
, (2)
where 2F1(·) is the Gauss’s hypergeometric function, and
I0(·) is the first type modified Bessel function of zero. Kullback-Leibler (KL) divergence can be used to show the degree of the dependence between magnitude and phase, which is defined as
KLfc
η,Φ,fc
η·fc(Φ)
=
π
−π
+∞
0 fc
η,Φlog fc
η,Φ
fc
η·fc(Φ)
dηdΦ.
(3)
For large number of looks, the approximation PDF of “clutter plus moving target” is given as [2]
fc+m
η,Φ
=2n
n+1ηη−δcos(Φ−Φ
v)
2
+δ2sin2(Φ−Φ
v)
(n−1)/2
πΓ(n)1−ρ2
·exp
2nρηcos(Φ)−δcos(Φv)
1−ρ2
·Kn−1
⎛ ⎝2n
η−δcos(Φ−Φv)
2
+δ2sin2(Φ−Φv) 1−ρ2
⎞ ⎠,
(4)
whereΦvis the interferometric phase of moving target and δis the signal-to-clutter ratio (SCR).n,ρare defined in (1). The analytical integration of (4) with respect to the magni-tude or phase to get the marginal PDF is extremely difficult or even impossible. Alternatively, numerical integration can be used to calculate the theoretical PDF of phase or magnitude.
3. CFAR Detectors and Likelihood Ratio Test
Based on the Optimum NP Criterion
3.1. One-Step CFAR Detector with Interferometric Phase. The common used CFAR test statistic for ATI is the interfero-metric phase, which is robust for scene heterogeneity and channel power unbalance. The test cell’s interferometric phase is compared with a chosen threshold. For given probability of false alarm (Pfa=α), the phase threshold|Φth| can be determined using (5) and the probability of detection (Pd) can be computed using (6). The involved parameters, such as the number of looks and the coherence, are estimated directly from the two-channel SAR data [1]:
Pfa=2
π
|Φth|
fc(Φ)dΦ=α, (5)
Pd=2
π
|Φth|
fc+m(Φ)dΦ. (6)
As several papers have analyzed [1, 2, 4], the multilook number should be chosenn≥4 to get reasonablePfa(Pfa≤ 10−5) for the phase-only CFAR detection. In this paper, we choose n = 10. Typical SAR signal decorrelations in the technique include image misregistration, channel unbalance, Doppler discrepancy, temporal scene decorrelation, quanti-zation error, uncorrelated SAR impulse response tails, and the thermal noise. For simplification, other coherence except for the thermal noise coherence are chosen to be one. Assume the two SAR signals have the same CNR, the correlation coefficient can be expressed as
ρ= CNR
CNR + 1. (7)
The PDFs of the interferometric phase for the two hypotheses withΦforΦv=1 rad,n=10, andPfa=10−5are shown in
Figures 2(a) (CNR=10 dB, SCR=10, 5, 0,−5,−∞dB) and 2(b)(SCR=0 dB, CNR=20, 10, 0,−3 dB). When the SCR decrease, the phase PDF of second hypothesis may migrate from Φv to zero phase line with variance increase, which are shown in Figure 2(a). When the CNR decreases, the wide phase distribution of the clutter interferogram induces that the phase detection threshold becomes too large, and prohibits almost any detection.
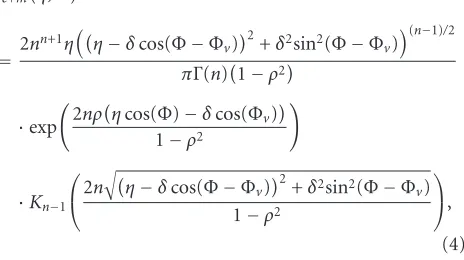
Figure 3shows the Pd versus SCR or CNR curves with n = 10, Pfa = 10−5, Φv = 1 rad, 1.5 rad, 2 rad, 2.5 rad. CNR=10 dB inFigure 3(a)and SCR=5 dB inFigure 3(b). FromFigure 3, we can see that the phase-only metric loses its ability to detect slowly moving targets and to correctly estimate their velocities under low SCR or CNR conditions. For fast moving targets, due to the SAR focusing technique, the magnitude response of fast moving targets may degrade 50% or more lower. The peak power of the moving target may be comparable to the clutter power. Low SCR and low CNR (or low correlation) may be the major obstacle to the phase-only detector.
3.2. Two-Step CFAR Detectors. Gierull proposed a two-step CFAR detector by computing the magnitude and phase thresholds separately from their marginal PDFs [1]. The first test static is phase and the second test for the remaining pixels is the magnitude. The test cell can be termed to “clutter plus target” hypothesis if its phase and magnitude all exceed the thresholds. The detector is based on the assumptions that clutter with large phase values most likely have a small magnitude and most moving targets have a relatively high RCS [1], which are shown inFigure 4. According toFigure 4, the assumption that moving targets will have a higher RCS than the terrain is fit for most homogeneous clutter regions, except for the urban areas or sea surfaces.
The clutter pixels in the low CNR regions, such as those corresponding to road and water surfaces, can be suppressed by the amplitude marginal detection, but it cannot separate the moving targets from the stationary scene. Therefore, the two detection metrics can be combined to a two-step CFAR detector. For a fixedPfa=α, the thresholdsηth,|Φth|andPd for the two-step CFAR detector can be determined as
Pfa=2
∞
ηth
fc
ηdη·
π
|Φth|
fc(Φ)dΦ =α,
Pd=2
∞
ηth
fc+m
ηdη·
π
|Φth|
fc+m(Φ)dΦ.
(8)
As seen inFigure 1,ηandΦare not statistically independent. The conditional PDF of interferometric magnitude for a fixed phase and the marginal PDF of phase can be used alternatively to improve the detector performance. For a fixed
Pfa, the thresholds andPdcan be determined by replacing the marginal PDF of magnitude with the conditional PDF in (8):
Pfa=2
π
|Φth|
fc(Φ)dΦ·
∞
ηth
fc
η|Φth
dη =α,
Pd=2
π
|Φth|
fc+m(Φ)dΦ·
∞
ηth
fc+m
η|Φth
dη.
−3 −2 −1 0 1 2 3
Φ(rad) 0
2 4 6 8 10 12 14 16
n=10 CNR=10 dB Φv=1 rad Pfa=1e−005
Phase
threshold SCR=10 dB
SCR=5 dB SCR=0 dB SCR= −5 dB SCR= −∞
(a)
−3 −2 −1 0 1 2 3
Φ(rad) 0
0.5 1 1.5 2 2.5 3 3.5 4
n=10 SCR=0 dB Φv=1 rad Pfa=1e−005
fc(Φ), CNR=10 dB
fc(Φ), CNR=5 dB
fc(Φ), CNR=0 dB
fc(Φ), CNR= −5 dB
CNR=10 dB,fc+m(Φ) CNR=5 dB,fc+m(Φ)
CNR=0 dB,fc+m(Φ)
CNR= −5 dB,
fc+m(Φ)
(b)
Figure2: PDF of the interferometric phase of “clutter”and “clutter plus moving target” withΦforn=10,Pfa=1e−5, andΦv=1 rad. (a)
CNR=10 dB, SCR=−∞,−5 dB, 0 dB, 5 dB, 10 dB; (b) SCR=0 dB, CNR=−5 dB, 0 dB, 5 dB, 10 dB forfc(Φ) andfc+m(Φ).
−10 −5 0 5 10
SCR (dB) 0
0.2 0.4 0.6 0.8 1
Pd
n=10 CNR=10 dB Pfa=1e−005
Φv=1 rad
Φv=1.5 rad
Φv=2 rad
Φv=2.5 rad (a)
−5 0 5 10
CNR (dB) 0
0.2 0.4 0.6 0.8 1
Pd
n=10 SCR=5 dB Pfa=1e−005
Φv=1 rad
Φv=1.5 rad
Φv=2 rad
Φv=2.5 rad (b)
Figure3:Pdversus SCR and CNR of one-step CFAR detector withΦforn=10,Pfa=1e−5,Φv=1 rad, 1.5 rad, 2 rad, 2.5 rad. (a) CNR=
10 dB; (b) SCR=0 dB.
Figure 5(a)shows the CFAR thresholds for one-step detec-tion with η,Φ and the threshold curves for two-step detection with marginal PDFs and the conditional PDF for
n = 10, CNR = 10 dB, SCR = 0 dB, Φv = 1 rad, and
Pfa = 10−5. The joint PDFs of the two hypotheses are also plotted for ease of comparison.Figure 5(b)showsfc(η|Φth) and the corresponding thresholds (dash lines) changed with
Φth forn = 10, CNR=10 dB,Pfa = 10−3. InFigure 5(a), for Pfa = 10−5, the Pds for one-step detection with η or Φ are very low. The conditional PDF of magnitude is much fit to separate moving target from clutter than the marginal PDF. Becauseη,Φcannot be assumed independent, Figure 5(b)shows that the PDF of magnitudeηis a function of phase. The fluctuations of ηdistribution become larger asΦapproximate to zero and the CFAR thresholds become larger (dashed lines).
Observe from (8) that the two kinds of two-step CFAR detectors havePd andPfa that are both dependent on two thresholds. Under a fixedPfa, there exist an infinite number of threshold pairs achieving a fixedPfa. The user is left with the task of choosing a threshold pair to operate the detector, that is, an operating point. The choice of an operating point is pivotal to resulting performance and must be chosen carefully. In Figures6(a)and6(b), thePdcurves that change along the iso-Pfacurves are plotted with 3-D visualization for
0 2 4 6 8 10 12
η
0 0.5 1 1.5 2 2.5
n=10 CNR=10 dB Φv=1 radPfa=1e−005
Magnitude
threshold fc+m(η), SCR=10 dB
fc+m(η),
SCR=5 dB
fc+m(η), SCR=0 dB
fc+m(η),
SCR= −5 dB
fc(η), SCR= −∞
(a)
0 2 4 6 8 10
η
0 0.5 1 1.5 2 2.5
n=10 SCR=5 dB Φv=1 rad CNR= −5 dB,fc+m(η)
CNR=0 dB,fc+m(η) CNR=5 dB,fc+m(η)
CNR=10 dB,fc+m(η)
fc(η), CNR=10 dB
fc(η), CNR=0 dB
fc(η), CNR=5 dB
fc(η), CNR= −5 dB
(b)
Figure4: PDF of the interferometric magnitude of “clutter”and “clutter plus moving target” withηforn=10,Pfa=1e−5, andΦv=1 rad.
(a) CNR=10 dB, SCR=−∞,−5 dB, 0 dB, 5 dB, 10 dB; (b) SCR=5 dB, CNR=−5 dB, 0 dB, 5 dB, 10 dB forfc(η) and fc+m(η).
−3 −2 −1 0 1 2 3
Φ
0 1 2 3 4 5
η
n=10 CNR=10 dB SCR=0 dB
Φv=1 rad Pfa=1e−005
1 2 3 4 5 6 7 8 9
Two-step CFAR detector with marginal PDFs Two-step CFAR detector with conditional PDF One-step CFAR detector withη
One-step CFAR detector withΦ
(a)
0 0.5 1 1.5 2
η
0 1 2 3 4 5 6 7
PDF(
η
|
Φth
)
n=10 CNR=0 dB Pfa=1e−3
Φth=0 rad
Φth=1 rad
Φth=1.5 rad
Φth=2 rad
Φth=3 rad
(b)
Figure5: (a) Threshold curves of ATI detectors forn =10,Pfa=1e−5, CNR=10 dB, SCR=0 dB, andΦv =1 rad, (one-step CFAR
detector withΦandη, two-step CFAR detector with conditional PDF, and two-step CFAR detector with marginal PDFs); (b) the PDF ofη
as a function of phase and corresponding thresholds.
strategy for operating point selection is to choose a point near the center of the iso-Pfacurves. At other times, the pairs of thresholds can also be chosen to an interval of points along the iso-Pfa curves. In fact, the appropriate operating points along the contours used for detection ultimately depend on system needs [1].
3.3. Two-Dimensional (2D) CFAR Detector. As described in Section 3.2, on one hand, the task of choosing an operating point is very difficult. On the other hand, if one uses a constant magnitude-phase threshold pair arbitrarily, the
result would lead to either too many false alarms or too few detected targets, whether or not takes into account the magnitude dependence of the phase PDF. Based on the theoretical joint PDF of magnitude and phase, it is possible to use false alarm isolines to separate moving targets from clutter on the two-dimensional magnitude-phase plane. However, there exist an infinite number of
0 0.2
0.4 0.6 0.8
|Φ|(rad)
0 2
4
η
0 0.2 0.4 0.6 0.8 1
Pd
Pfa=0.0001
Pfa=1e−005
Pfa=1e−006
n=10 CNR=10 dB SCR=0 dB Φv=1 rad
(a)
0 0.2
0.4 0.6 0.8
|Φ|(rad)
0 1 2 3 4
η
0 0.2 0.4 0.6 0.8 1
Pd
n=10 CNR=10 dB SCR=0 dB Φv=1 rad
Pfa=0.0001
Pfa=1e−005
Pfa=1e−006
(b)
Figure6:Pdcurves along iso-Pfacurves with 3-D visualization forPfa=1e−4, 1e−5, 1e−6,n =10, CNR=10 dB, SCR=0 dB, and
Φv=1 rad. (a) two-step CFAR detector with marginal PDFs; (b) Two-step CFAR detector with conditional PDF.
−3 −2 −1 0 1 2 3
Φ
0 1 2 3 4 5
η
n=10 CNR=10 dB SCR=0 dB
Φv=1 rad Pfa=1e−005
1 2 3 4 5 6 7 8 9
2-D CFAR detector with joint PDF
Two-step CFAR detector with conditional PDF LRT based on NP criterion
Figure7: Joint PDF of the two hypotheses and the threshold curves of ATI detectors forn=10, CNR=10 dB, SCR=0 dB,Pfa=1e−5,
Φv=1 rad. (two-step CFAR with conditional PDF, 2D CFAR with joint PDF, and LRT based on NP criterion).
test can be exploited to maximize thePdwith constantPfaas follows,
Λ2D
η,Φ= f
η,Φ|H1
fη,Φ|H0
= fc+m
η,Φ
fc
η,Φ
= C
fc
η,Φ > γ, γ >0,
(10)
where C is a constant and γ is the detection threshold. Equation (10) can be simplified as constant-density contour lines on the magnitude-phase plane
fc
−10 −5 0 5 10 SCR (dB)
0 0.2 0.4 0.6 0.8 1
Pd
n=10 CNR=5 dB Φv=1.5 rad Pfa=1e−005
Two-step CFAR detector with conditional PDF (center point) Two-step CFAR detector with marginal PDFs (center point) Two-step CFAR detector with conditional PDF (maximumPd) Two-step CFAR detector with marginal PDFs (maximumPd) 2-D CFAR detector with joint PDF
LRT based on NP criterion (a)
−5 0 5 10 15
CNR (dB) 0
0.2 0.4 0.6 0.8 1
Pd
n=10 SCR= −3 dB Φv=1.5 rad Pfa=1e−005
Two-step CFAR detector with conditional PDF (center point) Two-step CFAR detector with marginal PDFs (center point) Two-step CFAR detector with conditional PDF (maximumPd) Two-step CFAR detector with marginal PDFs (maximumPd) 2-D CFAR detector with joint PDF
LRT based on NP criterion (b)
Figure8:Pdof ATI detectors versus SCR and CNR forn=10,Pfa=1e−5, andΦv =1.5 rad, (two-step CFAR detector with conditional
PDF (center point/maximumPd), two-step CFAR detector with marginal PDFs (center point/maximumPd), 2D CFAR detector with joint
PDF, and LRT based on NP criterion). (a) CNR=5 dB; (b) SCR=0 dB.
10−25 10−20 10−15 10−10 10−5 100
Pfa
0 0.2 0.4 0.6 0.8 1
Pd
n=10 CNR=0 dB Φv=1 rad
One-step CFAR detector withΦ, SCR=0 dB
Two-step CFAR detector with conditional PDF, SCR=0 dB Two-step CFAR detector with marginal PDF, SCR=0 dB 2-D CFAR detector with joint PDF, SCR=0 dB LRT based on NP criterion, SCR=0 dB One-step CFAR detector withΦ, SCR=5 dB
Two-step CFAR detector with conditional PDF, SCR=5 dB Two-step CFAR detector with marginal PDF, SCR=5 dB 2-D CFAR detector with joint PDF, SCR=5 dB LRT based on NP criterion, SCR=5 dB
(a)
10−25 10−20 10−15 10−10 10−5 100
Pfa
0 0.2 0.4 0.6 0.8 1
Pd
n=10 SCR=0 dB Φv=1 rad
One-step CFAR detector withΦ, CNR=0 dB
Two-step CFAR detector with conditional PDF, CNRR=0 dB Two-step CFAR detector with marginal PDF, CNR=0 dB 2-D CFAR detector with joint PDF, CNR=0 dB LRT based on NP criterion, CNR=0 dB One-step CFAR detector withΦ, CNR=10 dB
Two-step CFAR detector with conditional PDF, CNR=10 dB Two-step CFAR detector with marginal PDF, CNR=10 dB 2-D CFAR detector with joint PDF, CNR=10 dB LRT based on NP criterion, CNR=10 dB
(b)
Figure9: Performance of ATI detectors for SCRs and CNRs,n=10,Φv =1 rad (one-step CFAR detector with, two-step CFAR detector
0 5 10 15 20 25 30 Radial velocity
0 0.2 0.4 0.6 0.8 1
Pd
n=10 SCR=0 dB Pfa=1e−005
One-step CFAR detector withΦ, CNR=10 dB
Two-step CFAR detector with marginal PDFs, CNR=10 dB Two-step CFAR detector with conditional PDF, CNR=10 dB 2-D CFAR detector with joint PDF, CNR=10 dB
LRT based on NP criterion, CNR=10 dB One-step CFAR detector withΦ, CNR=5 dB
Two-step CFAR detector with marginal PDFs, CNR=5 dB Two-step CFAR detector with conditional PDF, CNR=5 dB 2-D CFAR detector with joint PDF, CNR=5 dB
LRT based on NP criterion
Figure 10:Pd of ATI detectors versus radial velocity of moving
target forn = 10, Pfa = 1e−5 (two-step CFAR detector with
conditional PDF (center point/maximum Pd), two-step CFAR
detector with marginal PDFs (center point/maximum Pd), 2D
CFAR detector with joint PDF, and LRT based on NP criterion). SCR=0 dB; CNR=10, 5 dB.
The thresholdsγ,γare determined by thePfa:
Pfa=
Λ2D(η,Φ)>γ
fc
η,ΦdηdΦ
=
fc(η,Φ)<γ
fc
η,ΦdηdΦ=α.
(12)
Pd is simply the integral of the “Clutter plus moving target” PDF over the area where fc(η,Φ)< γ. The above threshold curve is also plotted in Figure 7 with parameters given in Section 3.2.
3.4. The Likelihood Ratio Test Based on NP Criterion. In (4), the two target parametersΦv andδ (SCR) cannot be estimated directly from the interferometry data. However, because of the Doppler frequency shift between moving tar-get and the clutter, the imaging results of the moving tartar-gets shift in the azimuth direction with respect to stationary scatter. Then, the target phase ψ caused by its cross-track motion can be expressed as
Φv= −Δa2πB R0λ
, (13)
where Δa is the azimuth displacement, λ is the radar wavelength, B is the along-track baseline and R0 is the
distance between the moving target and the satellite. In fact, except for some military applications of GMTI, a great deal of targets may travel strictly on the road or highway with specific moving direction and velocity range. Based on the road network database, such as road class, road location, road width and maximum velocity, the azimuth displacement map and the interferometric phase map of moving targets around the roads can be computed analytically pixel by pixel as stated in [4]. On the other hand, the RCS values of typical moving targets can also be derived from experimental measurement. These types of prediction may be interpreted as a priori knowledge that can be acquired, analyzed and integrated into the detection process of SAR-ATI for theoretical or engineering application [4]. Under a fixedPfa, the likelihood ratio test function that maximizes the PD under the NP criterion is
Λη,Φ= f
η,Φ|H1
fη,Φ|H0
= fc+m
η,Φ
fc
η,Φ > μ, μ >0. (14)
The fc+m(η,Φ), fc(η,Φ) can be seen in (1) and (4). The corresponding parameters can be estimated with the method in [1] and the prior information. The iso-Pfathreshold curves can be determined by
Pfa=
∞
μ f(Λ|H0)dΛ=
{η,Φ|Λ>μ} f
η,Φ|H0
dηdΦ=α.
(15)
Simplification of the LRT function is a very difficult task and the numerical integration can be exploited to compute thePfa,μandPd. Unfortunately, since the threshold curves for fixedPfadepend on the signal parameters SCR andΦv, the LRT under the NP criterion does not possess the CFAR property.
Figure 7 plots the joint PDF of the two hypotheses, the threshold curves for two-step CFAR detection with conditional PDF, 2D CFAR detection with joint PDF, and LRT based on NP criterion.Figure 8shows thePdversus SCR and CNR withn=10,Pfa=10−5,Φv=1.5 rad for two-step CFAR with conditional PDF (center point/maximum Pd), two-step CFAR with marginal PDFs (center point/maximum
Pd), 2D CFAR with joint PDF, and LRT based on NP
criterion.Figure 8shows that the performance of two-step CFAR detector choosing the center point of the iso-Pfacurves is much poorer than the two-step CFAR detector using the threshold for maximumPd. Moreover, the performance of the two-step CFAR detector using the threshold for maximumPd is much close to the 2D CFAR detector with joint PDF.
4. Performance Analysis and Comparisons
4.1. Receiver Operating Characteristics. To measure the qual-ity of the ATI CFAR detectors, Receiver Operating Char-acteristics (ROC) curves for different SCRs and CNRs are exploited, that is, Pd versus Pfa for different parameters. Figure 9 shows ROC curves versus SCR and CNR with
detector withΦ, step CFAR with conditional PDF, two-step CFAR with marginal PDFs, 2D CFAR detector with
joint PDF and LRT based on NP criterion, CNR = 0 dB,
SCR=0 dB, 5 dB; and SCR=0 dB, CNR=0 dB, 10 dB. To compare the performance much clearly, the axis of Pfa is used as log-coordinate. The performance of one-step CFAR detector with Φis much poorer than other detectors. The LRT based on NP criterion yields a benchmark performance for other detectors. Under some SCRs or CNRs, the two-step CFAR detector with conditional PDF shows much better performance than the 2D CFAR detector. The performance of the two-step CFAR detector is much worse than the other
η−Φdetectors, especially under low SCR condition.
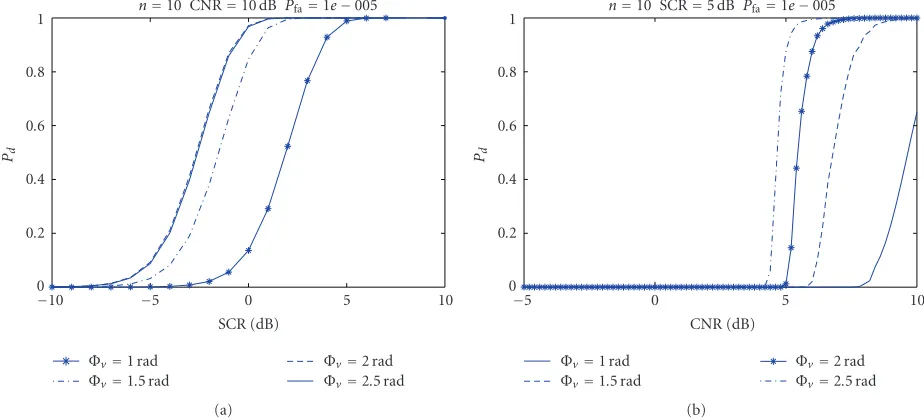
4.2. Probability of Detection versus Radial Velocities of Moving Target. Another measure of the ATI CFAR detectors’ quality isPdversus the radial velocities of moving target for different SCRs and CNRs.Figure 10showsPdversus the radial velocity withn = 10, Vr = 0 : 35 m/s, andPfa = 10−5 for one-step CFAR detector withΦ, two-step CFAR with conditional PDF, two-step CFAR with marginal PDFs, 2D CFAR detector with joint PDF and LRT based on NP criterion, for SCR
= 0 dB, CNR =0 dB, 10 dB. The radar system parameters are: satellite speedVs =7.6 Km/s, altitudeH =625.87 Km, center frequency 9.65 GHz, PRF = 3.15 KHz, along-track baseline 2.4 m, antenna size (length×width) 5.4 m×0.9 m,
chirp bandwidth CB=100 MHz. The minimum detectable
velocity (MDV) as an important system design parameter is limited by the radar parameters, Pfa,Pd, target RCSs, and signal processing and detection techniques. Based on the above parameters, Pd is 0.9. Figure 10shows that the two-step CFAR detector with conditional PDF and the 2D CFAR detector with joint PDF may improve the MDV significantly.
The one-step CFAR detector with Φ shows much poorer
performance than the other detectors, which only obtain very lowPdunder low SCR or CNR conditions. The analysis results provide a way to spaceborne SAR-ATI systems quality measure and system design.
5. Conclusion
In this paper, based on the theoretical PDF of interfero-gram’s amplitude-phase for the two hypotheses, several ATI CFAR detectors are analyzed under low SCR or low CNR conditions. The LRT based on the NP criterion yields an upper bound performance for the other detectors. The 2D CFAR detector shows a close performance to the optimum LRT detector, which is also ease to be applied to process the real data. In [1], the author also proposed the theoretical joint PDF for the heterogeneous clutter and the extremely heterogeneous clutter regions. The CFAR detectors analyzed in the paper can also be used under these conditions.
Acknowledgments
The authors wish to thank Dr. C. H. Gierull and Dr. S. Chiu for their important comments and discussions to our paper. This work is supported by the preresearch foudation of
equipment for China under Grant no. 9140A21020609KG01 and no. 51321030101.
References
[1] C. H. Gierull, “Statistical analysis of multilook SAR interfer-ograms for CFAR detection of ground moving targets,”IEEE Transactions on Geoscience and Remote Sensing, vol. 42, no. 4, pp. 691–701, 2004.
[2] C. H. Gierull, “Moving target detection with along-track SAR interferometry: a theoretical analysis,” Tech. Rep. DRDC-OTTAWA-TR-2002-084, Defence Research and Development, Ottawa, Canada, August 2002.
[3] S. Chiu, “A constant false alarm rate (CFAR) detector for RADARSAT-2 along-track interferometry,”Canadian Journal of Remote Sensing, vol. 31, no. 1, pp. 73–84, 2005.
[4] F. Meyer, S. Hinz, A. Laika, D. Weihing, and R. Bamler, “Performance analysis of the TerraSAR-X traffic monitoring concept,”ISPRS Journal of Photogrammetry & Remote Sensing, vol. 61, no. 3-4, pp. 225–242, 2006.
[5] S. Chiu, “Clutter effects on ground moving target velocity estimation with SAR along-track interferometry,” in Proceed-ings of International Geoscience and Remote Sensing Symposium (IGARSS ’03), vol. 2, pp. 1314–1319, Toulouse, France, July 2003.